

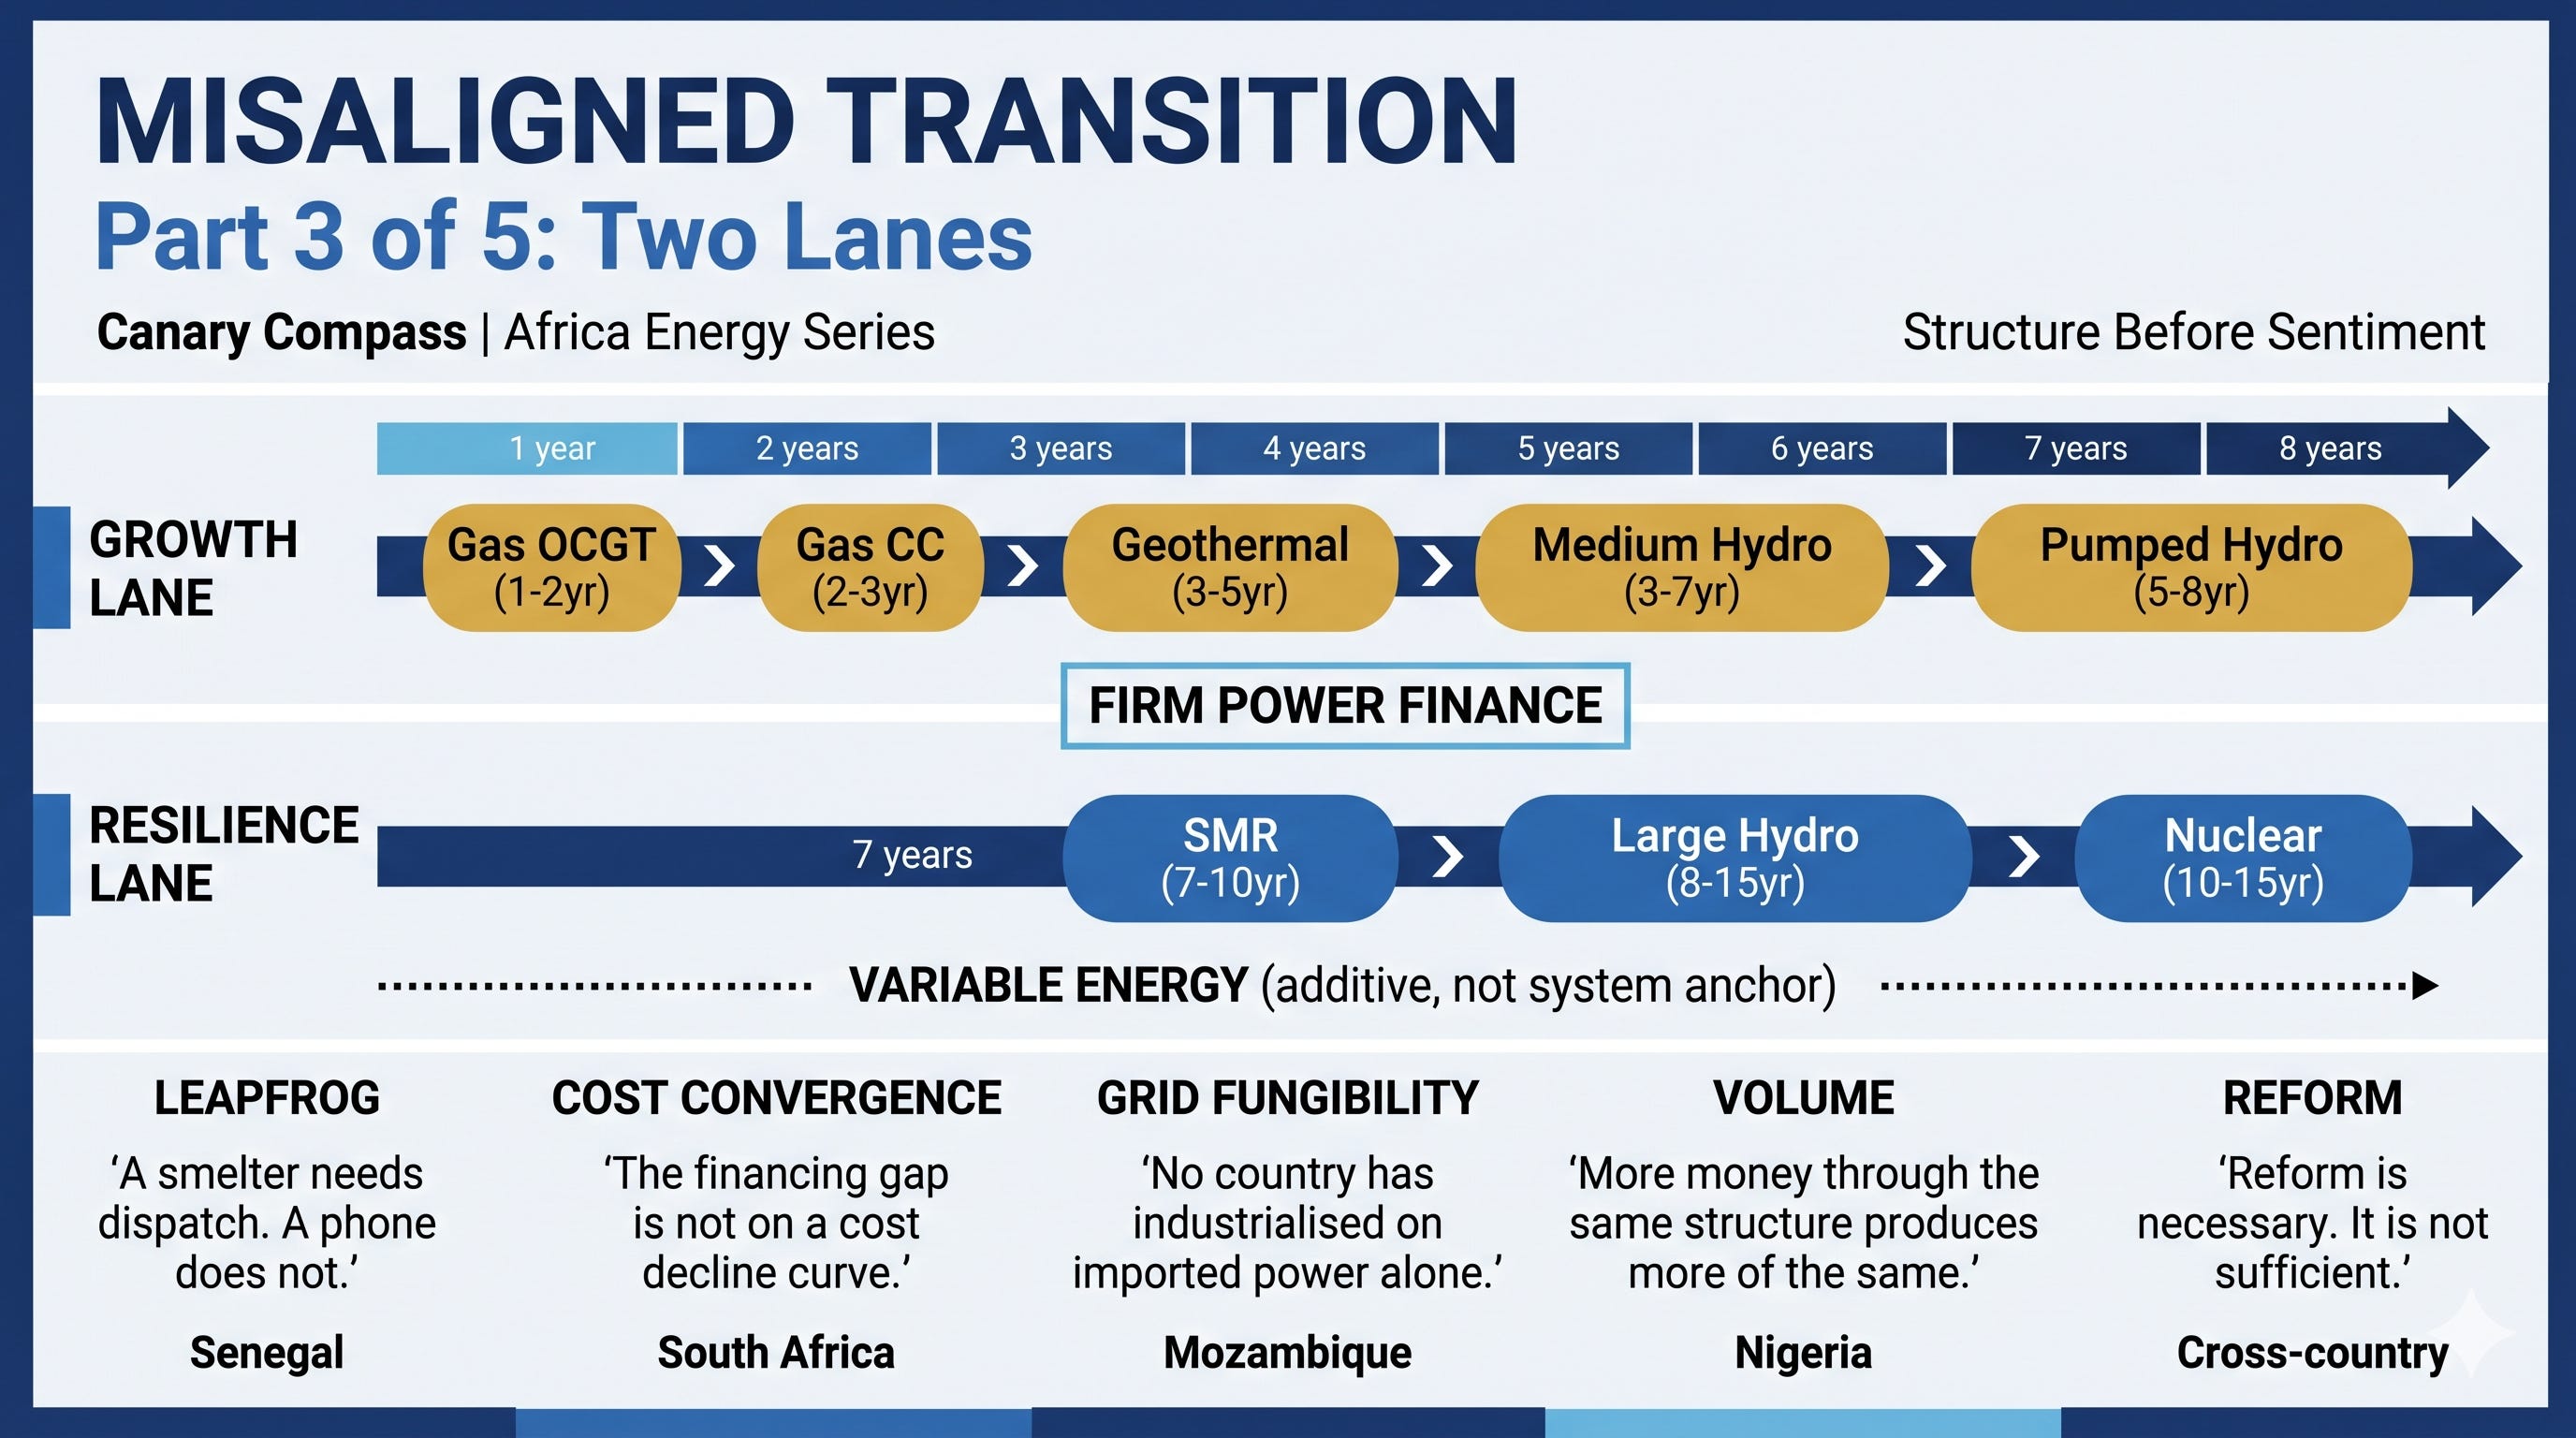
AI-generated Illustration: Africa's transition does not begin with the displacement of firm power. It begins with the financing of it.
Misaligned Transition is a five-part series. Part 1: The Taxonomy Problem (18 May). Part 2: The China Ceiling (22 May). Part 4: Misaligned Capital (27 May). Part 5: Whose Transition? (1 June).
Every major energy transition report published in the past two years leads with the same proposition. Renewable deployment is accelerating. Costs are falling. The path is clear. African economies should follow it.
Part 1 of this series built a taxonomy that separates what the climate finance label conflates. Part 2 tested that taxonomy against China and found expansion with marginal substitution. Even after roughly USD4 to 5 trillion in clean energy investment from 2015 to 2025, fossil fuels still supplied 86 per cent of China’s primary energy under the direct accounting method. The firm power base did not shrink. It was repurposed. The transition China is executing required 1,210 gigawatts of coal to transition from.
Africa does not have 1,210 gigawatts of anything. Total installed generation capacity across the continent is approximately 260 gigawatts (IEA). Peak demand regularly exceeds available supply in most sub-Saharan markets. Africa cannot follow China’s path. The question is whether it can build the firm power base that makes an energy transition structurally possible, using gas where China used coal, within a financing architecture that restricts capital for firm power.
The answer requires two things this essay provides. First, a map: Africa’s firm power options run on two lanes. The Growth Lane delivers firm power within this decade. The Resilience Lane secures it for the decades beyond. Both contain real, identified, and in several cases already producing assets. Second, a diagnostic: five assumptions dominate current energy transition discourse applied to Africa, each offering a reason to believe the firm power base is unnecessary. Each is wrong. Until they are named and removed, the capital to build the firm base will not arrive, because the assumptions provide the intellectual justification for not sending it.
1. What Africa Has
Part 1 specified two lanes within Firm Power Finance. The Growth Lane delivers firm power with speed: technologies that commission within one to eight years and serve industrialisation decisions being made this decade. The Resilience Lane delivers firm power with time: technologies that take seven to fifteen years and position economies for sovereign energy security in the decades beyond. Part 2 tested the cost structure at global, Chinese, and African financing conditions (Table 3). This section maps Africa’s position against both lanes.
One distinction is necessary before the mapping. Diesel and heavy fuel oil appear in Part 1’s Table 1 because they deliver firm power immediately, deploying in weeks to months at USD200 to USD400 per megawatt-hour. But diesel is not a source on which any country builds an energy system. It is what fills the gap when the system has not been built. Senegal’s Karpowership fleet, Nigeria’s tens of millions of private generators, and South Africa’s open-cycle gas turbines running on diesel during peak load-shedding all demonstrate the same pattern. Diesel fills the firm power gap at three to five times grid cost. Diesel is consequence, not strategy. Its presence at this scale across Africa is the clearest evidence that Firm Power Finance has failed. The table below maps the strategic options.
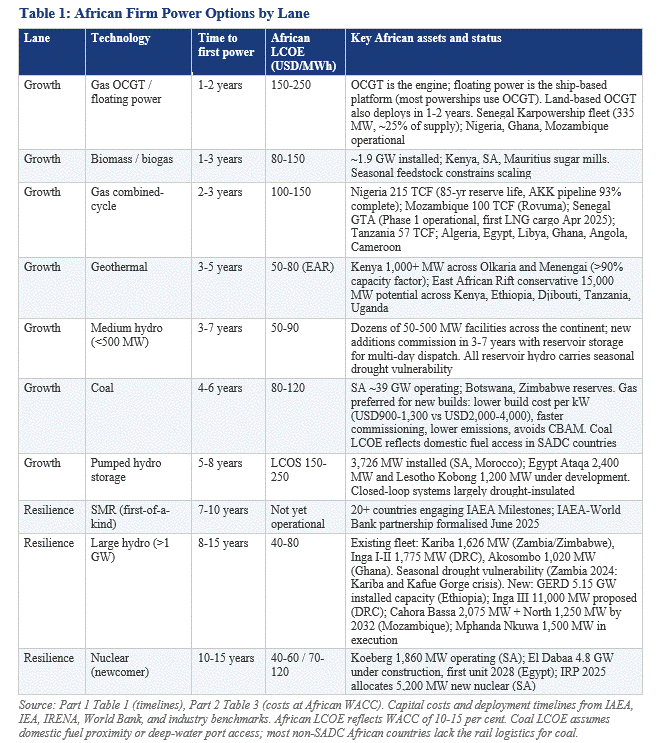
Three sources carry the strategic weight for this decade.
Gas combined-cycle is the most broadly deployable Growth Lane technology because it combines speed, dispatchability, and resource availability across more African jurisdictions than any alternative. At USD100 to USD150 per megawatt-hour in Africa, it is well below half of diesel cost and commissions in two to three years. Nigeria, Mozambique, Tanzania, Algeria, Egypt, and at least nine other countries hold commercial gas reserves. The fuel exists. The generation capacity to convert it to firm power at industrial scale does not. For countries without domestic gas, the Growth Lane runs through geothermal and medium hydro, where climate finance is available but exploration risk capital and project preparation funding remain insufficient relative to the potential. Countries without any domestic firm power resource depend on cross-border Grid Finance to import power from neighbours, a separate financing challenge that Part 1 identified as the third underfunded category.
Geothermal is the cheapest firm power source where the geology permits. At USD50 to USD80 per megawatt-hour in the East African Rift, it outperforms every alternative on cost and reliability at above 90 per cent capacity factor. Kenya’s installed geothermal capacity crossed 1,000 megawatts in early 2026 with the completion of new capacity at Menengai alongside the established Olkaria complex. The Rift holds a conservative estimated 15,000 megawatts of exploitable resource across Kenya, Ethiopia, Djibouti, Tanzania, and Uganda. At a household level, a kilowatt-scale battery provides firmness for hours. A copper smelter or fertiliser plant requires firmness at hundreds of megawatts for years. Geothermal provides the second. Batteries do not.
The Resilience Lane secures the decades beyond. Ethiopia’s Grand Ethiopian Renaissance Dam provides 5.15 gigawatts of installed firm hydro capacity, financed through domestic sovereign resources and inaugurated in September 2025. Egypt’s El Dabaa nuclear plant (4.8 gigawatts) is under construction with sovereign vendor finance. South Africa’s IRP 2025 allocates 5,200 megawatts of new nuclear by 2039. North African economies operate at lower sovereign risk premiums and have secured firm power financing through bilateral channels outside the climate finance architecture. Their success reinforces the diagnosis: firm power is funded when capital is unconstrained by the green label or when sovereign risk permits commercial terms.
The strategic map is clear. The Growth Lane offers six strategic pathways from one to eight years. The Resilience Lane positions three technologies for the decades beyond. The options are identified, technically proven, and in several cases already operating. They remain largely unfunded through the international climate finance architecture.
The rest of this essay examines why. Five assumptions in current energy transition discourse provide the intellectual justification for not funding them.
2. Five Fallacies
Fallacy 1: Africa can skip firm power and go straight to variable.
IRENA’s 2021 Renewable Energy Transition in Africa report proposed that African countries “leapfrog fossil fuel technologies.” Power Shift Africa’s 2025 report argued for 100 per cent renewable energy by 2050. The leapfrog narrative borrows from telecommunications: Africa skipped fixed-line telephony and built mobile networks directly. The analogy fails on one condition. A phone call does not require dispatchable power. A copper smelter does.
Mobile telephony leapfrogged landlines because the service is identical regardless of delivery infrastructure. Energy does not work this way. Solar delivers electricity when the sun shines. Gas delivers electricity when the operator commands it. For a household charging a phone, the distinction is manageable. For a ferrochrome furnace running a continuous reduction process, the distinction is the difference between operation and shutdown. A kilowatt-scale battery provides firmness for hours at household level. An industrial load measured in hundreds of megawatts requires firmness measured in years. That is a physics constraint, not a technology problem that cost declines will close on a policy-relevant timeline.
Senegal demonstrates the leapfrog in practice. The country has offshore gas reserves at Greater Tortue Ahmeyim, a gas-to-power strategy targeting 75 per cent of installed capacity, and a regulatory framework designed to convert domestic gas into firm power. Dedicated climate-labelled instruments make gas-to-power funding structurally difficult and slow, requiring exception processes that few African sovereigns navigate successfully. While permanent firm power waited for capital, Senegal contracted a Karpowership fleet, floating power vessels running initially on heavy fuel oil and later on imported LNG. Total installed capacity reached 335 megawatts, supplying approximately 25 per cent of national electricity. The Senegalese Court of Auditors (December 2023) flagged unjustified payments of CFA3.7 billion and CFA9.2 billion. Annual cost runs CFA30 to CFA50 billion (USD50 to USD80 million). Prime Minister Sonko announced on 27 August 2025 that Senegal would halt gas imports in 2026, targeting CFA140 billion (USD227 million) in annual savings through domestic gas production. Sonko was dismissed from office on 23 May 2026. The domestic gas conversion timeline may shift under the incoming administration. The structural argument is unchanged.
As of early 2026, GTA Phase 1 is fully operational and exporting LNG internationally. Domestic gas has not yet reached the Senegalese grid. Pipeline construction to the coast begins in the second quarter of 2026. Senegal is exporting gas from a producing field while paying for floating power vessels. The firm power gap is operating in real time.
The leapfrog did not skip firm power. It rented firm power at emergency rates because the permanent version was never funded. That is a premium paid for the absence of Firm Power Finance.
The countries that did not attempt the leapfrog confirm the pattern. Between 2015 and 2024, ASEAN economies added 79 gigawatts of fossil capacity alongside 56 gigawatts of renewables (Enerdata, 2025). Vietnam and Indonesia built firm power alongside variable energy. Bangladesh, outside ASEAN but facing similar industrialisation pressures, did the same. Their grids function. Their industrial bases are expanding.
The transport parallel reinforces the point. Part 2 reported that NEVs reached 40.9 per cent of total Chinese vehicle sales in 2024 (CAAM), with passenger car penetration crossing 50 per cent in monthly data by late 2024 (CPCA). The 2025 data extends the milestone to total vehicle sales: CAAM recorded NEV penetration of 51.6 per cent in October 2025, the first month above 50 per cent when commercial vehicles are included. Yet cumulative fleet share remains under 10 per cent because 300 million existing vehicles turn over in 15 to 20 years. Deployment in new sales is not displacement in the operating stock. China can afford to wait. An African economy without the firm base cannot, because there is nothing to turn over from.
Africa is being asked to do what no industrialising economy has done: build an industrial base on variable energy without a firm power foundation. The leapfrog framing provides the intellectual permission. The Senegalese Karpowership provides the empirical refutation.
Fallacy 2: Falling storage costs and firm renewable projections close the gap at African financing terms.
Battery costs have fallen 90 per cent since 2010. IRENA’s 2026 assessment reports firm solar LCOE of USD54 to USD82 per megawatt-hour at global weighted average cost of capital. Solar plus four-hour storage already undercuts gas peakers for grid balancing. The cost curves are converging. BloombergNEF and RMI projections suggest that by the time Africa builds gas plants, the technology will be obsolete. The argument is correct at global WACC. It is wrong at African WACC.
Part 2 documented the cost structure across all eighteen energy sources (Table 3). Gas combined-cycle runs USD40 to USD75 per megawatt-hour at global WACC and USD100 to USD150 at African WACC of 10 to 15 per cent. Solar PV runs USD34 to USD43 globally and USD40 to USD80 in Africa. Battery storage at four-hour duration runs USD100 to USD200 globally and USD150 to USD300 in Africa. The ranking that holds at 4 to 6 per cent cost of capital breaks at 10 to 15 per cent.
The technology gap is closing. The financing gap is not. African sovereign risk premiums have not declined. Blended finance, first-loss guarantees from IDA and MIGA, and DFI subordination can compress effective WACC for individual projects. They have not done so at programmatic scale for firm power. No programmatic procurement facility equivalent to the REIPPPP exists for gas-to-power across the continent. The instruments exist. The programmatic architecture to deploy them at scale does not. None of the conditions that drive the WACC differential, fiscal position, institutional stability, currency risk, creditworthiness of the off-taking utility, are on a cost decline curve.
South Africa demonstrates the procurement asymmetry that Part 1 documented in general terms and Part 3 identifies as a specific mechanism. The REIPPPP has procured over 6 gigawatts of variable energy across Bid Windows 1 through 4, with R256 billion in private investment committed. Bid Window 7 procured 3,940 megawatts, all solar PV. Variable energy arrived because the capital existed for it, the auction structure worked, and the international financing architecture accommodated it.
Firm power did not follow. The GASIPPPP, designed to procure 2,000 megawatts of gas-to-power, was launched on 14 December 2023. The original bid submission deadline has been extended three times, most recently to 29 May 2026. Two and a half years after launch, no gas IPP capacity has been awarded. South Africa’s IRP 2025 allocates 6,000 megawatts of gas by 2030 and 16,000 megawatts by 2039. The allocation exists in policy. The procurement vehicle has not produced committed capacity. South Africa also lacks domestic gas production, which adds fuel supply and currency risk that variable energy procurement does not face. This reinforces rather than contradicts the series argument: the countries where gas is most viable, those with domestic reserves, are where the financing restriction is most consequential.
The contrast is dispositive. Identical domestic conditions, same sovereign risk, same off-taker, same institutional framework, produced over 6 gigawatts of variable energy and zero awarded firm power capacity. Within the current financing architecture, capital allocators are acting rationally. Variable projects are faster to permit, carry lower execution risk, and access favourable climate-labelled terms that gas cannot. The rationality of the allocation is not in question. The architecture that makes variable the only rational choice is.
DFIs have financed gas-to-power in multiple African markets: IFC’s equity in Azura-Edo (Nigeria, 461 megawatts), AfDB’s financing of Kribi (Cameroon, 216 megawatts) and Kpone (Ghana, 300 megawatts). These demonstrate that gas financing is possible. They also demonstrate its limitations: transaction-specific, individually structured, and operating at a fraction of the programmatic scale that variable energy procurement achieves.
The JETP compounds the pattern. USD8.5 billion was pledged at COP26. The United States withdrew in February 2025. According to the Presidential Climate Commission and independent analysis (Wits; TNI), the vast majority of commitments are structured as loans, with grant funding disproportionately directed to foreign entities. Electricity infrastructure allocations were spent on technical assistance and feasibility studies rather than generation or transmission assets. The JETP finances Energy Volume Finance by structure. It does not finance firm power.
The technology gap is a solvable problem. The financing gap is structural. Part 4 addresses it.
Fallacy 3: Cross-border transmission substitutes for domestic firm power at industrial scale.
The AfDB and World Bank have framed regional interconnection as a pathway to energy security. The argument is elegant in theory. Mozambique has gas. The DRC has hydro. Kenya has geothermal. Ethiopia has GERD. Connect the grids, trade the electrons, and geographic smoothing provides firmness without every country building its own firm base.
The argument fails on three conditions: infrastructure, timelines, and political risk.
The infrastructure does not exist at the required scale. SAPP has 60.8 gigawatts of installed capacity across twelve member states with 50.1 gigawatts of peak demand. Nine countries are interconnected. Trading remains a fraction of total demand. EAPP’s Day Ahead Market was planned for 2025 and remains under implementation. WAPP trades approximately 7 per cent of regional power. Africa’s transmission investment gap is estimated at USD120 billion. Grid Finance, as Part 1 specified, is not what the green taxonomy funds.
Cahora Bassa illustrates the gap between installed generation and delivered firm power. The facility operates at 2,075 megawatts in central Mozambique. Its HVDC transmission line runs 1,420 kilometres to Johannesburg with 1,920 megawatts of transfer capacity. In 2024, it generated over 12,000 gigawatt-hours (HCB). On paper, this is the SAPP model: firm hydro in one country serving industrial demand in another.
In practice, the transmission line was destroyed during Mozambique’s civil war from 1977 to 1992 and only fully restored in the late 1990s. The Songo converter substation has been identified as the weak link, with rehabilitation underway. Cahora Bassa North (1,250 megawatts) expects commercial operation in 2032. Mphanda Nkuwa (1,500 megawatts, USD4.5 billion, 1,300 kilometres of new transmission lines) is in execution stage. The transmission connecting Mozambican gas and hydro to Southern African demand is either unbuilt, underbuilt, or crosses territory affected by armed conflict in Cabo Delgado.
The timeline mismatch is as binding as the infrastructure gap. Cross-border transmission takes a decade or more from feasibility to commissioning. The Ethiopia-Kenya HVDC interconnector has been under development for over a decade. A copper smelter in Kitwe cannot wait for a transmission line from Mozambique that may commission in 2032. It needs firm power on its grid today.
Europe’s integrated grid took sixty years to build. Africa does not have sixty years if the industrialisation window is this decade. And even the European grid did not eliminate the need for domestic firm power. France runs nuclear. Germany dismantled its nuclear fleet and paid the industrial price documented in Part 1, then restarted coal plants when Russian gas was severed. In 2025, Germany still generated 38 per cent of its electricity from domestic coal and gas. Its energy-intensive industrial output has fallen roughly 18 per cent since 2021 (Destatis), and the economy contracted in both 2023 and 2024. The 56 per cent renewable share was achieved partly because the industrial base that consumed firm power contracted. The most interconnected country in the most integrated power pool in the world still depends on domestic firm power. The grid supplements it. It does not substitute for it.
No country in any interconnected power pool anywhere in the world has industrialised without domestic firm power.
Fallacy 4: Climate finance scale-up will eventually redirect toward firm power.
Current climate finance flows to Africa are insufficient. When volumes reach the scale the IEA and Songwe-Stern-Bhattacharya report call for, the financing architecture will have to accommodate firm power. More money will eventually mean different money. The system will self-correct through scale.
The argument misidentifies the binding constraint. The conflation of four functions diagnosed in Part 1 is upstream of the volume question. More capital through the same structure produces more of the same allocation at larger scale.
The IEA’s World Energy Investment 2025 reports that private sector clean energy investment in Africa tripled from approximately USD17 billion in 2019 to nearly USD40 billion in 2024. The volume grew. The allocation remained concentrated in variable energy. Public and DFI funding fell by one-third over the same period, reaching USD20 billion in 2024, driven largely by an 85 per cent reduction in Chinese development finance spending. Africa’s share of global clean energy investment stands at 2 per cent. Tracked clean energy deal values reached USD13.84 billion in 2025. Solar dominates. Wind follows. The volume tripled over five years. The firm power share did not.
Nigeria illustrates both the international and domestic dimensions. The country holds 215 trillion cubic feet of proven gas reserves as of January 2026, with an 85-year reserve life. The AKK gas pipeline is 93 per cent complete. Domestic governance failures, including pipeline vandalism, distribution company insolvency, and federal-state coordination breakdowns, compound the firm power deficit. Climate finance arrives in Nigeria for solar. It does not arrive for gas-to-power generation at the scale the reserves justify, because dedicated climate-labelled instruments do not accommodate gas regardless of the domestic context. The governance failures and the architecture constraint operate simultaneously.
The result is Africa’s largest economy running on widespread diesel self-generation. The World Bank has documented approximately 22 million generators in Nigeria, with unreliable electricity causing economic losses estimated at roughly USD25 billion annually. That is firm power delivered through the most expensive, most polluting channel possible.
The volume fallacy provides a reason to defer structural reform. If the system will self-correct through scale, the urgency to redesign it recedes. That logic produces the outcome Part 1 diagnosed: more megawatts on paper, fewer kilowatt-hours per person. The corrective is not less climate finance. It is differently structured climate finance. Part 4 specifies what that looks like.
Fallacy 5: Regulatory reform attracts firm power capital.
Fallacy 4 addressed the supply of international capital. This fallacy addresses the demand side: what happens when domestic reform succeeds at attracting it.
Part 1 documented the AfDB Electricity Regulatory Index finding that reform implementation does not equal performance outcome. The ERI measured reform against utility performance. The parallel here is narrower: reform measured against the technology composition of the capital it attracts. The assumption is that if African countries build the right regulatory frameworks, firm power capital will follow.
The investment follows. It follows for what the international financing architecture accommodates.
South Africa’s procurement asymmetry, documented in Fallacy 2, is the sharpest evidence. The same institutional framework that delivered gigawatts of variable energy has not produced committed firm power capacity in two and a half years. International capital responded to the variable procurement vehicle. It has not responded to the firm power vehicle.
Kenya opened its power market to independent power producers earlier than most African economies. It became the continental leader in off-grid solar. Geothermal at Olkaria proves that firm power can operate at world-class standards within an African regulatory environment. Yet Part 1 documented the consequence: the Microsoft G42 data centre stalled when power availability, scale, and bankable offtake guarantees could not align, because the firm power expansion required to serve it was never funded. The regulatory framework attracted capital for variable energy.
Senegal legislated gas-to-power. Greater Tortue Ahmeyim is producing. The domestic conversion requires combined-cycle plants and pipeline infrastructure that the dominant climate-labelled instruments do not fund. Nigeria unbundled and privatised its power sector. Gas-fired plants operate below capacity because pipeline infrastructure and distribution networks require capital that the international financing architecture does not provide at programmatic scale.
The pattern across all four countries is consistent. The reform works. The framework attracts capital. The capital arrives for variable energy because the fastest-growing pool of international financing is structurally configured for it. The allocation is rational within the current structure. The structure is the variable under examination.
This is the most operationally consequential of the five fallacies for African policymakers. Improving the investment environment, the standard multilateral prescription, does not solve the firm power problem on its own. The reform is necessary. It is not sufficient. Without reform at the international architecture level, domestic regulatory reform produces more variable energy investment. Part 4 examines what architecture reform requires.
3. The Precondition
Five assumptions. Five reasons to believe the firm power base is unnecessary. None survives the evidence.
Africa cannot leapfrog firm power because industrial production requires dispatchable electricity. Cost convergence fails at African financing terms because the WACC differential transforms the technology ranking and no programmatic de-risking facility closes the gap at scale. Cross-border transmission supplements domestic firm power but does not substitute for it on current infrastructure and timelines. Climate finance volume will not self-correct because the conflation is upstream of the volume. Regulatory reform attracts capital that funds variable energy because the international financing architecture shapes the allocation.
The precondition from Part 2 holds. China could begin transitioning coal to backup because it had 1,210 gigawatts to transition from. Africa’s version substitutes gas for coal, but the structural requirement is identical: the firm base must exist before the transition can begin. Section 1 mapped the options across both lanes. The Growth Lane offers gas, geothermal, and medium hydro within this decade. The Resilience Lane positions nuclear and large hydro for the decades beyond. The options are real. They remain unfunded at the programmatic scale the continent requires.
The five fallacies explain why. Together they constitute the assumption architecture that prevents Firm Power Finance from reaching the options that exist. Removing the assumptions does not build the firm base. It clears the ground so that the financing architecture can be redesigned to build it.
Africa’s transition does not begin with the displacement of firm power. It begins with the financing of it.
The corrective does not require new institutions. It requires the existing architecture to separate the four functions it currently conflates and price each one for what it delivers. Part 4 maps the specific instruments, from green bonds to DFI concessional windows to JETP vehicles, against the four functions. It identifies where the architecture accommodates firm power and where it does not, and specifies what a corrective structure requires.
Sources
Bloomberg New Energy Finance, Energy Transition Investment Trends 2026 (New York, January 2026).
China Association of Automobile Manufacturers (CAAM), Monthly Vehicle Sales Data 2024-2025 (Beijing, various dates).
Enerdata, Global Energy and Climate Trends 2025 (Grenoble, April 2025).
Hidroeléctrica de Cahora Bassa, Annual Report 2024 (Songo, 2025).
International Energy Agency, World Energy Investment 2025 (Paris, June 2025).
IRENA, The Renewable Energy Transition in Africa (Abu Dhabi, March 2021).
IRENA, Renewable Power Generation Costs in 2024 (Abu Dhabi, July 2025).
IRENA, 24/7 Renewables: The Economics of Firm Solar and Wind (Abu Dhabi, May 2026).
Karpowership, Senegal Operations Update (Istanbul, July 2025).
Kosmos Energy, 2025 Annual Report and Fourth Quarter Results (Dallas, February 2026).
Nigerian National Petroleum Company, 2025 Annual Statistical Bulletin (Abuja, 2026).
Power Shift Africa and University of Technology Sydney, African Energy Leadership: The Case for 100% Renewable Energy (Nairobi and Sydney, June 2025).
Presidential Climate Commission, South Africa JETP Investment Plan Progress Report (Pretoria, 2025).
Republic of Senegal, Court of Auditors, Annual Report 2023 (Dakar, December 2023).
South Africa Department of Mineral Resources and Energy, Integrated Resource Plan 2025 (Pretoria, 2025).
South Africa Department of Mineral Resources and Energy, Gas Independent Power Producer Procurement Programme (Pretoria, December 2023; bid extensions August 2024, October 2025, May 2026).
ThinkGeoEnergy, Kenya Geothermal Capacity Update (Reykjavik, March 2026).
Transnational Institute and University of the Witwatersrand, Analysis of JETP Financing Flows (Amsterdam and Johannesburg, 2025).
World Bank, Nigeria Development Update 2023 (Washington, DC, 2023).
Disclaimer
This article does not constitute legal, financial, or investment advice. The author shares views for perspective and discussion only. Do not rely on them as a substitute for professional advice tailored to your specific circumstances. Always consult a qualified legal, financial, investment, or other professional adviser before making decisions based on this content. The analysis reflects proprietary research undertaken by Canary Compass and the author.
Canary Compass and the author accept no liability for actions taken or not taken based on the information in this article.
The views expressed in this article represent the author’s independent professional analysis and do not constitute an endorsement of any individual, institution, or position. Canary Compass and the author accept no responsibility for how this content is interpreted, excerpted, or recontextualised by third parties not involved in its production and publication. Reproducing any portion of this work in isolation, or in combination with other material, in a manner that misrepresents the author’s original meaning constitutes a distortion of the published record.
The author may hold positions in financial instruments, currencies, or assets discussed or referenced in this publication. Such positions do not constitute a recommendation to buy or sell.
All views, projections, and forecasts reflect the author’s assessment at the time of writing. Data sourced from third parties is believed to be reliable but has not been independently verified. Past performance does not indicate future results.
All content published by Canary Compass is the intellectual property of the author. Reproduction, adaptation, or redistribution, in whole or in part, requires written permission.
About the Author
Dean N. Onyambu is the Founder and Chief Strategist of Canary Compass, a financial research publication focused on African monetary architecture and financial sovereignty. He brings 18 years of experience across trading, fund leadership, and economic policy, with senior roles at Standard Bank, First Capital Bank, and Opportunik Global Fund.
Read and subscribe at www.canarycompass.com.
The Canary Compass Channel is available on @CanaryCompassWhatsApp for economic and financial market updates on the go.
For more insights from Dean, you can follow him on LinkedIn @DeanNOnyambu or X @InfinitelyDean.