
AFRICA ENERGY SERIES: Misaligned Transition
Part 2 of 5: The China Ceiling

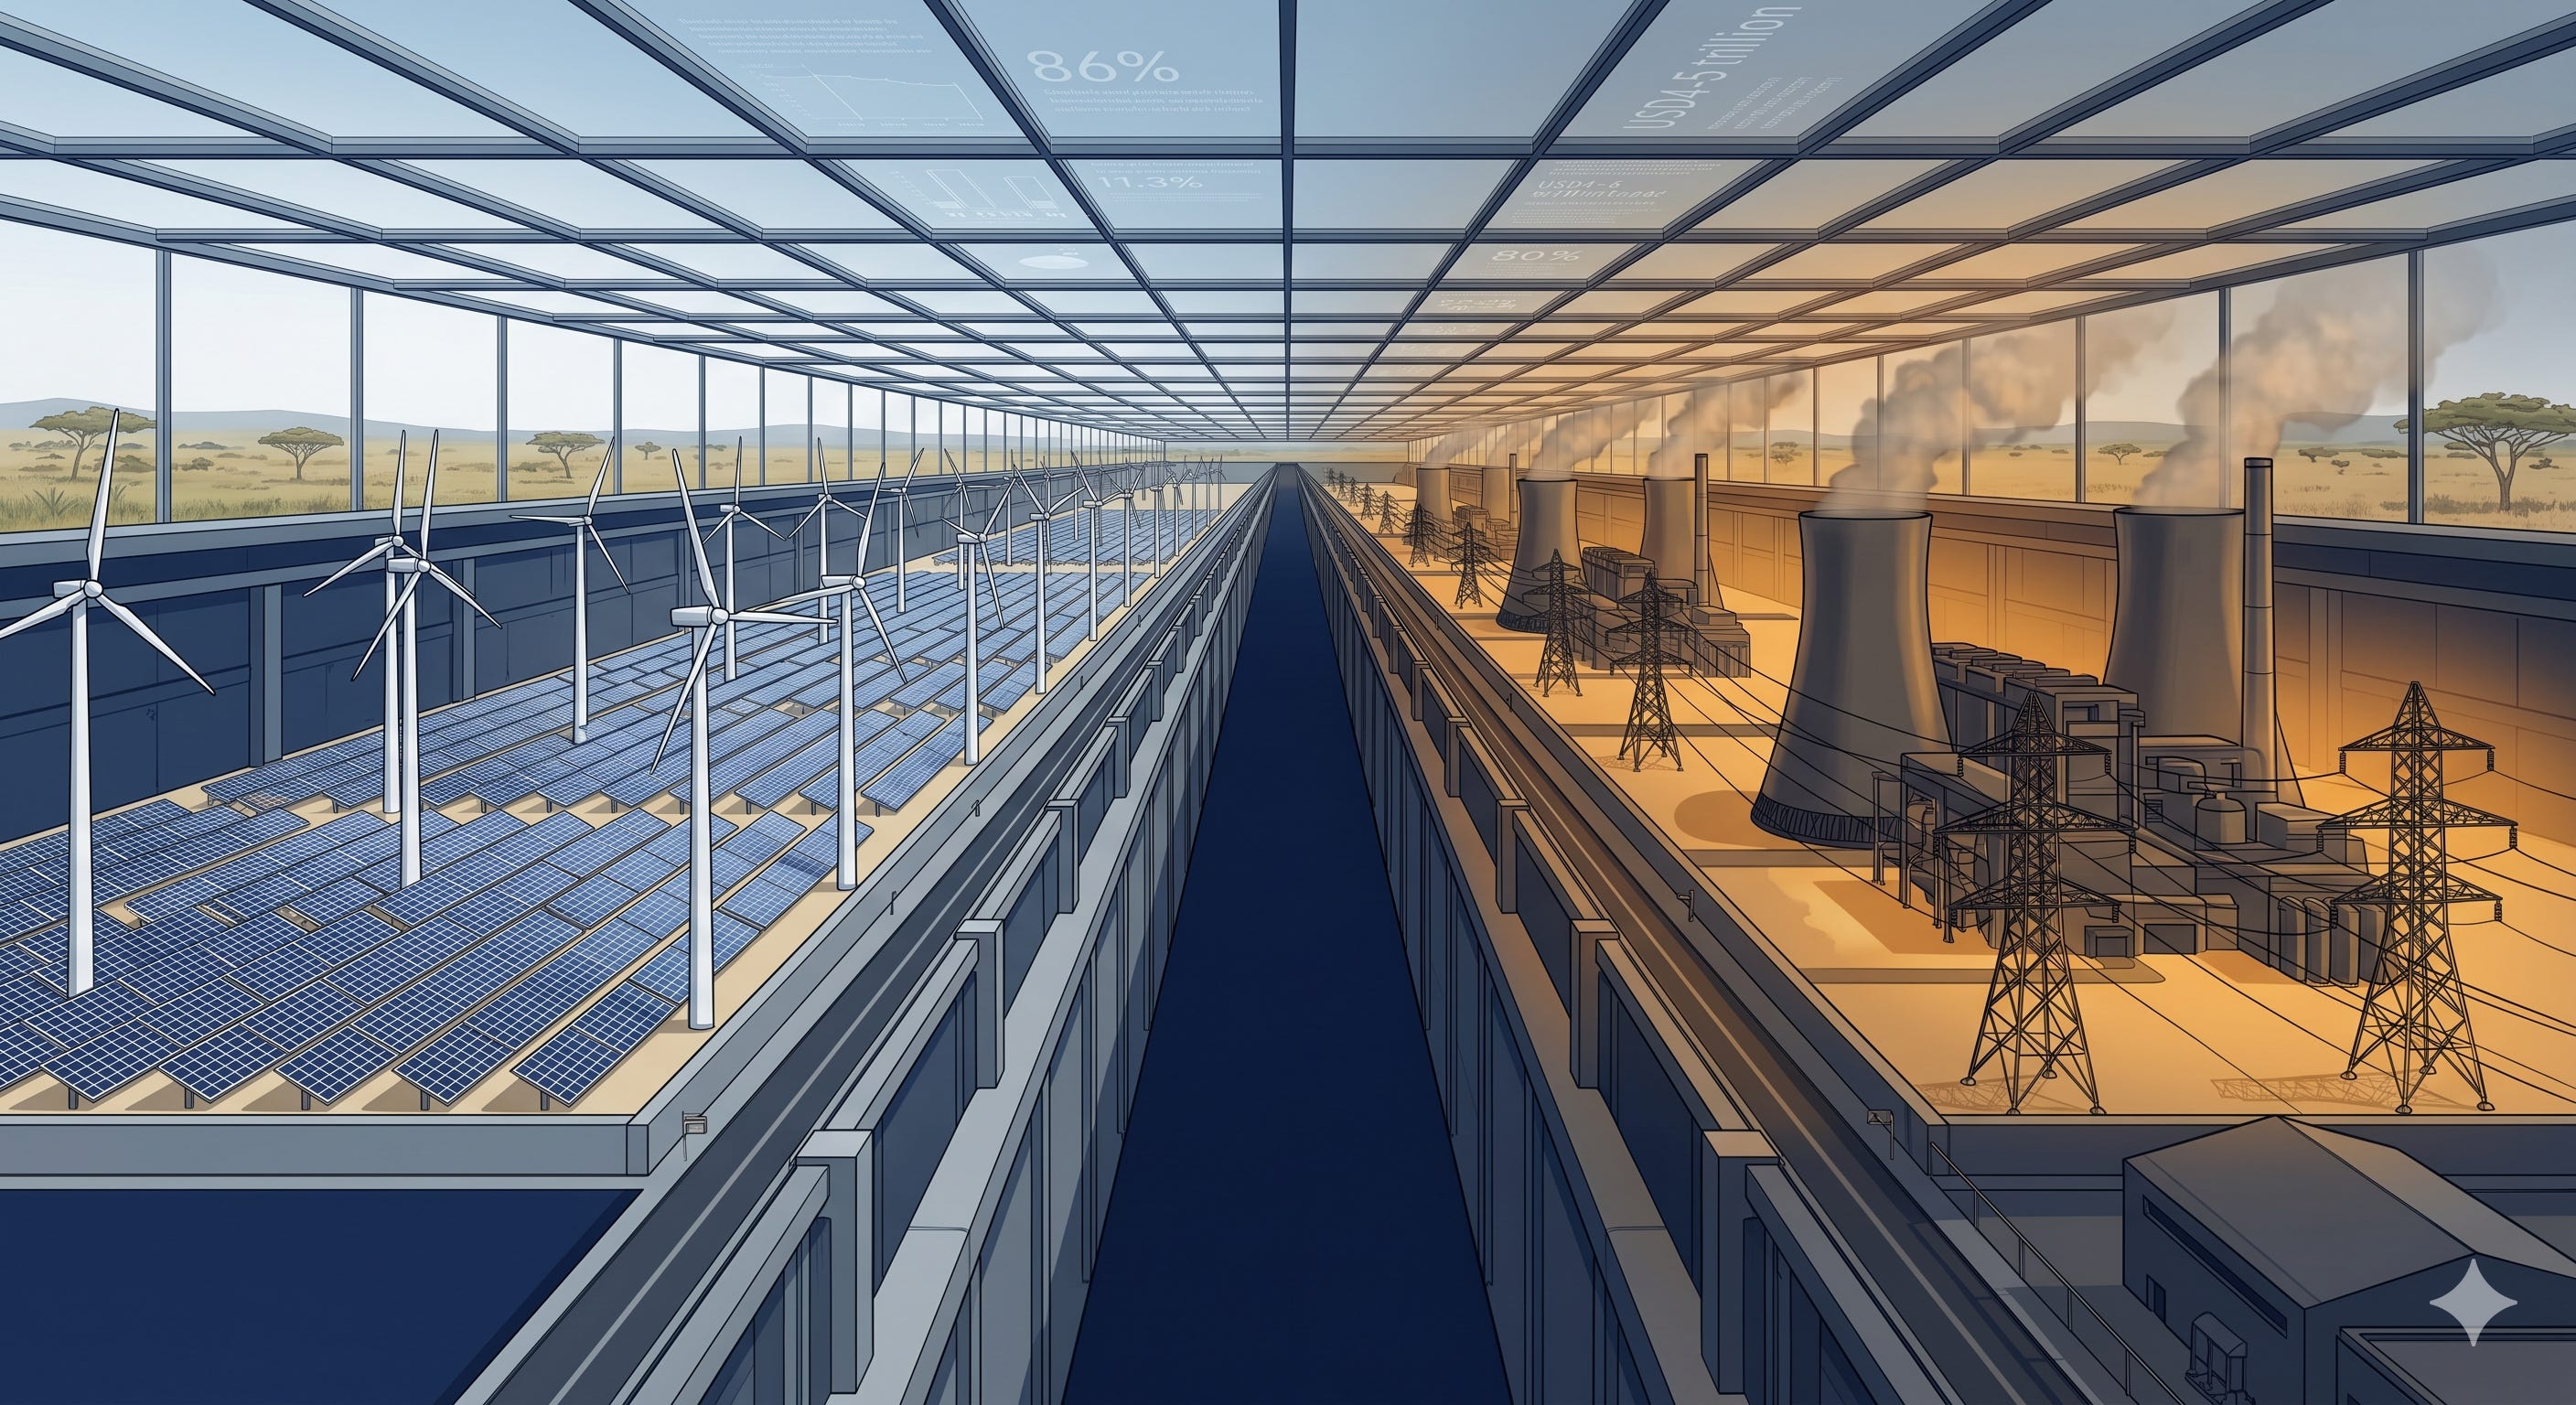
AI-generated Image: The world’s largest clean energy investor still runs on fossil fuel. What does that mean for Africa?
Misaligned Transition is a five-part series. Part 1: The Taxonomy Problem (18 May). Part 2 shifted from 20 May to 22 May. Part 3: Two Lanes (25 May). Part 4: Misaligned Capital (27 May). Part 5: Whose Transition? (1 June).
Pick up any report on global energy transition published in the past twelve months. The headline is the same: China installed more solar and wind capacity than the rest of the world combined. USD625 billion in clean energy investment. 356 gigawatts of renewable capacity added in a single year. The 2030 wind-and-solar target met six years early. The narrative writes itself. The world’s largest energy system is pivoting.
Now read the same year’s data from a different angle. China started construction on 94.5 gigawatts of new coal-fired capacity, the highest level in a decade. The government introduced capacity payments to keep coal plants running even as their utilisation rates fell. Fossil fuels supplied 86 per cent of primary energy under the direct accounting method.
When the Strait of Hormuz came under effective blockade in March 2026, China’s electricity system was largely unaffected. It runs on domestic fuel: coal, hydro, nuclear, solar, and wind. The oil-dependent economy kept functioning, but only because China had built an estimated 1.4 billion barrels of strategic petroleum reserves and was willing to draw them down as Brent surged above USD126. Neither the domestic electricity base nor the strategic reserves are replicable at comparable scale by most economies. Coal generation fell between 1 and 2 per cent in 2025, the first absolute decline since 2015. Total emissions were flat or marginally lower, with Carbon Brief estimating a 0.3 per cent full-year decline.
Both readings are accurate. Part 1’s taxonomy resolves the contradiction. China funds Energy Volume Finance and Firm Power Finance as separate functions because Chinese planners understand they serve different purposes. The global climate finance narrative reports only one. This essay tests the taxonomy against the data.
1. The Stack
Two tables define the starting point. The first shows where China’s total energy comes from. The second shows how its electricity is generated. The gap between them is where the transition narrative breaks down.
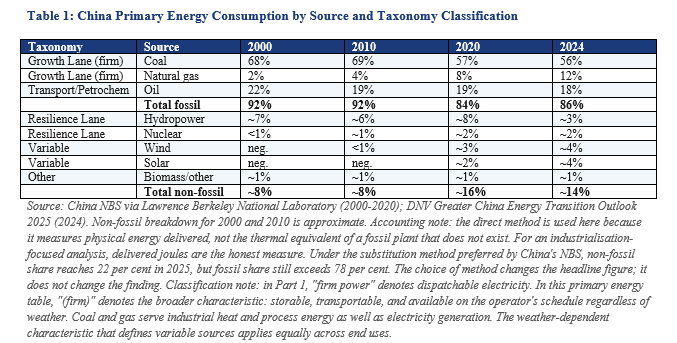
The taxonomy column makes four things visible that the standard reporting conceals. The Growth Lane (firm power with speed) and Resilience Lane (firm power with time) from Part 1 structure the classification.
First, the sources classified as firm in Part 1’s taxonomy (coal, gas, hydro, nuclear) supplied roughly 79 per cent of primary energy in 2000 and roughly 73 per cent in 2024. The firm share barely moved in a quarter-century. Coal declined. Gas and nuclear expanded. Hydro’s share fell not because capacity shrank but because total energy consumption tripled while hydro grew at a fraction of that pace. For Southern African economies that depend on hydroelectric generation, this is a cautionary data point: a growing economy can outrun its hydro base without a single drought.
Second, variable sources (wind and solar) rose from effectively zero in 2000 to approximately 8 per cent in 2024. That is a genuine achievement. It is also 8 per cent of primary energy after two decades and record annual investment.
Third, oil sits outside both lanes. It serves transport, petrochemical, and military functions that neither firm nor variable sources can replace at scale. Its share held at 18 to 22 per cent across the entire period.
Fourth, the fossil-to-fossil reshuffle is the dominant change. Coal and oil fell a combined 16 points. Gas rose 10, absorbing nearly two-thirds of what coal and oil lost. Only 6 points went to non-fossil sources. Most of what looks like transition in the aggregate data is substitution within fossil fuels.
Two decades of the largest clean energy investment programme in history bought six percentage points of fossil share reduction. The electricity table shows where the progress is concentrated.
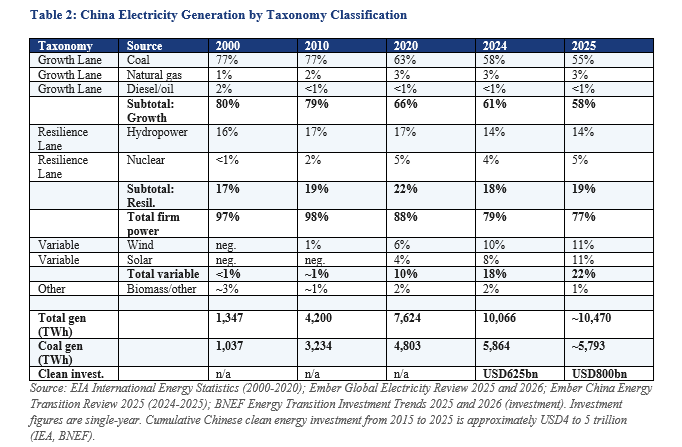
The share trajectory looks like progress. Coal fell from 77 per cent to 55 per cent over twenty-five years. Variable energy rose from negligible to 22 per cent. But the absolute row tells a different story. Coal generation rose from 1,037 terawatt-hours in 2000 to 5,864 terawatt-hours in 2024: a 5.7-fold increase.
The share fell because total demand grew 7.5 times, from 1,347 to 10,066 terawatt-hours. Renewables covered the growth. They did not shrink the coal base. Coal generation did not decline in absolute terms until 2025, and even then by between 1 and 2 per cent from the 2024 peak. Sources vary on the scale: Ember reports 71 terawatt-hours; Carbon Brief 90 terawatt-hours; Wood Mackenzie 1.9 per cent. The differences reflect methodology, not direction.
Cumulative Chinese clean energy investment from 2015 to 2025 is approximately USD4 to 5 trillion. In the electricity column, fossil generation fell from roughly 73 per cent to 58 per cent, a fifteen-point reduction driven almost entirely by coal declining as gas held flat. In primary energy under the direct accounting method, fossil share fluctuated between 84 and 86 per cent over the same period, with no sustained downward trend. Four to five trillion dollars bought fifteen percentage points of fossil reduction in electricity. In primary energy, the needle barely moved.
The diesel row carries its own finding. In 2000, oil-fired generation provided 2 per cent of China’s electricity. By 2010 it was negligible. China displaced diesel from its grid within a decade by building gas and coal. In Africa, as Part 1 documented, diesel fills the firm power gap at three to five times grid cost when hydro, gas, or coal infrastructure cannot deliver reliably. The taxonomy names the same function. The difference is whether the capital arrived to fund the cheaper alternative.
The firm power subtotals are the most important line. In 2000, firm power (Growth plus Resilience) provided 97 per cent of China’s electricity. In 2025 it provides 77 per cent. Variable energy gained twenty points over twenty-five years. But even after this scale of cumulative investment and the most aggressive deployment in human history, firm power still provides more than three-quarters of China’s electricity. The system requires it.
Primary energy is the governing frame for this essay because industrialisation requires thermal process heat, transport fuel, and petrochemical feedstock that the electricity column does not capture. But even within electricity, the pattern holds. The share decline reflects demand growth met by renewables, not contraction of the coal base. Expansion with marginal substitution characterises both columns.
The cost data explains why. Table 3 extends Part 1’s deployment taxonomy with lifecycle cost. Each technology’s capital cost sits alongside its levelised cost of energy (LCOE), which folds capital, fuel, operations, capacity factor, and plant life into one figure.
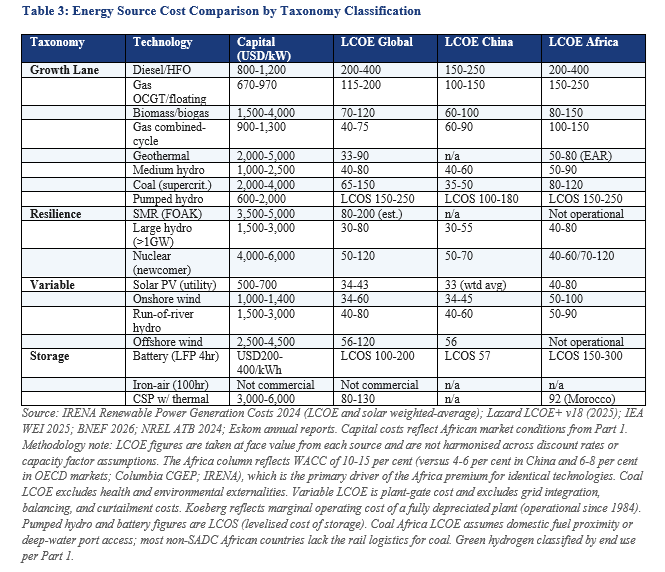
The table inverts the capital cost ranking. Diesel is cheapest to build and most expensive to run. Coal is expensive to build and among the cheapest firm power to run where domestic fuel exists. Solar is cheap to build and cheapest to run per megawatt-hour but sits in the Variable category. A country with capital and a 20-year horizon builds gas combined-cycle domestically, or imports firm power from a neighbour through Grid Finance, and saves on operating costs for decades. A country where neither option materialises watches its industrial operators buy diesel gensets one by one, each paying the operating premium because no one funded the system-level alternative.
The Africa column tells the industrialisation story. A 100 megawatt copper mine that cannot access reliable grid power and runs on diesel at USD300 per megawatt-hour pays approximately USD2.1 billion for electricity over 10 years at 80 per cent load factor. The same mine connected to gas-fired power at USD120 per megawatt-hour pays USD840 million. The USD1.3 billion difference over a single decade for a single facility is the cost of Firm Power Finance that did not arrive. Scale that across the continent’s mining, smelting, and manufacturing sectors, and the capital misallocation the taxonomy diagnoses becomes visible in billions.
China’s column explains its choices. Coal at USD35-50 per megawatt-hour remains among China’s cheapest firm power options under domestic fuel, financing, and dispatch conditions. Solar at USD33 per megawatt-hour (IRENA weighted-average LCOE) is cheaper but does not dispatch on command. Chinese planners build both because their institutions price volume and dispatchability as separate functions with separate financing tracks.
IRENA’s May 2026 report introduces what it calls a “firm LCOE” for hybrid solar-wind-storage systems: USD54-82 per megawatt-hour in high-irradiance, high-wind regions. At global capital costs, this approaches new gas combined-cycle. But at African WACC of 10-15 per cent, the same hybrid configuration costs 40 to 60 per cent more, pushing it above gas combined-cycle in most African markets. The technology gap is closing. The financing gap is not. That is a Firm Power Finance problem that variable energy cost declines alone do not resolve.
2. The Surge
The achievement is extraordinary and the essay must say so before it says anything else.
In 2024, China invested USD625 billion in clean energy at the power-sector level (IEA, World Energy Investment 2025). Under the broader Carbon Brief definition, which includes electric vehicles, batteries, rail, and energy storage, the figure reaches USD940 billion. Clean energy sectors accounted for more than 10 per cent of China’s GDP and contributed roughly a quarter of total GDP growth in 2024 (CREA via Carbon Brief). Without that contribution, GDP growth would have been closer to 3.7 per cent than the reported 5.0 per cent.
China added 277 gigawatts of solar and 79 gigawatts of wind capacity in 2024. In the first half of 2025, it added another 210 gigawatts of solar and 50 gigawatts of wind. It surpassed 1 terawatt of total installed solar capacity. Battery storage investment rose 69 per cent year-on-year, with total installed storage reaching 164 gigawatts by mid-2025. Grid investment reached an all-time high of CNY608 billion (USD85 billion) in 2024.
Chinese firms hold more than 80 per cent of global solar panel production, 80 per cent of battery cell manufacturing, and 70 per cent of electric vehicle production. They account for approximately 75 per cent of global clean energy patent applications, up from 5 per cent in 2000.
This manufacturing scale has consequences beyond China’s borders. Chinese production drove global solar module prices from approximately USD0.50 per watt in 2015 to below USD0.10 per watt in 2024. African solar LCOE fell in step, from USD150-200 per megawatt-hour a decade ago to USD40-80 per megawatt-hour today. The taxonomy does not dispute this benefit.
Cheaper variable energy is valuable for Access Finance and Energy Volume Finance as Part 1 defined them. Wind and solar rose from 18 per cent to 22 per cent of China’s electricity in a single year (Table 2). That is Energy Volume Finance at record scale. The question the taxonomy asks is whether that volume displaces the firm power that runs the industrial base.
3. The Coal Architecture
It does not. The reason is institutional.
In 2024, construction began on 94.5 gigawatts of new coal-fired capacity across China, the highest level since 2015. Another 66.7 gigawatts were newly approved. The IEA estimated coal power investment exceeded USD54 billion in 2025. Part 1 referenced the same figure in the context of 2024 approvals; the IEA’s spending estimate covers 2025. China accounted for 93 per cent of all global coal construction starts. Together with India, the two countries represented 87 per cent of global new coal capacity. Retirements collapsed from 13 gigawatts in 2020 to 2.5 gigawatts in 2024. China’s total coal fleet now exceeds 1,210 gigawatts, up from 1,080 gigawatts at end-2020. At current utilisation rates of roughly 50 per cent, down from 60 per cent in 2011, this fleet produced approximately 5,800 terawatt-hours in 2024 (Table 2). Utilisation is falling because renewables are progressively taking over generation hours that coal once served. In that narrow sense, variable energy is displacing coal from daytime and evening dispatch. But as CREA and Global Energy Monitor documented in February 2026, “falling utilisation has not led to an orderly exit, but instead growing reliance on compensation mechanisms.” The fleet is growing, not retiring. Coal’s generation role is shrinking. Its availability role, providing dispatchable backup for weather events, demand spikes, and seasonal variation, is being institutionalised through capacity payments. That is the separation the taxonomy names: Energy Volume Finance funds the generation that displaces coal’s hours. Firm Power Finance, through capacity payments, funds the availability that variable energy cannot guarantee.
Three institutional mechanisms protect coal economics against displacement.
First, capacity payments. In late 2023, the NDRC introduced a capacity payment mechanism for coal-fired power plants at CNY330 per kilowatt per year (approximately USD47.50). Eligible plants in most provinces received 30 per cent of their standardised fixed costs through these payments. From 2026, the rate rises to a minimum of 50 per cent nationwide, with faster increases in provinces with high renewable penetration. In the mechanism’s first year, capacity payments delivered an estimated CNY100 billion (approximately USD15 billion) to participating plants, boosting their revenue by 5 to 8 per cent. China is paying coal plants for availability. Chinese planners understand that dispatchability carries economic value that variable energy does not provide, and they price it explicitly.
Second, contractual lock-in. Long-term coal purchase agreements guarantee minimum operating hours. Electricity buyers locked into these contracts face financial penalties for purchasing less than contracted volumes, discouraging procurement of cheaper renewable power. New capacity coming online with pre-signed agreements further limits grid space for clean energy.
Third, vertical integration from the coal mining sector. More than 75 per cent of newly approved projects in 2024 were financed by coal mining companies or energy groups with mining operations. Coal-producing provinces are simultaneously commissioning the most new capacity. Mining companies are securing growth before policy space narrows under China’s 2030 and 2060 targets.
The consequence is visible in curtailment data. In Q4 2024, despite slowing demand growth, fossil generation remained high while solar and wind utilisation dropped sharply. Solar curtailment rates in Gansu exceeded 30 per cent (CREA and Global Energy Monitor, February 2025). A solar farm producing power at USD33 per megawatt-hour watches a third of its output discarded because a coal plant 200 kilometres away holds a contract guaranteeing dispatch priority. The variable capacity exists. The coal contracts hold priority.
Chinese planners maintain separate financing tracks for these distinct functions. Energy Volume Finance builds the renewable fleet. Firm Power Finance, through capacity payments, contractual guarantees, and mining-sector investment, maintains and expands coal-fired capacity. Both tracks are funded by the state. Neither substitutes for the other. For African economies watching China’s energy build-out as a model, this is the lesson that carries: China does not fund one lane and restrict the other. It funds both simultaneously because its planners treat them as different jobs.
4. The Import Architecture
Oil is 18 per cent of China’s primary energy. A reader looking at Table 1 may conclude this is a manageable share.
The conclusion fails because it treats energy as fungible. Oil serves functions that no other energy source currently replaces at commercially viable scale: road freight, aviation, shipping, military logistics, and petrochemical feedstock for plastics and synthetic materials. The IEA confirmed in 2025 that China’s transport fuel consumption peaked at 8.1 million barrels per day, 2.5 per cent below 2021 levels. Electric vehicles displaced 3.5 per cent of new fuel demand in 2024. But EVs serve passenger cars. Long-haul trucking, container shipping, and aviation remain over 90 per cent oil-dependent.
Petrochemical feedstock demand grew 5 per cent in 2024 even as transport fuel fell. Total oil demand of 16.3 million barrels per day is the second highest in the world. China produces 4.3 million barrels per day domestically. Crude oil imports totalled 11.1 million barrels per day in 2024, with additional refined product imports bringing total oil import dependency to approximately 73 per cent. Roughly 40 per cent of crude imports, approximately 4.45 million barrels per day in early 2026 (Kpler via CNBC), transited the Strait of Hormuz before the crisis. Those imports serve functions that neither coal nor renewable generation can reach. The vulnerability is not in the 18 per cent share. It is in what that 18 per cent does.
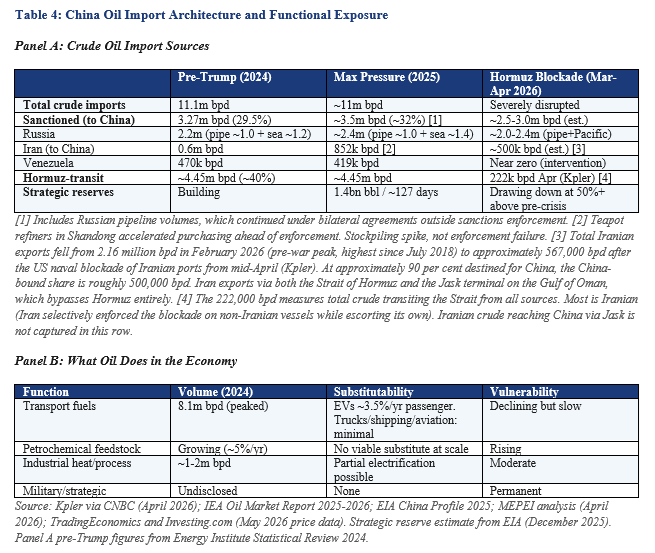
Panel A shows the geopolitical architecture. Before Trump’s second term, China sourced 29.5 per cent of its crude from sanctioned suppliers at significant discounts. Independent teapot refiners in Shandong province processed the barrels. A shadow fleet of tankers masked cargo origins. From March 2025, maximum pressure sanctions designated multiple teapot refineries. In April 2026, OFAC expanded the campaign to include Hengli Petrochemical (Dalian), described by the US Treasury as “one of Tehran’s most valued customers,” along with port terminal operators in Shandong. China responded in May 2026 with its first formal blocking order under its anti-sanctions statute. Despite the designations, sanctioned crude volumes to China actually increased: Iran’s teapot purchases rose from 600,000 to 852,000 barrels per day as refiners stockpiled ahead of enforcement. China simultaneously built an estimated 1.4 billion barrels of strategic reserves (EIA, December 2025), enough for approximately 127 days of crude import cover.
Then the physical disruptions did what sanctions had not. The January 2026 Venezuela intervention cut the remaining flow of approximately 420,000 barrels per day to near zero. The February-March US-Israeli strikes on Iran and Iran’s retaliatory blockade of the Strait of Hormuz disrupted the largest oil supply chokepoint in the world. The IEA characterised the disruption as the largest in the history of the global oil market. Approximately 20 million barrels per day of crude and products transit the Strait, roughly 20 per cent of global supply. The blockade disrupted approximately 10 million of that (IEA). Iran blocked non-Iranian vessels while continuing to export its own crude through the Strait. Chinese port discharges of Iranian crude averaged approximately 1.25 million barrels per day in March (Kpler). The US naval blockade of Iranian ports from mid-April cut total Iranian exports to approximately 567,000 barrels per day (Kpler), with roughly 500,000 destined for China. Total Hormuz-transit crude to China collapsed from 4.45 million barrels per day to 222,000 in April (Kpler). Russia, whose crude reaches China via pipeline and Pacific seaborne routes that bypass Hormuz entirely, was the one major supplier unaffected.
Brent crude surged 55 per cent in March, reaching USD116, and peaked at USD126 in late April. As this essay publishes, three supertankers have crossed the Strait this week and US-Iran negotiations are advancing, but Brent remains above USD105, roughly 50 per cent above pre-war levels. ADNOC’s chief executive has stated that full recovery in Middle Eastern oil flows is unlikely before late 2027.
Panel B shows why this matters despite oil being “only” 18 per cent of primary energy. Renewable generation could not help because the shock was not in the electricity system. Solar panels do not replace diesel trucks. Wind turbines do not produce naphtha for petrochemical crackers. Gas-fired generation is only 3 per cent of China’s electricity, so the blockade’s impact on the power grid was marginal. The electricity system held because it was already built on domestic fuel. The oil-dependent economy held because China drew down its strategic reserves at prices 50 per cent above pre-crisis levels. African economies import refined petroleum through contested supply chains and hold no comparable strategic reserves. A global oil price shock transmits through fuel import bills regardless of how much solar capacity a country has installed.
This is what the taxonomy captures. Energy Volume Finance serves electricity generation. It cannot serve the functions oil performs. Firm Power Finance provides the dispatchable electricity backstop. Both are necessary. Neither substitutes for oil’s role in transport and petrochemicals. Chinese planners fund all three tracks because they treat each as a different job.
Oil is not the only imported fuel at risk. China imports 61 per cent of its natural gas (pipeline and LNG combined), with seaborne LNG from Qatar, Australia, and the United States transiting the same chokepoints. The Hormuz blockade disrupted Qatari LNG alongside oil. Gas serves industrial heating and residential use across northern China beyond its small electricity role. The Power of Siberia pipeline from Russia provides partial insulation, but pipeline capacity covers only a fraction of total gas imports. The import vulnerability extends across both oil and gas.
5. The Displacement Question
China is routinely cited as evidence that the global energy transition is working. The data assembled in this essay shows something different. China deployed renewable energy at unprecedented scale using fiscal, manufacturing, and institutional advantages unavailable to other economies. The result is 86 per cent fossil primary energy under direct accounting. That is the finding the transition narrative has not absorbed.
The strongest counter-case deserves its full weight before the ceiling argument is restated. Emissions have been flat or falling for 21 consecutive months. Coal generation fell between 1 and 2 per cent in 2025, the first absolute decline since 2015. Clean power growth exceeded electricity demand growth for the first time. Power sector emissions fell 1.5 per cent. EV penetration exceeded 40 per cent of new vehicle sales and 50 per cent in monthly data from October 2024 onward. These are genuine achievements and the essay does not dispute them.
They have not closed the gap. After the investment and industrial policy documented in the preceding sections, what has been displaced? Total emissions are flat or marginally below the recent peak. A small rise could push them to a new record. The coal under construction will come online over the next two to three years.
The NEV story illustrates the pattern. NEVs reached 40.9 per cent of all vehicle sales in 2024, with monthly penetration exceeding 50 per cent for the first time in October. But fleet turnover takes 15 to 20 years. The cumulative NEV share of all vehicles on the road was approximately 9 per cent at year-end 2024. Even the most successful displacement story in the clean energy portfolio is producing single-digit percentage impacts on the commodity it targets.
The distinction between plateau and decline matters. China has entered a plateau phase: coal capacity is stable to growing, utilisation rates are falling, and renewables meet demand growth. A decline phase, in which coal capacity retires and absolute generation falls year on year, requires retirement policies that do not yet exist. The capacity payments introduced in 2024 move in the opposite direction, paying plants to remain available rather than incentivising closure. If coal retirement policies emerge at scale post-2030, the plateau lifts. No such policies are currently in force.
The correct characterisation of what China’s data shows is expansion with marginal substitution. The energy system expanded. Renewables absorbed most of the expansion. They did not substitute for the existing fossil base at any material scale. That is the ceiling.
A necessary caveat: the ceiling argument applies to the energy requirements of heavy industry. A copper electrowinning circuit draws the same kilowatt-hours per tonne whether it sits in Guangdong or the Copperbelt. A cement kiln runs at the same temperature in Lagos and Wuhu. The physics of absorption industries does not adjust for geography.
For economies pursuing services-led growth with lower energy intensity, the ceiling argument carries less weight. This series addresses the industrialisation pathway, not the services pathway. Africa’s stated ambition is to process its own minerals, manufacture its own fertiliser, and run its own data centres. Those industries face the same energy intensity profile that makes China’s firm power indispensable to its own industrial base.
6. The Subsidy Logic
The OECD’s January 2026 report, “Too Close to the Sun,” provides the firm-level evidence for how the renewable surge was financed. Across 15 industrial sectors tracked by the OECD MAGIC database, solar cell and module production was the most subsidised over 2005 to 2024. Subsidies averaged 3.2 per cent of firm revenue, more than three times the industrial average of 0.9 per cent. Chinese firms were the largest recipients by a significant margin.
The subsidies produced market dominance. Chinese producers hold more than 80 per cent of the global solar value chain. OECD-based producers saw their combined share fall from 80 per cent in 2005 to below 10 per cent by 2023. Dominance came at the cost of commercial viability. In 2024, the sector experienced falling revenue, sizable losses, and significant job cuts despite elevated government grants. Prices fell below break-even.
In the framework Michael Pettis has documented across Chinese industrial policy, these subsidies are financed through household income transfers: below-market deposit rates, above-market borrowing costs, and an exchange rate that taxes consumption and subsidises production. Chinese economists contest this framing, noting that household consumption as a share of GDP has risen from approximately 35 per cent in 2010 to 39 per cent in 2024. The direction of the transfer is debated. Its scale is not.
The coexistence of a clean energy surge and fossil persistence remains viable provided the state maintains this income transfer. When household demand weakens, as it did in 2024, the state channels more investment into industrial capacity. Clean energy manufacturing takes up this investment. So does coal construction. Both are productive assets in the state investment framework.
The ceiling argument follows directly. China sustains its clean energy investment at the current scale through a macroeconomic regime that no other country can replicate: the fiscal depth, the manufacturing base, the state-owned enterprise network, and the income transfer mechanism. The subsidy-to-outcome ratio speaks for itself. After all of this, the energy system outcome documented in this essay is a marginal emissions decline that may not hold. African economies lack every element of this architecture. Expecting comparable transition outcomes from standard climate finance is an arithmetic that does not hold.
When the global narrative cites Chinese clean energy investment as evidence that transition is affordable, it elides the conditions that make the investment possible. The capital did not come from market pricing alone. Separating the renewable achievement from the financing architecture that produced it is analytically incomplete.
7. The Ceiling
The ceiling this essay documents is quantifiable. Two decades of sustained deployment. State-directed manufacturing dominance across every clean technology. 164 gigawatts of storage. An estimated 1.4 billion barrels in strategic petroleum reserves.
The outcome: 86 per cent fossil primary energy under direct accounting and 58 per cent fossil electricity, with an emissions decline that may not hold. Coal construction at a 10-year high. A Hormuz blockade that, even as it begins to ease, laid bare the distinction the transition narrative refuses to make. The part of the economy built on domestic fuel held. The part dependent on imports survived only because the reserves existed.
The proposition that Africa can achieve energy transition through variable deployment funded by climate finance deserves testing against these numbers. Without firm power, without grid investment, without manufacturing capacity, and without the fiscal architecture that makes China’s dual-track system possible, the evidence does not support the proposition.
Part 3 examines what Africa’s firm power options are, across both lanes, in economies that do not command the resources China deploys. Part 3 names five fallacies that dominate current energy transition discourse and tests each against the evidence this essay has assembled.
Sources
Bloomberg New Energy Finance, Energy Transition Investment Trends 2025 (New York, January 2025) and Energy Transition Investment Trends 2026 (New York, January 2026).
Carbon Brief, “Analysis: China’s CO2 emissions have now been ‘flat or falling’ for 21 months” (London, February 2026).
Carbon Brief and Centre for Research on Energy and Clean Air, “Analysis: Clean energy contributed a record 10% of China’s GDP in 2024” (London, February 2025).
Centre for Research on Energy and Clean Air and Global Energy Monitor, When Coal Won’t Step Aside: The Challenge of Scaling Clean Energy in China (Helsinki and San Francisco, February 2025).
DNV, Greater China Energy Transition Outlook 2025 (Oslo, October 2025).
Ember, Global Electricity Review 2025 (London, April 2025) and Global Electricity Review 2026 (London, April 2026).
Ember, China Energy Transition Review 2025 (London, September 2025).
Energy Institute, Statistical Review of World Energy 2024 (London, June 2024).
International Energy Agency, World Energy Investment 2025 (Paris, June 2025).
International Energy Agency, Oil Market Report (Paris, various months 2025-2026).
International Energy Agency, Strait of Hormuz briefing (Paris, 2026).
IRENA, Renewable Power Generation Costs in 2024 (Abu Dhabi, September 2025).
IRENA, 24/7 Renewables: The Economics of Firm Solar and Wind (Abu Dhabi, May 2026).
Kpler shipping data via CNBC, “How China and U.S. eased the Middle East oil shock” (15 May 2026).
Lazard, Levelised Cost of Energy+ v18 (New York, 2025).
MEPEI, “Analysis of the Impact of the Strait of Hormuz Blockade on China’s Energy Market” (April 2026).
OECD, “Subsidies and the Solar Panel Industry: Too Close to the Sun,” OECD Policy Briefs No. 47 (Paris, January 2026).
Pettis, Michael, Trade Wars Are Class Wars (New Haven: Yale University Press, 2020).
U.S. Energy Information Administration, International Energy Statistics and China Country Analysis Brief (Washington, DC, various years).
Disclaimer
This article does not constitute legal, financial, or investment advice. The author shares views for perspective and discussion only. Do not rely on them as a substitute for professional advice tailored to your specific circumstances. Always consult a qualified legal, financial, investment, or other professional adviser before making decisions based on this content. The analysis reflects proprietary research undertaken by Canary Compass and the author.
Canary Compass and the author accept no liability for actions taken or not taken based on the information in this article.
The views expressed in this article represent the author’s independent professional analysis and do not constitute an endorsement of any individual, institution, or position. Canary Compass and the author accept no responsibility for how this content is interpreted, excerpted, or recontextualised by third parties not involved in its production and publication. Reproducing any portion of this work in isolation, or in combination with other material, in a manner that misrepresents the author’s original meaning constitutes a distortion of the published record.
The author may hold positions in financial instruments, currencies, or assets discussed or referenced in this publication. Such positions do not constitute a recommendation to buy or sell.
All views, projections, and forecasts reflect the author’s assessment at the time of writing. Data sourced from third parties is believed to be reliable but has not been independently verified. Past performance does not indicate future results.
All content published by Canary Compass is the intellectual property of the author. Reproduction, adaptation, or redistribution, in whole or in part, requires written permission.
About the Author
Dean N. Onyambu is the Founder and Chief Editor of Canary Compass, a financial research publication focused on African monetary architecture and financial sovereignty. He brings 18 years of experience across trading, fund leadership, and economic policy, with senior roles at Standard Bank, First Capital Bank, and Opportunik Global Fund.
Read and subscribe at www.canarycompass.com.
The Canary Compass Channel is available on @CanaryCompassWhatsApp for economic and financial market updates on the go.
For more insights from Dean, you can follow him on LinkedIn @DeanNOnyambu or X @InfinitelyDean.