
AFRICA MACRO NOTE: The Acid Test
Oil, Acid, Fertiliser, Copper, and the Three Supply Failures That Converged in April

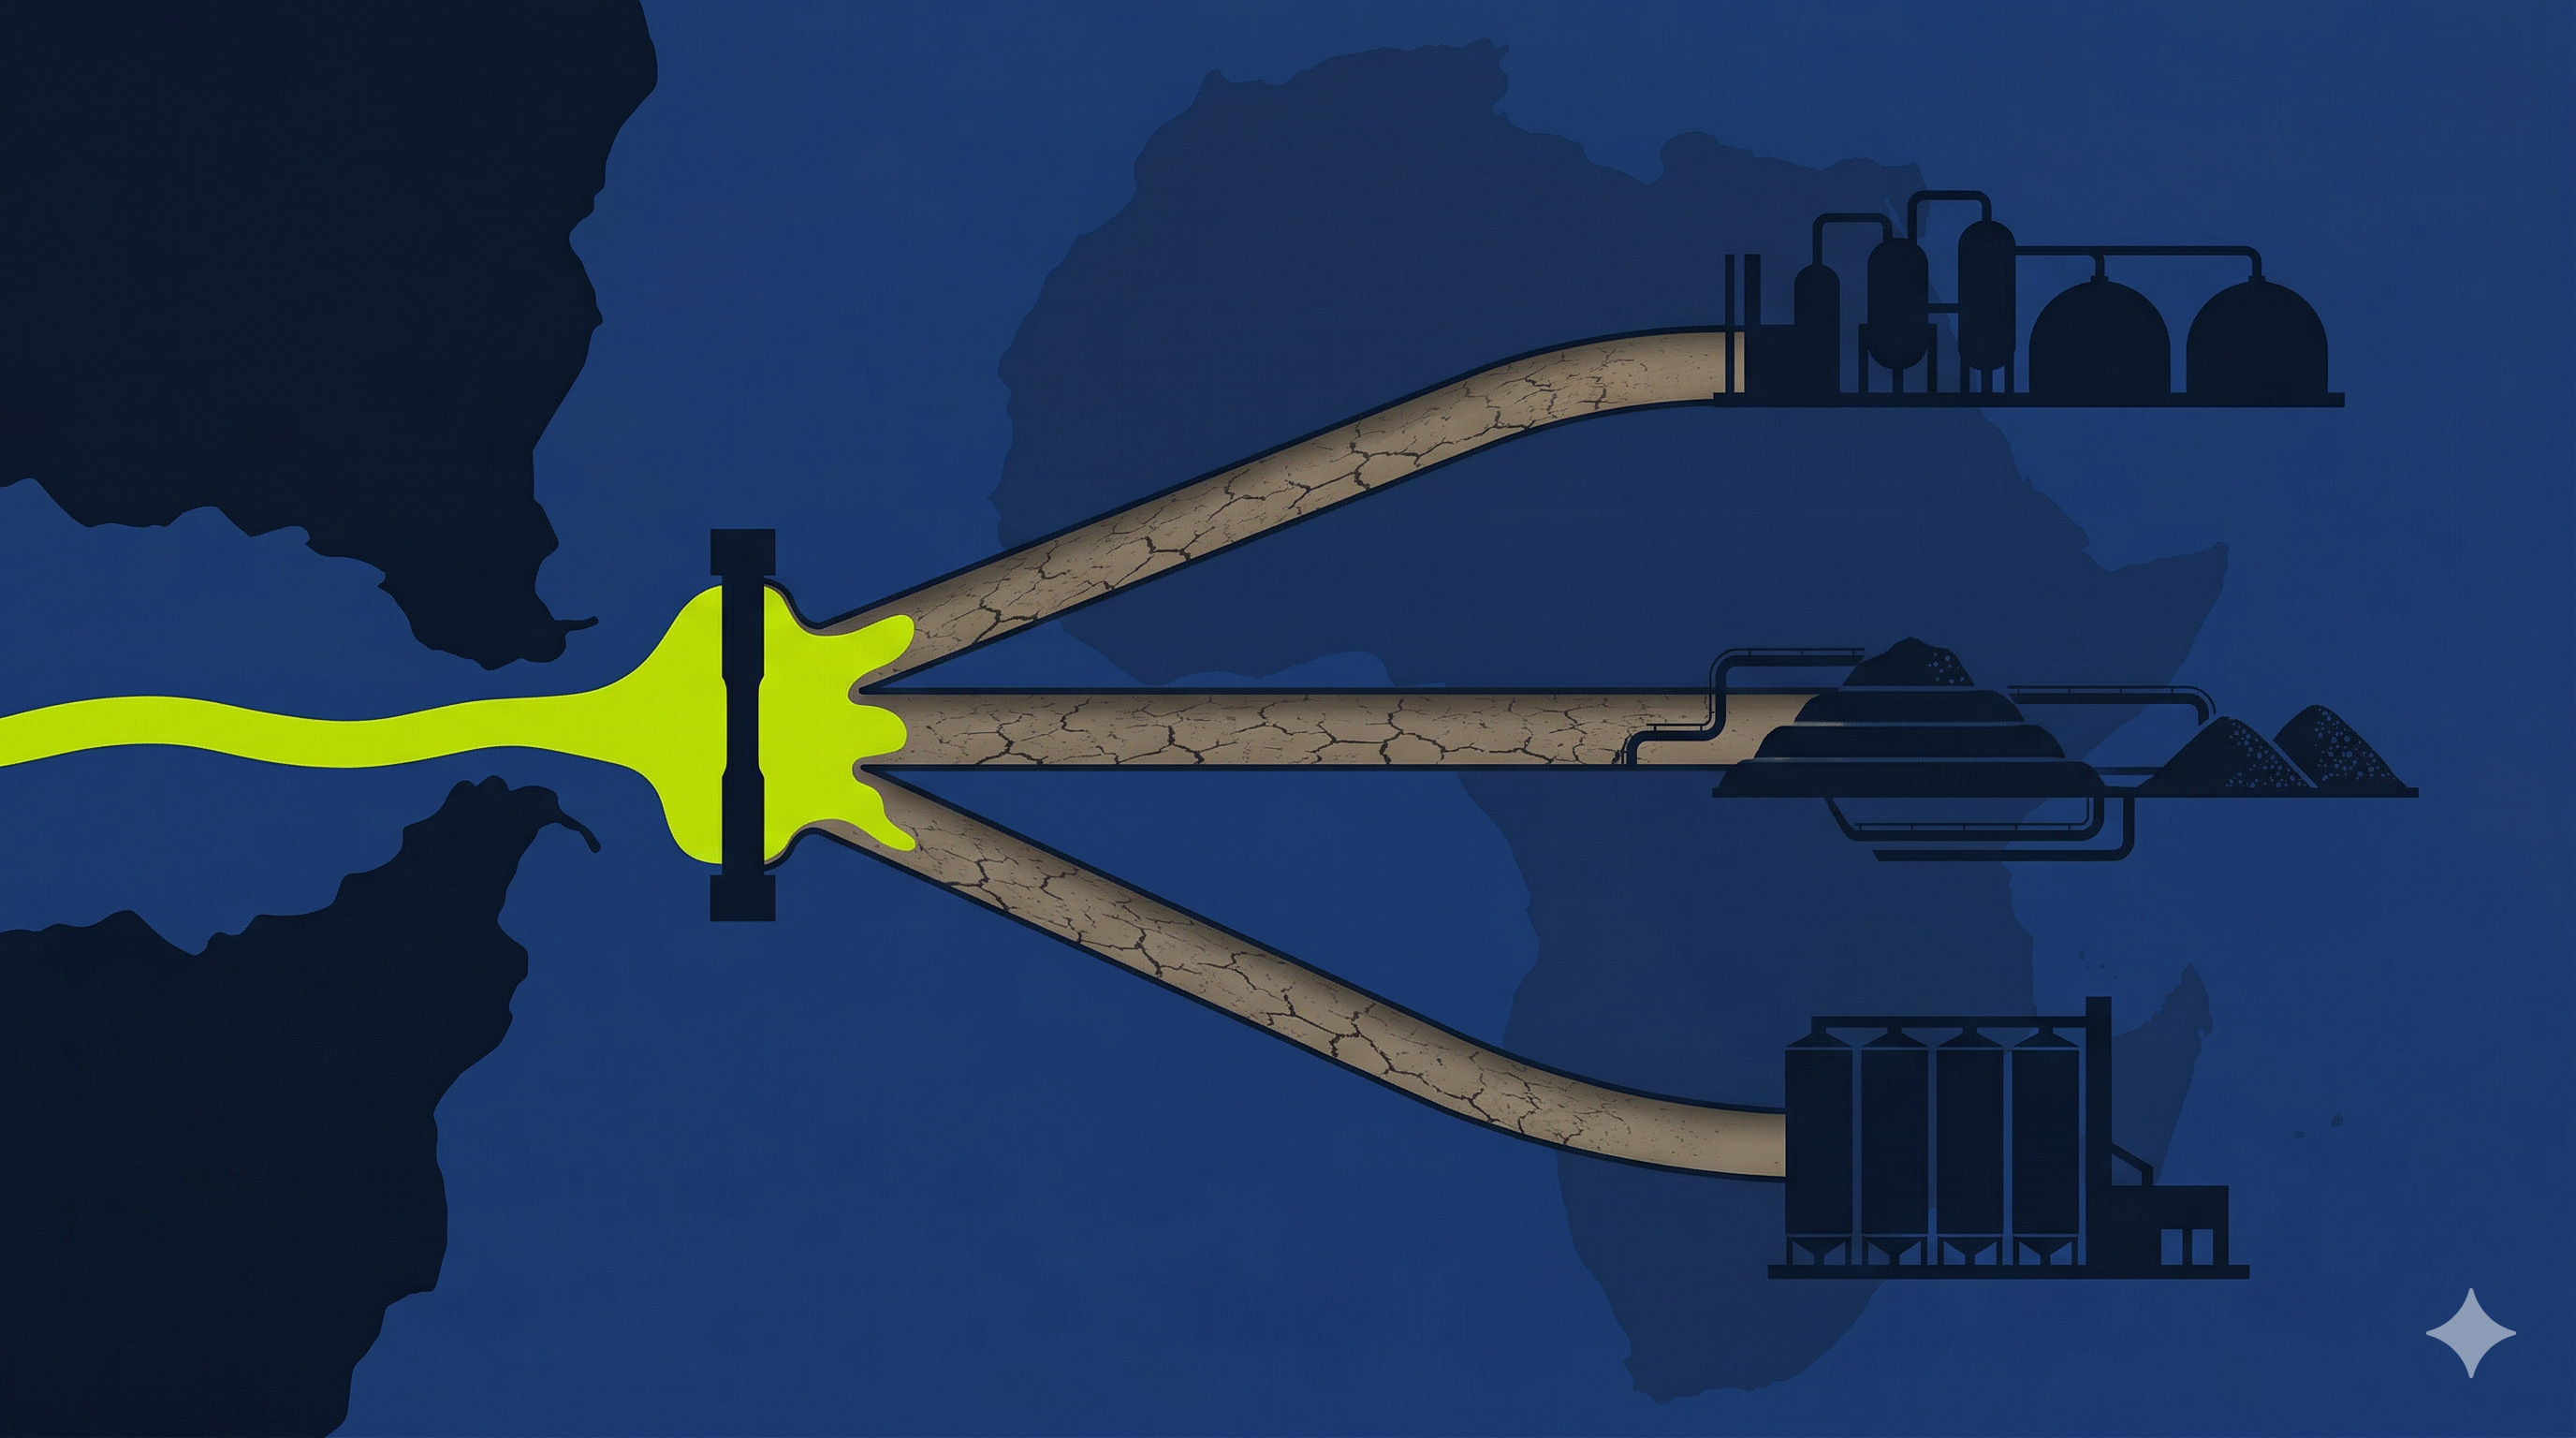
Sulphuric acid: the compound beneath the food system and the industrial metals complex.
Price and supply data as of 12 April 2026. Strait of Hormuz developments current to 12 April. This note traces the sulphuric acid deficit through five distinct African exposures: refining architecture in Nigeria, sovereign subsidy exposure in Kenya, agricultural forward-risk in Zambia, hydrometallurgical mining in the DRC, and phosphate production in Morocco.
Three developments since 19 March have broken the arithmetic of the Hormuz closure. The architecture was already visible in my Quick Take of that date, which mapped the downstream cascade from crude oil through sulphur, fertiliser, and fuel to specific African country exposures. What has changed is that three sources of supply for a single industrial chemical have been impaired simultaneously. The implications run from phosphate processing in Morocco to copper leaching pads in the DRC to planting schedules across East and Southern Africa.
The chemical is sulphuric acid. The three doors are now closed.
Day 44
A ceasefire between the United States and Iran was announced on 8 April. It did not hold in substance. The Strait of Hormuz has not reopened to normal commercial shipping. On 12 April, after 21 hours of negotiations in Islamabad failed to produce an agreement, President Trump announced that the US Navy will blockade the Strait, preventing access to Iranian ports while permitting transit to non-Iranian destinations (CENTCOM, 12 April). Separately, Trump directed the Navy to seek and interdict any vessel in international waters that has paid Iran’s toll. The US has ordered mine clearance to begin. Two destroyers (USS Frank E. Peterson and USS Michael Murphy) transited the Strait on 11 April as part of a broader CENTCOM operation to establish a safe passage corridor.
The closure has escalated, not resolved. For 43 days, Iran controlled access. Now both the US and Iran claim authority over the same waterway. Crude oil has been partially rerouted through Saudi Arabia’s East-West pipeline (restored to 7m bpd capacity, Al Jazeera, 12 April) and the UAE’s ADCOP corridor to Fujairah. No equivalent bypass exists for elemental sulphur, LNG, ammonia, urea, or finished fertiliser. These commodities transit the Strait by ship or they do not transit at all.
Even under a best-case scenario in which commercial shipping resumes within weeks, the physical pipeline has been drained. The last cargoes loaded before the war are arriving at their destinations now. After those clear, four to six weeks will pass before the first post-reopening cargoes reach end users. For sulphur, the lag is longer: it must be shipped, converted to acid, transported to processing plants, and applied. Reopening the Strait is the beginning of a recovery, not its conclusion. Hapag-Lloyd estimates normalisation at six to eight weeks minimum. Other shipping analysts place it at months.
In my 19 March assessment, I described the IRGC toll mechanism as a uniform feature of Iran’s selective Hormuz doctrine. That framing was too simple, and the situation has since moved past it. Ed Finley-Richardson challenged the toll claim on structural grounds. The IRGC is OFAC-designated. Compliant owners cannot pay a sanctioned entity. The USD2m figure traced to two ships early in the conflict with no credible subsequent confirmation. The New York Times, citing US officials, reported on 10 April that Iran mined the Strait and left a single cleared corridor open to vessels willing to pay for passage in yuan or cryptocurrency. Trump’s 12 April blockade order now closes the other side of the trap: any vessel that paid Iran’s toll faces US interdiction.
Four categories of vessel are now operating:
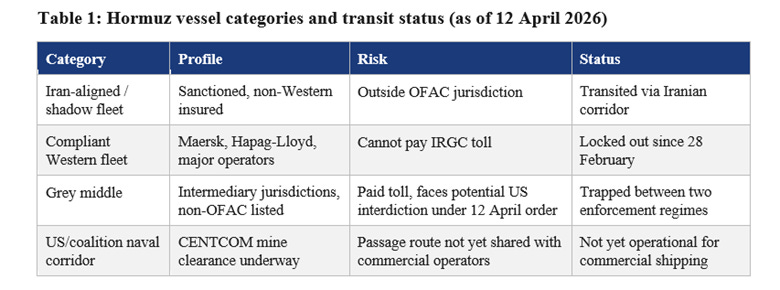
The grey middle, which produced a thin trickle of transits well below normal levels, is now squeezed from both directions. Iran charges for entry. The US interdicts for having paid. Commercial shipping that needs certainty from both sides has neither.
The Three Doors
Sulphuric acid sits inside fertilisers, copper leaching, nickel and cobalt processing, oil refining, lead-acid batteries, and a wide range of chemical chains. Craig Tindale describes it as one of the base layers of civilisation. Remove flow at the margin and the effects propagate through industrial systems we never see until they seize up. Acid prices had already surged roughly 500 per cent before the conflict began, according to Tindale’s market analysis, reflecting pre-existing tightness in the global sulphur market.
Three sources of supply have now failed simultaneously.
The first door is Hormuz. Industry estimates place Persian Gulf seaborne sulphur exports at approximately 44 per cent of the global total (S&P Global Trade Atlas). The Gulf states are among the largest exporters of elemental sulphur, a byproduct of oil refining and gas processing. When Gulf refineries shut and gas plants close, sulphur supply does not become expensive. It stops. The standard conversion ratio is one tonne of elemental sulphur to approximately three tonnes of sulphuric acid. The 15 to 20 million tonnes of sulphur that normally transit the Strait therefore represent 45 to 60 million tonnes of acid equivalent. Tindale places the range at 40 to 70 million tonnes when including recovered acid and direct acid shipments. That supply has been effectively unavailable since 28 February.
The second door is China. Bloomberg reported on 10 April that Chinese authorities will halt sulphuric acid exports from May. The ban covers smelter acid from copper and zinc processing and sulphur-based acid. Only electronic-grade acid is exempted. Ivanhoe Mines founder Robert Friedland notes China exported 4.6m tonnes of sulphuric acid in 2025 according to preliminary Chinese customs data. Major destinations included Chile (32 per cent), Indonesia (15 per cent), Morocco (12 per cent), Saudi Arabia (12 per cent), and India (9 per cent). Chinese exports were already falling sharply in early 2026, with January-February volumes at roughly half the prior-year level. The door was narrowing before Beijing shut it.
The third door is Russia. Ukrainian strikes on Russian refining and export infrastructure have reduced Russian sulphur output by an estimated one million tonnes, according to Tindale’s assessment. Russia is among the world’s largest sulphur producers. The strikes were designed to impose costs on Moscow, not to tighten the global sulphur balance. The global sulphur balance does not distinguish between intended and unintended causes of disruption.
Three sources. All three impaired in the same window. This convergence did not exist on 19 March.
The Math
Tindale walks the stoichiometry (the calculation of reactants and products in a chemical process) in public. The numbers are large enough to matter at the level of food security for entire regions.
In the wet-process route for phosphate fertiliser production, sulphuric acid is the acidulating agent used to convert phosphate rock into phosphoric acid. On straight stoichiometry, 3m tonnes of H₂SO₄ yield approximately 1.8m tonnes of phosphoric acid, equivalent to roughly 1.30m tonnes of P₂O₅. That supports approximately 2.8m tonnes of DAP-equivalent fertiliser at 46 per cent P₂O₅. At a common field application rate of 60 kilograms of P₂O₅ per hectare, that covers roughly 22 million hectares. At global average cereal yields and caloric conversion, that is approximately the area required to feed 330 million people for a year. The conversion from hectares to people fed is illustrative, but the order of magnitude holds across reasonable yield and calorie assumptions.
I verified the chemistry independently. The industrial reaction uses fluorapatite, not pure tricalcium phosphate, and the stoichiometry holds. Tindale’s rounding is minor and consistently in the same direction.
Now scale it to Hormuz. If the Strait locks in 40 to 70 million tonnes of acid equivalent per year, the phosphate fertiliser production at risk is measured in billions of people’s food supply.
The gas and nitrogen fertiliser channel, which I mapped in detail on 19 March, has not improved. Urea spot prices remain at approximately USD700/t. Chinese export quotas on nitrogen-potassium blends are unlikely to be lifted before August. With the Gulf physically blocked and China halting acid exports, the market has simultaneously lost its two largest sources of replacement supply. The sulphur chain breaks phosphate production. The gas chain breaks nitrogen production. Trade policy restricts substitution between them.
Morocco: The Phosphate Exposure
This is where China’s second door lands hardest on Africa. Morocco is the world’s largest phosphate producer, and OCP Group’s processing operations at Jorf Lasfar and Safi are among the largest consumers of sulphuric acid on the continent. China shipped 12 per cent of its 4.6m tonnes of acid exports to Morocco in 2025. That supply is now halted from May. Morocco also sources sulphur from the Gulf, which is blocked. OCP has captive acid capacity from its own sulphur-burning plants, but the margin of insulation depends on how much imported feedstock those plants require. A sustained disruption to both Gulf sulphur and Chinese acid tightens the input chain for the world’s most important phosphate exporter, compounding the global fertiliser deficit at its source. Morocco is also a PAPSS member.
The Net Exporter Fallacy
There is a persistent assumption that net oil exporters are shielded from global price shocks. Oil is a globally priced commodity. No country sells oil to itself at a domestic discount.
The United States produces and refines. Its exposure is price, partially buffered by SPR releases and domestic refining capacity. Nigeria produces but cannot adequately refine. Its exposure is price and structure simultaneously. The mechanics of Nigeria’s refining gap, including the Dangote throughput shortfall and the reimport paradox, are documented in my 19 March assessment.
The question that has sharpened is settlement. Why has Dangote not moved to settle intra-African fuel trade through PAPSS?
The Pan-African Payment and Settlement System is now live in 19 countries with over 160 commercial banks and 15 national switches connected, according to Afreximbank’s February 2026 disclosures and TechCabal reporting. It has launched three products: the Instant Payment System, the PAPSS African Currency Marketplace (PACM, launched July 2025 to address the USD5bn currency bottleneck in intra-African trade), and the PAPSSCARD. It settles cross-border transactions in local currencies within 120 seconds. Nigeria, Kenya, Zambia, Morocco, Algeria, Egypt, and Tunisia are all connected.
Fuel is among the largest intra-African trade flows denominated in foreign currency. Dangote has refining capacity and PAPSS has settlement infrastructure, neither of which was operational at current scale during the last supply shock. Both are operational. Neither is connected to the other.
Connecting Dangote to PAPSS for fuel settlement requires more than a technical switch. It requires overcoming bilateral FX liquidity constraints, Afreximbank net settlement limits, and Central Bank of Nigeria regulatory approvals for large-scale commodity transactions. These are real obstacles. But PAPSS has been live since 2022 and the failure to pilot even a single cargo suggests a lack of political will to test the architecture, not a technical impossibility.
Tchakarova’s systemic analysis documents China’s yuan energy corridor accelerating during the crisis. Twenty-three institutional participants are now processing yuan-denominated energy transactions, up from twelve on 22 March. Beijing has been building this architecture since at least 2018, when it launched yuan-denominated oil futures on the Shanghai International Energy Exchange. The Hormuz closure is accelerating a programme that predates it by years. Africa has the equivalent infrastructure and is not using it.
The cost of inaction is quantifiable. A single 30,000-tonne Dangote petrol cargo settled via PAPSS PACM would remove approximately USD35-40m in FX demand from the correspondent banking system and settle in under 120 seconds. Afreximbank confirmed in February 2026 briefings that the remaining gate is a one-time CBN commodity-settlement approval and bilateral FX netting agreements with the importer’s central bank. China required 23 institutional participants to move energy trades into yuan in the first six weeks of the crisis. Africa already possesses the rails. The delay is a revealed preference for USD intermediation even under blockade conditions.
The minimum step is a pilot settlement of a single Dangote fuel cargo through PAPSS between Nigeria and a neighbouring importer. The commercial parties exist. The rails exist. What is required is a decision.
African Agricultural Exposure: The Next Season, Not This One
The main maize crop across most of East and Southern Africa was planted between October and December 2025. That crop is in the ground. Kenya’s long rains season is underway, and fertiliser for the current planting was largely procured before the conflict began. Zambia’s primary maize harvest is being collected now.
The disruption window does not hit the current crop. It hits the next one.
Zambia. The winter wheat crop planted from May to August falls directly inside the disruption window. More consequentially, procurement for the 2026/27 FISP season will be tendered at prices shaped by the current supply environment.
Zambia’s maize story is more complex than the fertiliser transmission alone. The country sits at an unusual junction: maximum current abundance meeting maximum forward risk.
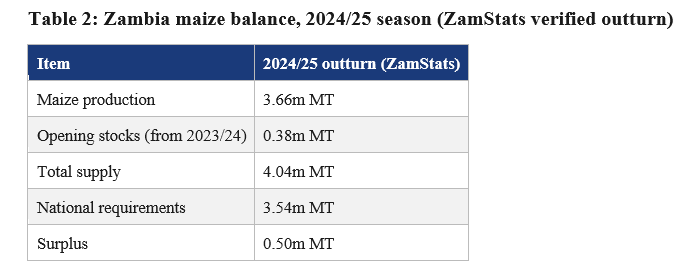
The ZamStats Crop Forecasting Survey for the 2024/25 season (completed) provides the verified baseline:
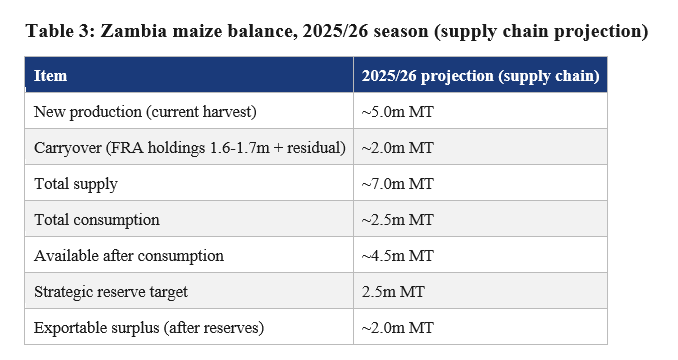
The 2025/26 season (being harvested now) has no government crop forecast yet. Supply chain practitioners with direct visibility into production volumes provide a forward projection:
The consumption figures reflect a genuine disagreement between government data and practitioners in the value chain. ZamStats reports national requirements of 3.54m tonnes including human consumption, industrial use, seed retention, and reserve replenishment. Practitioners with direct visibility into the supply chain place total consumption, including industrial and feed, at 2.5m tonnes. Both claim to be measuring the same thing. The gap of over one million tonnes is itself a signal: if the baseline consumption figure is contested by that margin, the reliability of any surplus calculation derived from it is limited.
The FRA carryover traces to a specific event. In September 2025, President Hichilema directed FRA to “buy all the maize.” FRA purchased between 1.6 and 1.7m tonnes from the 2024/25 harvest (Presidential Delivery Unit, March 2026; Zambian Observer, November 2025), well above both its financing envelope and its storage capacity.
The storage constraint compounds the problem. Zambia’s secure national storage capacity is approximately 1.5m MT. FRA is holding 1.6 to 1.7m MT, with hundreds of thousands of tonnes under tarpaulins (Zambian Observer, November 2025). The system was already straining before the new harvest arrives.
The government has allowed maize exports, itself a signal of the surplus magnitude. Zambia has historically restricted or banned exports to protect domestic food security. But the regional picture makes exporting difficult. All three major Southern African producers are sitting on surpluses simultaneously.
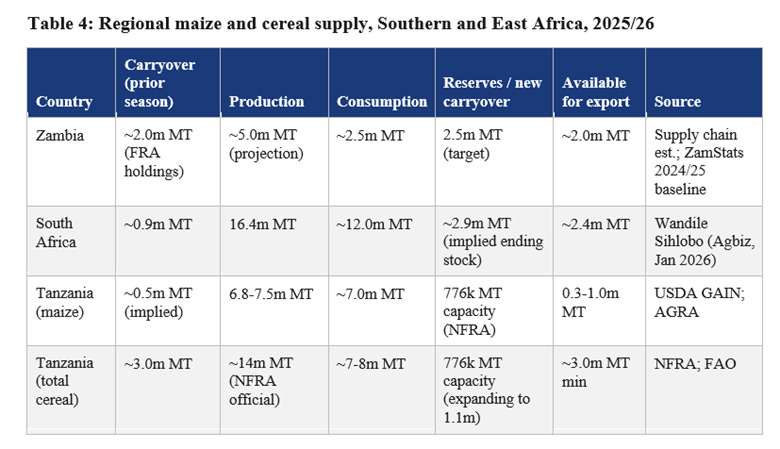
The reserve-building imperative extends beyond Zambia. All three major Southern African producers are sitting on surpluses at precisely the moment when two distinct threats are converging on the 2026/27 planting season. The first is the Hormuz fertiliser cascade traced throughout this essay: sulphuric acid, phosphate, and nitrogen supply chains all impaired simultaneously, with procurement for the next season’s inputs already being priced in this environment. The second is the El Nino probability. NOAA’s Climate Prediction Center gives a 62 per cent chance that El Nino conditions emerge by June-August 2026 and persist through at least the end of the year. The International Research Institute for Climate and Society places the probability higher, at 72 to 80 per cent through late 2026, with a one-in-three chance of a strong event exceeding +1.5°C (NOAA CPC, March 2026; IRI, March 2026). Several leading forecast models are projecting intensity levels consistent with a potential super El Nino by winter 2026/27. The 2023/24 El Nino produced severe drought across Zambia, Zimbabwe, and Malawi. A comparable or stronger event during the 2026/27 growing season would hit a region whose fertiliser inputs are already constrained by the Hormuz closure. Either threat alone would justify building reserves from the current surplus. Both arriving in the same window removes the question of whether to build them.
South Africa has already taken a significant share of the Katanga deficit market in the DRC and is the dominant regional exporter, with Zimbabwe absorbing 30 to 35 per cent of SA’s 2.4m tonne export forecast (Wandile Sihlobo, Agbiz). Tanzania is moving in the opposite direction from reserve-building. NFRA has contracted approximately 1.2m tonnes of grain for sale: 650,000 tonnes to Zambia (half delivered), 500,000 to the DRC, and 35,000 to the World Food Programme (Milling MEA, February 2025). NFRA plans to sell a further 1m tonnes in 2025/26 and launched a 534,000-tonne public tender in October 2025 at a floor price of TSh850,000/t for maize (The Citizen, October 2025). The storage constraint explains the urgency. NFRA’s total capacity is 776,000 tonnes, expanding to 1.1m under construction, against a government target of 3m by 2030 (TanzaniaInvest, President Hassan). Tanzania cannot simultaneously hold strategic reserves and store a surplus it cannot physically accommodate. It is exporting by necessity. If the El Nino and fertiliser shocks materialise in the 2026/27 season, Tanzania will have sold its buffer into a region that was also sitting on surpluses at the time. Zimbabwe will absorb an estimated 720,000 to 840,000 tonnes.
The pricing structure explains why the surplus is hard to move, and why the compression is already underway:
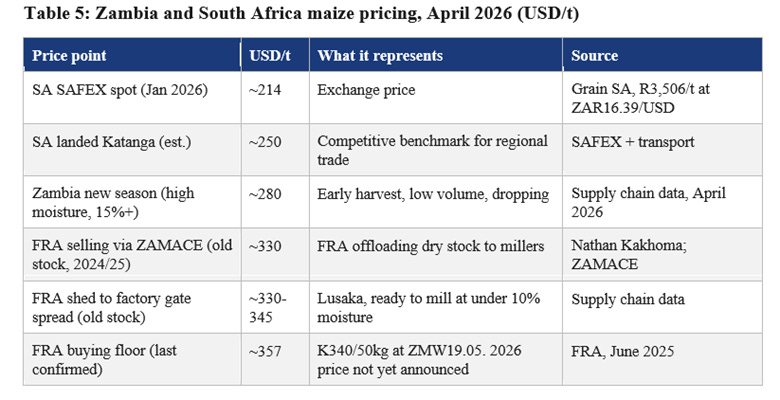
Two distinct markets are operating simultaneously. Old season stock from the 2024/25 harvest, already dry and stored in FRA sheds, is being sold through ZAMACE at approximately USD330/t and trading at factory gate in Lusaka at around USD345/t. This is FRA offloading inventory, not the floor price for the new harvest. New season maize from the 2025/26 harvest, still at high moisture content and in low volumes as collection begins, is already trading at approximately USD280/t and falling as harvest volumes increase and moisture drops. The gap between old season and new season will close as the harvest progresses.
South African white maize was trading at R3,506/t on SAFEX in January 2026, down roughly 50 per cent year on year (Grain SA). At current exchange rates, that converts to approximately USD214/t. Add transport to Katanga and the landed price reaches approximately USD250/t. Zambia’s new season maize at USD280 is already within striking distance of SA’s competitive price. As harvest volumes increase, prices compress further and that gap narrows.
The FRA buying floor tells a different story. The last confirmed price is K340 per 50kg bag, announced in June 2025 for the 2025 crop marketing season. The 2026 price has not been announced. FRA typically opens depots in late May or June. At the current kwacha rate of 19.05, K340 converts to approximately USD357/t, which is 28 per cent above where new season maize is already trading and 43 per cent above SA landed Katanga. Meanwhile, the Hormuz oil price spike has fed directly into domestic logistics: local freight costs have risen approximately 15 per cent, driven by elevated Brent crude benchmarks and end-of-March fuel price adjustments by the Energy Regulation Board (Nathan Kakhoma, FX and Commodities Risk Specialist). The surplus is harder to move physically at the same time it is harder to sell competitively.
The natural question is whether FRA will lower the floor to enable exports. History says it will not. No recorded reduction exists since at least 2017. The floor moves in one direction.
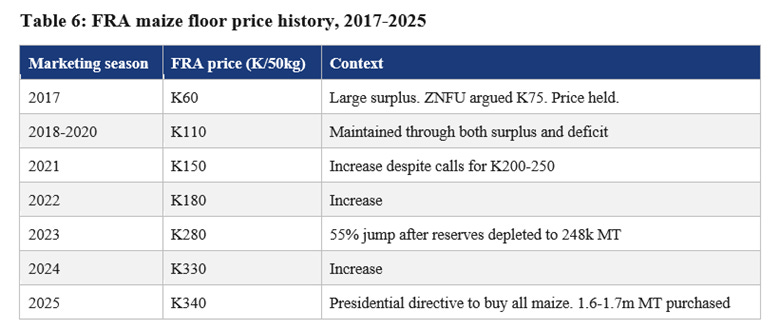
In surplus years, the government maintains the price and buys more volume. In deficit years, the price rises. Maize pricing in Zambia is a deeply political issue, and the August 2026 general election makes a reduction virtually impossible. No government drops the maize floor three months before an election.
The exchange rate has compounded the trap. The kwacha appreciated roughly 33 per cent against the dollar over the past twelve months, from approximately 28 to 19. The FRA floor barely moved in nominal kwacha terms (K330 to K340, a 3 per cent increase). But at the extremes of the kwacha's twelve-month range, the same nominal floor converts from approximately USD236/t to USD357/t. A year ago, at the weaker end of that range, Zambia's FRA floor sat below SA's export parity of approximately USD250. Today it sits 43 per cent above it. The kwacha appreciation, not FRA policy, is what priced Zambian maize out of regional competition.
For prices to compress toward the USD250 export parity, one of three things must happen: the kwacha depreciates back toward 25 to 28, FRA reduces the floor (no historical precedent, election year), or private market prices fall below the FRA floor as the surplus overwhelms domestic absorption capacity. The structural logic of the third path runs in two stages. If the surplus depresses prices in the near term, the compression creates a window to build reserves at lower cost. If fertiliser-driven yield reduction and the El Nino conditions described above then compress next season’s production, that window closes and prices rebound. The question is whether the reserve-building happens during the window or after it shuts.
The storage constraint is the binding problem:
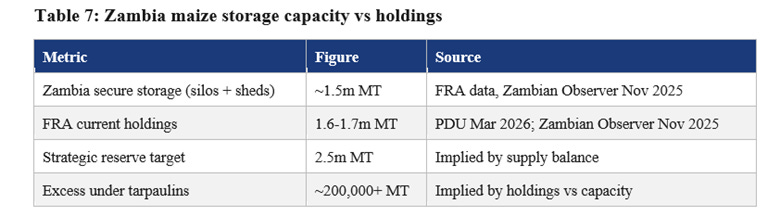
FRA is already operating beyond secure capacity. The strategic reserve target of 2.5m tonnes exceeds the secure infrastructure by a million tonnes. At current construction timelines, the gap between the reserve target and the physical capacity to hold it is unlikely to close before the next planting season.
The strategic response is to rotate the stock. FRA is already selling old holdings through ZAMACE at approximately USD330/t (~K6,300/t per ZAMACE), below the buying price of USD357/t (K340/50kg = K6,800/t, converted at ZMW19.05), absorbing the loss. In 2024, the subsidy on FRA sales to millers amounted to K80 per 50kg bag, roughly 24 per cent of the purchase price (Zambian Observer). The rotation needs to accelerate: sell the deteriorating stock, accept the fiscal cost, refresh with new harvest grain at lower prices as the compression works through, and build toward the 2.5m tonne reserve target using current season revenues. The alternative is grain rotting in open-air storage while the next season's input costs spike.
Reports from the Zambian agricultural supply chain indicate that farmers are already weighing a significant shift from maize to soya for the 2026/27 season. The driver is input costs: fertiliser requirements for soya are a fraction of those for maize, roughly one-tenth by some estimates. That is the acid shortage and the fertiliser price spike transmitting directly into planting decisions on the ground. If that shift materialises at scale, Zambia’s 2026/27 maize production contracts, and the surplus that looked unmanageable in April 2026 becomes a strategic reserve by April 2027.
Southern Africa’s record regional production is masking a forward risk: the fertiliser cascade and the El Nino probability are converging on the 2026/27 season. The question is whether Zambia reads the current season or the next two.
Kenya. The short rains season from October to December is the planting cycle exposed to procurement conducted under current supply conditions. Kenya imports virtually all of its fertiliser, approximately 760,000 to 836,000 tonnes per year (IEA Kenya). The government’s National Fertiliser Subsidy Programme budgeted KES20bn for 2024/25, targeting 12 million bags (600,000 tonnes) at a subsidised price of KES2,500 per 50kg bag against a market price above KES6,000. The subsidy is denominated in shillings and priced against dollar-denominated imports. When the input price rises in dollar terms and the shilling weakens simultaneously, the fiscal cost of maintaining the subsidy expands from both sides. The programme’s centralised distribution model, which routes through NCPB depots averaging 18km from farmers rather than the 6km to private agro-dealers under the previous system, adds logistical friction that compounds during supply disruptions.
Tchakarova’s cascade analysis, drawing on the Tindale framework, identifies 28 April as the date on which the northern hemisphere spring nitrogen application window closes, as noted in my 19 March assessment. That date is now two weeks away. No ceasefire reached after it can restore 2026 crop yields in the US Corn Belt or South Asian cereal production. The food price transmission lag is approximately 90 to 120 days, placing the initial global food inflation impact in late July to September.
For Africa, the calendar is different but the logic is the same. The procurement decisions being made in the next eight to twelve weeks for the 2026/27 planting season will embed current supply conditions into African food prices well into 2027 regardless of when the Strait reopens. The food price impact of this disruption is not a near-term event. It is a six to nine month transmission from supply shock to retail price, running through procurement, planting, harvest, and distribution. The prices that African households pay for food in Q4 2026 and into 2027 are being set by the input costs being locked in this month.
The Copper Signal
The sulphuric acid shortage runs a second downstream channel through African commodity exports.
The DRC is the world’s second-largest copper producer, with output forecast at approximately 3,400 kilotonnes in 2026 (Fastmarkets, analyst estimates). What distinguishes the DRC is the share that depends on acid-intensive processing. Solvent extraction and electrowinning (SX-EW), the hydrometallurgical process used to recover copper from oxide ores, produced roughly 1.5m tonnes of cathode in 2025, approximately 45 per cent of national output against a global average of 15 per cent. The DRC also produces roughly 70 per cent of the world’s mined cobalt, which uses the same leaching process. The battery supply chain sits downstream of the same chokepoint.
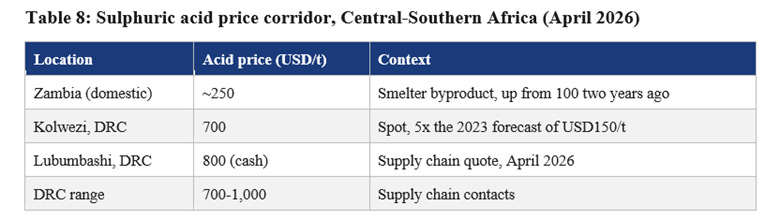
Friedland warned on 2 March that over 90 per cent of sulphur imported into Africa comes from the Gulf and that oxide operations could face closure within three weeks. We are six weeks past that warning. Kamoa-Kakula, his own operation, is partially insulated. Its copper smelter, Africa’s largest at 500,000 tonnes per annum of copper concentrate processing capacity, produces sulphuric acid as a byproduct at 1,200 tonnes per day (Ivanhoe Mines, January 2026 production disclosure), ramping toward 700,000 tonnes of acid per annum at steady state. That acid is sold locally to DRC Copperbelt operations. Zambia banned acid exports in September 2025.
A distinction matters here. Zambia's Copperbelt is structurally different from the DRC's. The Zambian deposits are predominantly sulphide at depth, and smelters like Kansanshi produce acid as a byproduct of processing sulphur-rich ore rather than importing elemental sulphur. Smelter output data suggests total Zambian acid production of approximately 1.5m tonnes per year. Domestic prices sit at roughly USD250/t, a fraction of what the DRC pays. The system is fragile, with KCM and Mopani operating below historical capacity, Mopani's smelter underfed even after improved production following UAE investment. But the dependency runs through different geology.
The DRC’s exposure is a direct import dependency on Gulf sulphur, and the deficit is severe. DRC acid demand runs at approximately 6m tonnes per year (CRU Group, BC Insight, 2024 data). Domestic production is limited outside Kamoa-Kakula, whose disclosed output of 1,200 tonnes per day equates to an annualised production rate of approximately 400,000 tonnes (Ivanhoe Mines, January 2026). By April 2026, Friedland reported throughput of approximately 1,600 tonnes per day as the smelter ramps toward its 700,000-tonne steady state target. The gap between 6m tonnes of demand and well under a million tonnes of domestic production is what Gulf sulphur was filling.
Bloomberg Intelligence estimates 50 to 60 per cent of DRC copper output depends on sulphuric acid. Goldman Sachs reports DRC producers hold approximately three months of acid inventory, meaning a short disruption is manageable but a prolonged one erodes the projected refined copper surplus. The IEA notes the annual copper TC/RC benchmark settled at USD0/t in January 2026 (Reuters), with sulphide smelters surviving on byproduct revenues including acid and gold. Rising acid prices strengthen smelter margins. The pressure falls on the other side: the DRC's oxide operations, which consume acid rather than produce it, face input costs that have quadrupled in two years. If acid supply does not return, it is the SX-EW plants that cut production, and refined copper supply falls.
The bull case for copper later this year is acid-supply-driven, not demand-driven. It runs through the same chokepoint and the same chemical threatening phosphate fertiliser and food security. The competition between the mining sector and the fertiliser sector for a shrinking pool of sulphuric acid has received almost no attention outside specialist circles. Karim Fawaz observes that the scarier disconnect is between oil markets and broader equity, capital, and FX markets, which remain unfazed. The repricing has not arrived. The acid chain will be part of its transmission.
The Investment Implication
Sulphuric acid sits beneath both the food system and the industrial metals complex. Phosphate fertiliser and copper cathode production depend on it. Both are physically constrained by the same chokepoint and the same supply failures. The geopolitical contests producing these fractures will not end with this ceasefire. The Hormuz closure is a preview of how resource corridors behave under great power competition.
Practitioners in the Zambian fuel supply chain observe that the Russia-Ukraine disruption, which was smaller in magnitude, took roughly twelve months to normalise across oil and fertiliser markets. This crisis involves the physical closure of the world’s most critical commodity corridor for 44 days and counting, with a ceasefire that collapsed into a US naval blockade. We should be planning for at least twelve months. The evidence suggests longer.
The cascade multiplies; it does not add. Energy prices drive fertiliser costs, which drive planting decisions, which drive harvest volumes and food prices. Food prices drive political instability in import-dependent states. A ceasefire removes the trigger. It does not reverse the trajectory. The procurement timeline described above is the investment timeline.
This essay has traced a single chemical compound from a blocked chokepoint through phosphate fields, copper leaching pads, and planting decisions across the continent. The fiscal cost of Zambia’s next FISP tender, the price Kenya pays for its next fertiliser shipment, the margin on every tonne of DRC copper cathode, and the viability of Morocco’s phosphate processing all sit downstream of the same three supply failures.
The Hormuz closure is not an isolated event. It sits inside a pattern of supply corridor disruptions that has been accelerating since the tariff escalation of April 2025, running through the Venezuela-Guyana corridor and now into the Gulf. The confrontations driving these fractures are structural features of great power competition. The volatility they produce is likely to recur over the next five years at least. That changes the investment horizon from waiting for the crisis to pass to positioning for a world in which supply corridors are periodically contested.
Institutional portfolios are already reflecting this. Private real assets from wealthy clients are growing three times faster than traditional financial channels (Oliver Wyman, 2026). BlackRock’s 2026 outlook describes the shift as private markets moving from peripheral to essential against a backdrop of structural inflation. The 60/40 model, built for open supply chains and predictable monetary cycles, is giving way to frameworks anchored in productive physical systems. The capital suited to that world is connected to what those contests are repricing: the agricultural land where the maize-to-soya signal tells you fertiliser costs are rewriting planting economics, the water systems whose criticality the Gulf desalination crisis has measured in litres per household per day, the energy infrastructure that does not depend on a 34-kilometre channel, and the strategic minerals the battery supply chain requires. The capital that assumed the pre-April 2025 supply architecture would hold is the capital most exposed to discovering it will not.
The Architecture Question
Forty-four days after the Strait closed, the ceasefire has collapsed into a US naval blockade. Three supply failures that did not exist on 19 March have converged on a single chemical beneath both the food system and the industrial metals complex.
China’s yuan energy corridor is accelerating during the crisis. Africa has settlement architecture and is not using it. The fertiliser to be procured for the next African planting season will be priced in this supply environment. The copper that the DRC produces, and that the global energy transition requires, depends on an acid chain running through the same chokepoint. The phosphate that Morocco processes, and that global agriculture requires, depends on the same chemical from the same blocked sources.
The headline is still oil. The downstream is already being priced into fertiliser tenders, acid spot markets, and procurement calendars across the continent.
The infrastructure exists. The crisis exists. The arbitrage exists. What is missing is the decision to connect them before the next procurement cycle prices the acid shock into African food budgets and copper cathode margins for the next twelve to eighteen months.
Structure precedes sentiment.
The full downstream cascade analysis, including detailed country-level fuel and fertiliser mechanics for Nigeria, Kenya, and Zambia, is available in “Quick Take: The Shock That Is Not One,” published 19 March 2026 on Canary Compass.
Sources
Craig Tindale, raw materials and industrial cascade analysis, public thread and Simultaneity Metrics Framework contributions, April 2026. Robert Friedland, Ivanhoe Mines founder and executive co-chairman, public disclosures on Chinese sulphuric acid exports (preliminary Chinese customs data), Kamoa-Kakula operational data, and DRC Copperbelt acid supply, March-April 2026; Ivanhoe Mines corporate disclosures, January and March 2026. Ed Finley-Richardson, maritime analyst, public thread on Hormuz toll mechanism and OFAC compliance architecture, 8-9 April 2026. New York Times, reporting on Iranian mine-laying and cleared corridor toll mechanism, sourced to US officials, 10 April 2026. US Central Command (CENTCOM), mine clearance operations announcement, 11 April 2026; blockade scope clarification (non-Iranian port transit permitted), 12 April 2026. Al Jazeera, Saudi East-West pipeline restoration to full capacity, 12 April 2026. Hapag-Lloyd, shipping normalisation timeline estimate, April 2026. President Donald Trump, Truth Social statement on US naval blockade of Strait of Hormuz, 12 April 2026. Velina Tchakarova, geopolitical and systemic risk analyst, “The Global System Rupture” series, March-April 2026. Karim Fawaz, observation on physical oil and financial market disconnect, April 2026. Bloomberg, confirmation of China sulphuric acid export halt, 10 April 2026. Bloomberg Intelligence, DRC copper-sulphuric acid dependency estimates, March 2026. S&P Global Trade Atlas, Persian Gulf seaborne sulphur export share. International Energy Agency, copper smelter TC/RC benchmark and byproduct revenue analysis, March 2026. Goldman Sachs, DRC acid inventory estimates and refined copper surplus projections, April 2026. Reuters, Antofagasta/CSPT TC/RC settlement reporting, January 2026. CRU Group and BC Insight, DRC acid demand estimates (2024 data, November 2025). USGS, DRC copper production data (2025 estimates). Fastmarkets, DRC copper production forecasts and TC/RC reporting. Zambia Statistics Agency, 2024/25 Crop Forecasting Survey. Food Reserve Agency, 2025 crop marketing season purchase prices and volumes. Open Zambia, FRA floor price announcement June 2025. Zambian Business Times, FRA historical pricing and SAFADA commentary, 2020-2023. Milling MEA, FRA 2023 pricing announcement. Presidential Delivery Unit, FRA record 1.6m MT purchase, March 2026. Zambian Observer, “FRA’s Deepening Fiscal Trap,” November 2025, storage capacity, FRA purchase data, and miller subsidy mechanism. Nathan Kakhoma, FX and Commodities Risk Management Specialist, LinkedIn, April 2026, Lusaka maize market pricing and freight costs. Zambia Agricultural Commodity Exchange (ZAMACE), FRA selling programme data. AGRA Food Security Monitor, Tanzania maize production and surplus, August 2025. USDA Foreign Agricultural Service GAIN Report, Tanzania grain and feed annual, April 2025. Milling MEA, NFRA grain sales and contracts, February 2025. The Citizen (Tanzania), NFRA grain tender, October 2025. TanzaniaInvest, NFRA storage expansion and food security bond, July 2025. FAO, Tanzania total cereal production estimate. NOAA Climate Prediction Center, ENSO Diagnostic Discussion and El Nino probability forecast, March 2026. International Research Institute for Climate and Society (IRI), ENSO probability forecast, March 2026. South African NAMC SASDE, maize production and export data, October 2025. Wandile Sihlobo (Agbiz), South Africa maize export analysis. Grain SA and Business Day, SAFEX white maize spot pricing, January 2026. Trading Economics, USD/ZMW exchange rate data. Nation Africa, Kenya fertiliser subsidy budget reporting. IEA Kenya, fertiliser import data. IFPRI, Kenya National Fertiliser Subsidy Programme assessment. Afreximbank and TechCabal, PAPSS operational data including country count, bank connectivity, and PACM launch, February-March 2026. Oliver Wyman, private wealth asset allocation trends, 2026. BlackRock, Private Markets Outlook for US Wealth, 2026.
Disclaimer
This article does not constitute legal, financial, or investment advice. The author shares views for perspective and discussion only. Do not rely on them as a substitute for professional advice tailored to your specific circumstances. Always consult a qualified legal, financial, investment, or other professional adviser before making decisions based on this content. The analysis reflects proprietary research undertaken by Canary Compass and the author.
Canary Compass and the author accept no liability for actions taken or not taken based on the information in this article.
The views expressed in this article represent the author’s independent professional analysis and do not constitute an endorsement of any individual, institution, or position. Canary Compass and the author accept no responsibility for how this content is interpreted, excerpted, or recontextualised by third parties not involved in its production and publication. Reproducing any portion of this work in isolation, or in combination with other material, in a manner that misrepresents the author’s original meaning constitutes a distortion of the published record.
The author may hold positions in financial instruments, currencies, or assets discussed or referenced in this publication. Such positions do not constitute a recommendation to buy or sell.
All views, projections, and forecasts reflect the author’s assessment at the time of writing. Data sourced from third parties is believed to be reliable but has not been independently verified. Past performance does not indicate future results.
All content published by Canary Compass is the intellectual property of the author. Reproduction, adaptation, or redistribution, in whole or in part, requires written permission.
About the Author
Dean N. Onyambu is the Founder and Chief Editor of Canary Compass, a financial research publication focused on African monetary architecture and financial sovereignty. He brings 18 years of experience across trading, fund leadership, and economic policy, with senior roles at Standard Bank, First Capital Bank, and Opportunik Global Fund.
Read and subscribe at www.canarycompass.com.
The Canary Compass Channel is available on @CanaryCompassWhatsApp for economic and financial market updates on the go.
For more insights from Dean, you can follow him on LinkedIn @DeanNOnyambu or X @InfinitelyDean.