
Behind the Lending Rate: What Your Bank Does Not Show You
How the margin on your loan is constructed, why rate cuts widen it, and what that means for every borrower in every country where this structure exists.


Image: AI-generated illustration of a lending rate refracted through a prism into its component layers
0. Executive Summary
On 11 February 2026, the Bank of Zambia cut the Monetary Policy Rate by 75 basis points to 13.50 per cent. By the week ending 27 February, the retail lending rate had increased by 124 basis points, while the corporate lending rate had decreased by 159 basis points relative to three weeks earlier. The retail margin widened by 199 basis points. Every observable system-level cost input either improved or held steady: the policy rate fell, government securities yields were compressing across the curve, and the banking system was at its strongest credit position in over a decade. No disclosed component-level explanation accompanied the movement. This was not an isolated episode. Data from every MPC rate decision since May 2023, when the Bank of Zambia began publishing disaggregated retail margin data, shows a consistent pattern: from August 2023 onward, banks compressed the retail margin during every rate hike; during both rate cuts in the current cycle, banks widened it immediately. The academic literature calls this asymmetric pass-through. This essay calls it a transparency problem. The pattern can be observed from public data. The mechanism behind it cannot. Nothing in Zambia’s regulatory framework requires banks to explain what sits inside the margin. Until that changes, rate cuts intended for borrowers will continue to be absorbed by the institutions that price the loans.
This essay opens the margin. It maps the six cost and return layers inside it, constructs an illustrative waterfall from verified regulatory and market inputs, presents the full monetary policy cycle evidence, and proposes a transparency-and-incentives reform grounded in existing Bank of Zambia authority and tested against Kenya’s operational precedent.
1. The February Finding
On 11 February 2026, the Bank of Zambia cut the Monetary Policy Rate by 75 basis points (one hundredth of a percentage point each) to 13.50 per cent, the second consecutive cut following a 25 basis point reduction in November 2025. The stated purpose was to support the economy as inflation returned toward the 6 to 8 per cent target band.
The Bank of Zambia publishes fortnightly statistics showing the policy rate, the base rate, the lending rate, and the margin for retail and non-retail (corporate) borrowers. In the week ending 6 February, before the cut, the average retail lending rate was 27.54 per cent. By the week ending 27 February, it had reached 28.78 per cent. The policy rate fell by 75 basis points. The retail lending rate rose by 124 basis points. For new borrowers, the rate cut made their loans more expensive.
Corporate borrowers experienced the opposite. Their lending rate fell from 21.87 per cent to 20.28 per cent, a decline of 159 basis points. Corporate borrowers are multibanked and can credibly threaten to move their business. Retail borrowers cannot.
The rate cut moved the base down. The banks moved the margin up. The retail borrower paid more. If the pattern is observable, why is the mechanism invisible?
2. What a Rate Cut Actually Does
When a bank in Zambia offers you a loan, it shows you two numbers: the Bank of Zambia policy rate and your margin. The policy rate is public. The margin is set on the day your loan is approved. For many retail facilities, it stays fixed for the life of the loan. For a corporate borrower with bargaining power, it may be renegotiated at the next review. The margin is the black box.
Your Rate = BoZ Policy Rate + Margin
The bank's internal pricing benchmark is the return it could earn by deploying the same money, for the same duration, in the next-best alternative available to it, typically government securities at the matching tenor. That price has a formal name in economics: the opportunity cost (Hirshleifer, 1956). The bank's Treasury department sets this internal price, known as the funds transfer price, and charges it to the business unit that originates the loan. In practice, the Treasury desk acts as an internal wholesale lender: it prices the funds, and the business unit marks them up to cover its own costs and return target. The margin on your loan agreement is the sum of both.
When government securities yields compress across the curve, as they did in early 2026, the carry income banks earn on their bond portfolios declines. To protect the net interest margin, the rational response, typically directed through the ALCO framework, is to recover lost carry income through the lending margin on new originations. This mechanism operates wherever banks hold large government securities portfolios and face imperfect competition in retail lending (Mishra, Montiel, and Spilimbergo, 2012).
For existing borrowers on floating rate loans, a rate cut passes through mechanically on the base. The margin stays. That part works. For new borrowers, the bank recalculates the margin for each application. If nothing inside the margin has changed, the margin should stay the same. The February episode shows the opposite.
3. The Six Layers Inside Your Margin
If you borrow K100,000 for 12 months at 28.78 per cent, you pay K28,780 in interest. Of that, K13,500 is the policy rate component. The remaining K15,280 is your margin. Here is what sits inside that K15,280.
The margin is a composite sum of six distinct cost and return layers, built on top of the base rate. Three sit on the treasury side: they represent the internal transfer price the business unit pays for the funds. Three sit on the business-unit side: they represent what the business unit adds for credit risk, operating costs, and shareholder returns. The allocation between the two sides varies by institution; some banks embed additional components in the treasury transfer price. Each layer has a different driver and a different policy lever.
3.1 The Term Premium
The policy rate is an overnight rate. Your loan is not overnight. If you borrow for 12 months, the bank must fund that commitment at the corresponding tenor. The 364-day Treasury bill yield stood at 14.00 per cent in the week ending 20 February 2026, 50 basis points above the overnight rate. A borrower taking a five-year loan faces a wider curve premium. At the government bond auction of 13 February 2026, the 5-year yield was 14.98 per cent (annual rate compounded semi-annually, equivalent to an effective annual yield of approximately 15.5 per cent), a spread of roughly two percentage points above the overnight rate.
The 50 basis points represents the observed yield curve spread between the 12-month T-bill and the overnight rate. It is an opportunity cost benchmark: the bank’s alternative to lending you the money is buying the T-bill, so the loan must at minimum match the T-bill yield. In practice, a loan is less liquid than a tradeable government security (the bank cannot sell your loan on a secondary market the way it can sell a T-bill), and this illiquidity carries an additional cost. That liquidity premium is real but not separately observable; in this construction it is absorbed into the residual layer described in Section 3.3.
3.2 The Statutory Reserve Cost
The central bank requires every commercial bank to hold 26 per cent of all deposits at the Bank of Zambia. Of every K100 a bank receives, K26 is immediately sterilised. Since 3 June 2024, when CB Circular No. 11 took effect, the BoZ has permitted banks to meet up to 40 per cent of this requirement using eligible government securities at two-year, three-year, and five-year tenors, purchased in a one-off allocation window. The yields at inception were 17 per cent (two-year), 20 per cent (three-year), and 22 per cent (five-year), as set in the Government Bond Auction 5A/2024/BA of 6 June 2024. The portfolio is fixed: banks cannot replace maturing securities with new purchases for SRR purposes, and deposit growth since June 2024 means the eligible securities now represent a smaller share of the total reserve base.
Of the K26, approximately K15.60 sits at the central bank earning nothing; up to K10.40 per K100 of deposits could be held in eligible government securities at inception in June 2024, earning yields of 17 to 22 per cent depending on tenor. Because the portfolio is fixed and deposits have grown since the allocation window, the eligible securities now cover a smaller share of the total reserve requirement than the original 40 per cent, increasing the unremunerated portion. The effective sterilisation cost is the income foregone on the unremunerated portion, allocated through the FTP framework across the bank's earning assets. At the system's 46.3 per cent loan-to-deposit ratio (end-December 2025), banks deploy more of their deposit base in government securities than in private lending. Commercial banks hold government securities equivalent to 51 per cent of their local currency deposits while genuine kwacha private credit reaches 7.4 per cent of GDP (end-September 2025). The allocation is rational: government paper carries a zero per cent risk weight while retail lending attracts 75 per cent, creating a capital cost differential that reinforces the preference for securities over lending and reduces the incentive to compete on retail pricing. The precise sterilisation cost varies by bank depending on the tenor mix and purchase yields of its SRR-eligible securities portfolio.
3.3 The Country-Specific Adjustment
Banks operating in every jurisdiction face a country-specific cost layer, but its magnitude reflects the sovereign credit environment. For subsidiaries of international banking groups in Zambia, that charge reflects a Caa2-rated sovereign with a recent default history, repatriation risk, and parent-entity capital allocation requirements, and is set explicitly by the parent’s transfer pricing framework. The non-renewal of Zambia’s IMF Extended Credit Facility after its expiry in January 2026 may have prompted parent groups to revise this charge upward, making it potentially the one cost input that shifted against borrowers in the February window. If so, it applies equally to retail and non-retail lending and cannot account for the divergence between the two. This practice is standard across international banking groups operating in emerging markets, documented in the FTP literature (Tumasyan, 2012) and observable in the published financial statements of international subsidiaries, where lending spreads in higher-risk jurisdictions are typically wider than those in the parent’s home market. Moody’s upgraded Zambia from Ca to Caa2 with positive outlook in April 2025, following debt restructuring.
Domestic banks do not receive a country risk charge from a parent group. Their shareholders price the equivalent through the return on equity they demand for keeping capital deployed in Zambia, at that institution, rather than in alternative deployments domestically or offshore, which flows through the capital charge in Section 3.6 rather than as a separate FTP layer. This does not mean domestic banks offer cheaper loans. While their cost architecture differs, market competition and offsetting funding advantages force convergence at the final lending rate.
For retail borrowers, this distinction matters less than for corporates: the retail borrower lacks the bargaining power to force the bank to absorb any component of its internal cost structure, regardless of ownership.
In the waterfall construction, this layer is derived as the residual after all other layers are subtracted. It therefore absorbs the country-specific adjustment where it is explicitly priced, the loan liquidity premium described in Section 3.1, estimation error from the operating cost allocation and expected credit loss estimates, and any bank-specific pricing discretion.
3.4 Expected Credit Loss
The bank estimates that some borrowers will default and prices this expected loss into every loan, distinct from the capital charge (which covers unexpected losses) and the country-specific adjustment (which covers the sovereign environment). For a salaried borrower whose salary is domiciled at the lending bank, the expected credit loss is perhaps 1.0 to 1.5 per cent, reflecting a probability of default of 2 to 3 per cent against an unsecured loss given default of 40 to 50 per cent.
Banks price credit risk on a forward-looking basis under IFRS 9, incorporating macroeconomic scenario weightings that may diverge from the current observed NPL ratio. The system-wide NPL ratio stood at 2.8 per cent at December 2025, the lowest in over a decade. Provisions covered 110 per cent of non-performing loans, consistent with banks maintaining reserves as the NPL ratio improved rather than releasing them. Forward-looking IFRS 9 models may still require additional coverage for the performing book under adverse macroeconomic scenarios, but the backward-looking indicator suggests the system was not under acute credit stress at the time of the cut. The October 2025 Financial Stability Report showed 3.5 per cent NPL and 99 per cent coverage; the continued decline in the NPL ratio to 2.8 per cent by December 2025 confirms the trajectory.
3.5 Operating Cost Allocation
Branches, staff, technology, compliance departments, and the infrastructure required to operate a banking licence in Zambia must all be recovered. The sector’s cost-to-income ratio was 49.4 per cent at end-December 2025. Nearly half of every kwacha of operating income was consumed by operating costs. A rate cut does not make branches cheaper.
3.6 The Capital Charge
The regulator requires banks to hold equity against every loan. Under the BoZ’s Credit Risk RWA Directives (2025), a qualifying unsecured retail loan attracts a 75 per cent risk weight. At this weight, allocated equity per K100 of retail lending is approximately 19.4 per cent (75 per cent of the system capital adequacy ratio of 25.8 per cent). The sector earned a cumulative return on equity of 27.7 per cent in 2025. The waterfall uses the realised system ROE as a proxy for the return target banks price into retail loans. Individual banks set segment-specific hurdle rates that may differ from the system-wide outcome. The capital charge is 5.36 percentage points.
The rationale is straightforward. For every K100 lent, the risk weight determines how much of the loan the regulator treats as risk exposure (K75). The capital adequacy ratio determines how much equity the bank must hold against that exposure (K19.35). The return on equity determines what the shareholders demand for tying up that capital in this loan rather than deploying it elsewhere (K5.36). The borrower pays that cost through the lending rate.
The system capital adequacy ratio of 25.8 per cent is well above the 13 per cent published statutory minimum-plus-buffer (10 per cent total regulatory capital under Rule 6(2) of SI 62, plus a 3 per cent capital conservation buffer under Rule 8(1)). Individual banks may face higher effective requirements through bank-specific ICAAP assessments under Rule 20, internal management buffers, and parent group capital standards, though these are not publicly disclosed. The gap between the published minimum and the system ratio reflects the composition of bank balance sheets: heavy holdings of zero-risk-weight government securities compress the denominator (risk-weighted assets), mechanically inflating the capital ratio. It also reflects conservative payout ratios and regulatory preference for capital retention in a highly profitable sector. The high ratio increases the capital charge in every loan because banks price off the actual return on equity applied to the actual allocated capital, regardless of whether that capital level was chosen or is a structural artefact.
4. The Illustrative Waterfall
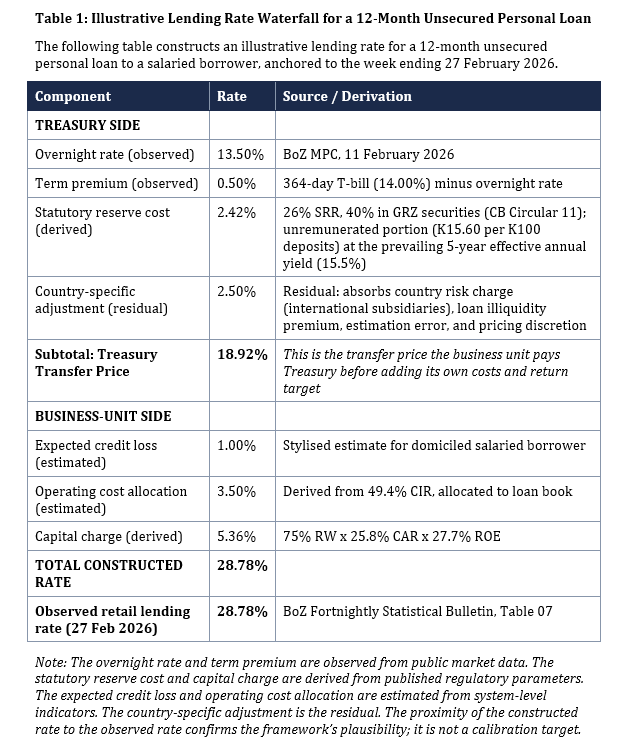
Sensitivity: if operating costs are 2.50, 3.50, or 4.50 per cent, the residual adjusts to 3.50, 2.50, or 1.50 per cent respectively. The waterfall is illustrative. Individual bank pricing reflects institution-specific FTP frameworks, credit models, and return targets.
5. The Full Monetary Policy Cycle
The February 2026 episode is the essay's sharpest evidence, but it is not the only evidence. The academic literature on asymmetric interest rate pass-through, beginning with Hannan and Berger's (1991) evidence on price rigidity in banking and extended to lending rates by Cottarelli and Kourelis (1994) and Gambacorta (2008), predicts that lending rates adjust faster upward than downward. The Zambian data tells a more specific story.
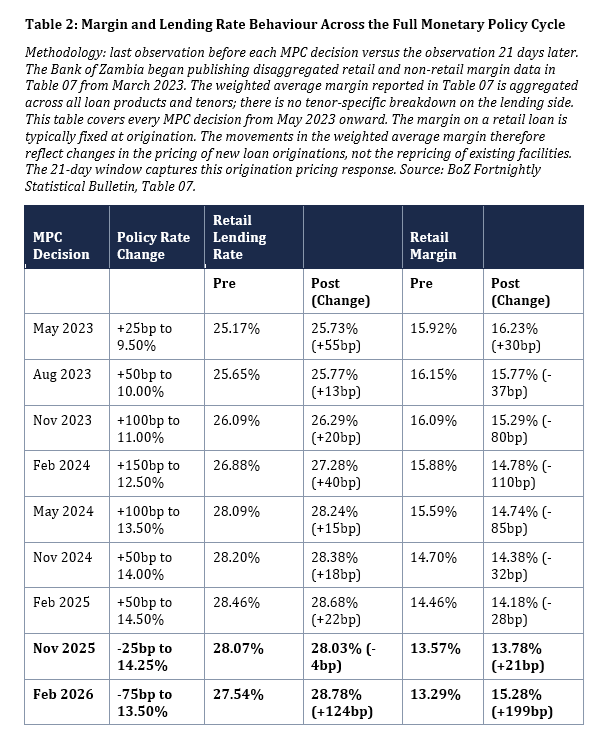
The table tells three stories.
First, the retail lending rate rose in every single rate hike episode (seven of seven) and also rose in one of two rate cut episodes. The May 2023 episode is an exception to the compression pattern: the margin widened by 30 basis points during a 25 basis point hike, the first MPC decision captured in the disaggregated data. From August 2023 onward, every hike produced margin compression. During the February 2026 cut, the margin widened by more than the base fell, so the rate rose despite the cut. The mechanism differs in each direction, but the outcome for the retail borrower was the same: a higher rate in eight of nine decisions.
Second, during the larger rate hikes from August 2023 onward, banks compressed the retail margin. The 150 basis point hike in February 2024 saw 110 basis points of margin compression. The 100 basis point hikes saw 80 to 85 basis points of compression. Banks absorbed part of each hike. Over the seven consecutive hikes from August 2023 to February 2025, the retail margin declined from 15.92 per cent to 14.18 per cent, a compression of 174 basis points. During the pause between February and November 2025, the margin compressed a further 61 basis points to 13.57 per cent without any change in the policy rate. Across the tightening and pause periods covered by the disaggregated data, the compression totalled 235 basis points.
Third, during both rate cuts, banks widened the margin immediately. In November 2025 (25 basis points), the margin widened by 21 basis points. In February 2026 (75 basis points), the margin widened by 199 basis points. Within the 21-day observation window, banks recovered approximately 73 per cent of what took two and a half years to compress. The credit environment was improving throughout the entire period covered by this table: the gross NPL ratio fell from 5.2 per cent in March 2023 to 2.8 per cent in December 2025, while provisions coverage remained above 85 per cent throughout, consistent with banks maintaining reserves as the NPL ratio improved rather than releasing them. A mild uptick in mid-2024 (to 4.8 per cent in September 2024) reversed within two quarters. By the time of both rate cuts, the banking system was at its strongest credit position in the entire observation window. The margin widened into an improving credit environment, which is difficult to reconcile with defensive pricing. Banking sector performance indicators for 2026 are not yet available.
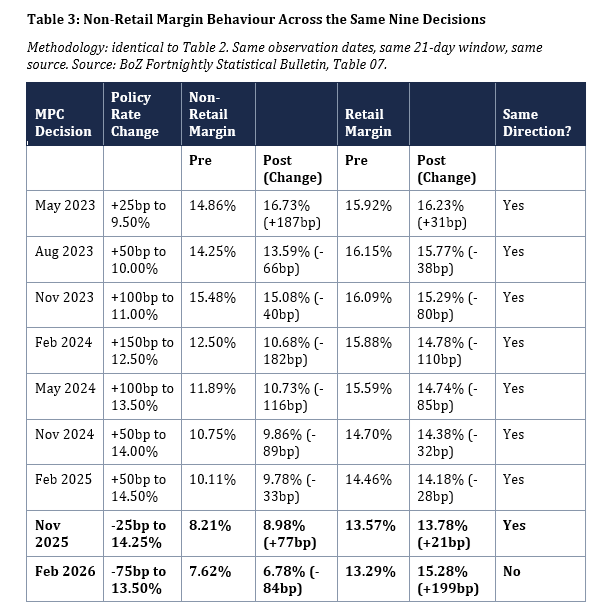
The non-retail data reveals the structure of the asymmetry. In eight of nine decisions, both margins moved in the same direction. During hikes, both compressed, though non-retail margins compressed more aggressively (the non-retail margin fell from 14.86 per cent to 8.21 per cent across the tightening and pause periods, a compression of 665 basis points, nearly three times the retail compression of 235 basis points). Corporate treasurers, multibanked and able to threaten reallocation, extracted more of each hike. During the November 2025 cut, both margins widened (retail by 21 basis points, non-retail by 77 basis points).
February 2026 is the only decision in which the margins diverged. The retail margin widened by 199 basis points. The non-retail margin compressed by a further 84 basis points. The February 2026 divergence occurred within the same institutions, on the same day, under the same rate cut and the same cost structure. The country risk charge may have risen following the expiry of Zambia’s IMF Extended Credit Facility in January 2026, but any such revision applies identically to retail and non-retail lending within the same institution and cannot explain the divergence.
The co-movement during eight decisions proves the cost inputs are shared. The single divergence, on the largest cut in the cycle, isolates bargaining power as the variable that determines which borrowers absorb the recovery. Lending concentration reinforces this: the twenty largest loans accounted for 65.6 per cent of total lending at December 2025. The corporate book is concentrated among a small number of large, multibanked borrowers with the bargaining power to resist margin widening. Retail borrowers have no equivalent leverage.
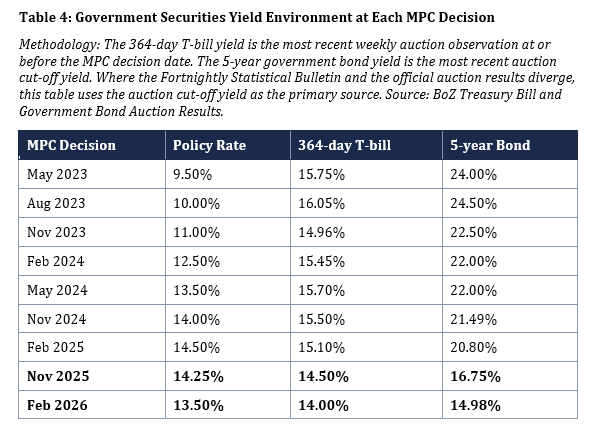
The yield environment adds a layer to the margin story. Between May 2023 and February 2026, the policy rate rose from 9.50 per cent to 14.50 per cent and then fell to 13.50 per cent. Over the same period, the 5-year government bond yield fell from 24.00 per cent to 14.98 per cent, a compression of approximately 900 basis points. The carry spread, the gap between what banks earn on their bond portfolios and what they pay for overnight funding, collapsed from roughly 1,450 basis points to 148 basis points. The policy rate and the yield curve are different instruments driven by different forces, and they do not always move together.
What the yield data shows is that margin compression slowed as the yield environment tightened. During the first five decisions (May 2023 through May 2024), when the 5-year yield held between 22.00 and 24.50 per cent, banks compressed the retail margin by 37 to 110 basis points per decision. As the yield curve compressed from November 2024 onward, margin compression slowed to 28 to 32 basis points per hike and reversed entirely during the rate cuts. The banking sector's government securities portfolio grew substantially through 2025, partly as banks increased volume to compensate for declining per-unit yields. That strategy faces a ceiling: sovereign concentration limits and balance sheet capacity constrain how far volume growth can go. At the same time, securities within the existing portfolio mature and must be reinvested at prevailing yields, mechanically eroding the carry income on the stock. The combined effect, a volume strategy that exhausts itself while the existing book reprices downward, concentrates the pressure on the lending margin. The slow-moving components of the margin (credit risk, operating costs, capital requirements) cannot account for movements that track the yield environment within 21-day windows. The component that adjusts is one that cannot be estimated from any public data.
This essay identifies observable correlations between yield curve movements, lending concentration, and margin behaviour. It does not establish causation. Establishing causation requires the component-level data that disclosure would produce. The argument for disclosure does not depend on proving the cause. It depends on the fact that no one, including the regulator, can currently determine the cause from public data.
The counter-argument is predictable: “We compressed margins during hikes to protect borrowers. We are restoring them during cuts.” The data supports the first half of that statement for both customer types. The question the data cannot answer is: which component did you compress during hikes, and which component are you restoring during cuts? Was it the credit risk charge? The operating cost allocation? The return target? The country-specific adjustment? And if the restoration was legitimate, why did it apply only to retail borrowers while corporates, at the same banks, on the same day, saw their margins compress further?
Nobody can answer these questions. Not the borrower, not the journalist, not the IMF. The Bank of Zambia’s supervisory processes can access internal pricing governance structures through on-site examinations, which review ALCO frameworks, credit policies, and risk management structures as part of the statutory mandate. These examinations expose the bank’s internal pricing architecture to supervisory scrutiny, though the primary focus of on-site examination is prudential soundness rather than consumer pricing fairness. The information exists inside the regulatory relationship. What does not exist is public disclosure. The borrower signing the loan agreement cannot see what the supervisor can access. The market cannot discipline what is not visible to it.
That is the transparency problem. The data shows the pattern. Component disclosure shows the mechanism. Without both, the pattern is observable but unexplainable. The essay is consistent with the interpretation that margin behaviour reflects protection of net interest income in an opaque pricing environment. Component disclosure would distinguish between legitimate cost recovery and unexplained margin expansion. Its absence means neither can be tested.
The prevailing conditions at the time of the February 2026 cut reinforce this interpretation. The banking sector indicators described in Sections 3.4 through 3.6 show a system that was well-capitalised, profitable, liquid, and experiencing the lowest credit stress in over a decade. These are stock figures, not three-week movements. They describe the environment in which the margin widened, not the cause of the widening.
The compositional shift explanation deserves particular attention because of what Table 07 measures. The weighted average margin is aggregated across all retail loan products and tenors. If banks originated a higher share of longer-tenor or higher-risk retail loans in the weeks following the cut (unsecured personal loans rather than secured staff facilities, for example), the weighted-average margin would widen mathematically even without any bank changing its pricing on any individual product. This is a structurally valid explanation for any single observation, including February 2026. It cannot, however, explain the directional consistency across nine decisions. Compositional noise does not systematically produce margin compression during every hike and margin widening during both cuts. If composition were driving the February 2026 result, similar compositional effects would appear during hikes, where a week of heavy personal loan origination could widen the margin against the trend. That does not appear in the data. The compositional argument also struggles with the February 2026 divergence. Explaining the simultaneous retail widening and non-retail compression through composition alone would require two opposing shifts in origination mix, retail skewing toward higher-margin products while non-retail skews toward lower-margin products, occurring in the same weeks, at the same institutions, under the same rate cut. That is possible but compounds the improbability.
Other alternative explanations exist: ALCO repricing lags, forward-looking IFRS 9 adjustments where expected losses under macroeconomic scenario weightings diverge from the observed NPL ratio, and a potential upward revision to the country risk charge following the expiry of the IMF ECF in January 2026. Without component disclosure, none of these explanations can be tested against the alternative.
6. Kenya: What Comparison Shopping Can and Cannot Do
Kenya offers the closest regional precedent. The Central Bank of Kenya cut its benchmark rate from a peak of 13.00 per cent to 8.75 per cent by February 2026, a cumulative reduction of 425 basis points across ten consecutive meetings beginning in August 2024. The average commercial banks’ lending rate fell from 17.22 per cent in November 2024 to 14.80 per cent by January 2026, a decline of 242 basis points. CBK data reported by Business Daily indicated that through the early stages of the easing cycle, only a minority of commercial banks passed through the full rate reduction, while a significant number raised their rates.
Kenya built the transparency infrastructure Zambia lacks, and the margin still absorbed the cuts. The Kenya Bankers Association, in partnership with the Central Bank of Kenya, has operated a centralised Total Cost of Credit platform since 2017, publishing per-bank lending rates by product category, fees, and a standardised loan calculator. The CBK publishes per-bank disaggregated rates monthly, creating a regular public accountability cycle where national media report which bank is cheapest and which is most expensive, by name, every month.
In September 2025, the CBK went further. The revised Risk-Based Credit Pricing Model requires all new variable-rate loans to be priced as KESONIA (the Kenya Shilling Overnight Interbank Average) plus a premium, where the premium reflects the bank’s operating costs, return to shareholders, and the borrower’s risk profile. Banks must define the components that make up this premium. They must develop their internal pricing models, secure board approval, and submit them to the CBK. They must publish their weighted average lending rates, weighted average premium, and all fees for each loan product on the TCC website and on their own websites.
Kenya is not telling banks what to charge. Kenya is saying: prove the methodology behind the number.
Zambia’s starting position is closer to Kenya’s than it appears. Zambian loan documents already price as Bank of Zambia policy rate plus margin, with fees separate. The BoZ publishes per-bank lending rates, margins above the policy rate, and fees in the Consolidated Bank Charges Publication, though the most recent edition contains data as at June 2024, making it twenty-one months stale by the time of this essay. What Zambia lacks is the frequency (the BoZ publication is semi-annual at best; the CBK publishes monthly), the consumer-facing platform (the Bankers Association of Zambia has no equivalent of the TCC), and the component layer (neither the BoZ nor any Zambian regulation requires banks to define, disclose, or justify the components inside the premium).
The prevailing Banking and Financial Services Act (No. 7 of 2017, as amended in 2020) and the Cost of Borrowing Regulations (SI 179 of 1995) require disclosure of the total cost of credit as a single annual percentage rate. They do not require disclosure of its components. The Banking and Financial Services Bill, 2025 (No. 36 of 2025), currently progressing through the National Assembly, includes market conduct and financial consumer protection among its objects and gives the Bank of Zambia explicit authority under Section 110(3) to “determine the manner and form, and content of information, required to be disclosed.” If enacted, the BoZ could use this provision to mandate component disclosure. But the Bill does not require it. The gap this essay identifies would persist even after the new Act takes effect, unless the BoZ exercises its discretion to close it.
7. What Must Change
The reform has three layers. The first two are proven in Kenya. The third goes further.
The first layer is frequency and platform. The BoZ should publish per-bank disaggregated lending rates, margins, and fees monthly rather than at the current semi-annual frequency. The Bankers Association of Zambia should build a consumer-facing comparison platform equivalent to Kenya's TCC, developed in partnership with the BoZ as the KBA did with the CBK. Both are operational tasks with established precedents.
The second layer is component disclosure. Every bank should publish, quarterly, the weighted components of its lending margin by product category (personal loans, mortgages, SME facilities, vehicle finance, overdraft facilities, agricultural credit): the funding cost, credit risk charge, operating cost allocation, capital charge, and residual. When the weighted average margin on any product category moves by more than 75 basis points in any quarter, the bank should publish a written explanation identifying which component drove the movement. The threshold is derived from the retail margin data. Across nine MPC decisions since May 2023, retail margin movements cluster into two groups: five between 21 and 37 basis points, and four between 80 and 199 basis points. No observation falls between 38 and 79 basis points. Any threshold within that gap produces the same classification of the nine episodes. The proposed threshold is set at 75 basis points, near the top of the gap, for two reasons. First, the underlying observations are 21-day movements; on a quarterly reporting cycle, smaller weekly movements can compound, and a higher threshold reduces the risk of triggering explanations for accumulated noise. Second, 75 basis points translates to approximately K750 per K100,000 of annual borrowing, a change the borrower would notice on a loan statement. The threshold is a proposed starting point, not a permanent calibration. The nine observations span less than three years, and the gap between the two clusters may narrow as the dataset grows. The 21-day measurement window used here differs from the quarterly reporting cycle the proposal prescribes, and product-level distributions may differ from the system-wide aggregate. The BoZ should review the threshold once quarterly product-level data accumulates. Non-retail margins move more aggressively, but corporate borrowers are individually priced through relationship negotiation rather than published product-level rates. The retail threshold addresses the opacity that retail borrowers face.
Kenya requires banks to submit their internal pricing models to the CBK for board-level approval and to publish the components of the premium. The proposal here goes further: it adds the quarterly explanation trigger and the incentive layer that follows.
Banks may argue that margin components are commercially sensitive. The argument is weak. Banks already study each other’s funding structures and pricing through published financial statements, and large corporates already compare offers across institutions. The current opacity only leaves households, small firms, and depositors without visibility. The proposal asks for weighted averages by product category, not proprietary formulas. Product categories with insufficient facility volumes to protect borrower confidentiality could be aggregated or exempted from granular disclosure. The proposal closes the gap between what banks know about each other and what the public can see.
The Bank of Zambia’s supervisory processes can access internal pricing governance structures and risk management frameworks through on-site examinations. The reform does not ask the BoZ to obtain information it does not have. It asks the BoZ to mandate public disclosure of pricing components that banks already calculate internally. The implementation cost is disclosure, not discovery.
The BoZ holds the regulatory authority to mandate this. Under the prevailing Banking and Financial Services Act, 2017, the Bank of Zambia can require financial service providers to submit information on any matter relating to their affairs or business (Section 151) and may publish that information where it considers it necessary or appropriate (Section 153). The authority to prescribe the manner, form, and content of pricing disclosure rests with the Minister, in consultation with the Bank, under Section 106(3). The pending Bill transfers this authority directly to the Bank under Section 110(3), removing the requirement for ministerial prescription. The Public Disclosure Directives under Rule 21 of the Banking and Financial Services (Capital Adequacy) Rules, 2025 (Statutory Instrument No. 62 of 2025), operationalised by the Banking and Financial Services (Public Disclosure of Capital and Risk Exposures) Directives, 2025 (Gazette Notice No. 1199 of 2025, Special Gazette No. 116 of 19 September 2025), provide an additional basis, though Rule 21 was designed for disclosure of capital and risk exposures. A purpose-built directive explicitly referencing the pricing of financial products would be more resilient to legal challenge and more operationally precise.
The third layer is incentives. The incentive layer links disclosure to prudential consequences. Banks that demonstrate lending rate pass-through consistent with their disclosed component movements could receive tiered SRR relief, reducing the sterilisation cost. The SRR relief mechanism is achievable under the Bank of Zambia’s existing monetary policy authority and must be calibrated to avoid aggregate sterilisation consequences, which may require a cap on total relief or a phase-in linked to the monetary policy cycle. Banks that fail to explain margin movements above the 75 basis point threshold could face conditional capital buffer requirements. Linking capital buffers to conduct rather than prudential metrics would represent a departure from the current Basel III framework and may require explicit legislative authority, potentially through the pending Banking and Financial Services Bill, 2025. This transforms disclosure from a reporting exercise into a transmission instrument.
The proposal does not ask banks to create new information. It asks them to publish a summary of what their pricing frameworks already calculate. If the margin compression during hikes was driven by genuine cost absorption, the components will show it. If the margin widening during cuts was driven by legitimate risk repricing or cost recovery, the components will show that too. In every case, the borrower, the regulator, and the market can see the answer.
Ask your bank for a breakdown of your margin. If they cannot give you one, ask why.
Sourcing Note
The lending rate and margin data in this essay are sourced to the Bank of Zambia Fortnightly Statistical Bulletin, Table 07 (available at boz.zm/fortnight-statistics.htm). The Bank of Zambia began publishing disaggregated retail and non-retail interest rate data in Table 07 from March 2023. The full-cycle analysis in Table 2 uses the last observation before each MPC decision and the observation 21 days later, applied consistently across all nine episodes from May 2023 onward. The February 2026 observations are from weeks ending 6 February (pre-cut) and 27 February (post-cut). Readers may verify the underlying data by requesting the specific Table 07 bulletin editions from the Bank of Zambia or by contacting the author. The January 2026 monthly average (28.02 per cent retail, 21.90 per cent non-retail) provides baseline context.
Banking sector key performance indicators (NPL ratio 2.8 per cent, provisions 110 per cent, CAR 25.8 per cent, CIR 49.4 per cent, ROE 27.7 per cent, LDR 46.3 per cent) are as at end-December 2025, sourced to the BoZ Banking Sector KPIs (available at boz.zm). The twenty largest loans accounted for 65.6 per cent of total lending at December 2025, from the same source. The gross NPL trajectory from 5.2 per cent (March 2023) to 2.8 per cent (December 2025) and provisions-to-NPL from 85 per cent to 110 per cent over the same period are sourced to the BoZ Banking Sector Performance Indicators spreadsheet. The ROE of 33.8 per cent cited for 2023 is as at end-December 2023 from the same source. The October 2025 Financial Stability Report (3.5 per cent NPL, 99 per cent coverage) provides the last publicly available FSR data point. Commercial banks’ government securities holdings at 51 per cent of local currency deposits and genuine kwacha private credit at 7.4 per cent of GDP are as at end-September 2025, sourced to the author’s analysis in “Structure Before Sentiment,” Part 3 (Canary Compass, 2025), derived from BoZ monetary and financial statistics. The BoZ Consolidated Bank Charges Publication (most recent edition: data as at June 2024, published circa March 2025, available at boz.zm) is cited in Section 6. Government securities yield compression across the curve in early 2026, driven by non-resident inflows following the increase in the non-resident participation cap from 5 to 23 per cent (CB Circular No. 01/2026, effective January 2026), is documented in the author’s working paper “The Forecast Is Not the Evidence” (Canary Compass, March 2026).
The SRR of 26 per cent on both kwacha and foreign currency deposits is set by CB Circular No. 02/2024 (effective 5 February 2024). The 40 per cent eligible government securities carve-out is set by CB Circular No. 11 (effective 3 June 2024). Eligible securities comprised two-year, three-year, and five-year government bonds offered in Government Bond Auction 5A/2024/BA of 6 June 2024, at yields of 17 per cent, 20 per cent, and 22 per cent respectively. The allocation was a one-off window; the eligible portfolio declines as securities mature or are sold.
The capital adequacy framework is set by the Banking and Financial Services (Capital Adequacy) Rules, 2025 (Statutory Instrument No. 62 of 2025, signed 12 September 2025, gazetted in Special Gazette No. 116 of 19 September 2025, effective 1 January 2026). Rule 6(2): 10 per cent total regulatory capital. Rule 8(1): 3 per cent capital conservation buffer. Rule 9(1): CCyB at 0 to 2.5 per cent (currently 0 per cent per the October 2025 FSR). Directive 18(2) of the Banking and Financial Services (Computation of Credit Risk Weighted Assets) Directives, 2025 (Gazette Notice No. 1200 of 2025): 75 per cent risk weight for qualifying retail exposures. Directive 11(1) of the same: 0 per cent risk weight for kwacha-denominated GRZ claims. Rule 21 requires banks to prepare and publish information on capital and risk exposures as the Bank may determine. The Public Disclosure Directives are operationalised by Gazette Notice No. 1199 of 2025 (the Banking and Financial Services (Public Disclosure of Capital and Risk Exposures) Directives, 2025).
The country-specific adjustment reflects a pricing component that international banking groups routinely apply in emerging market jurisdictions, reflecting the sovereign credit environment, repatriation risk, and parent-entity capital allocation requirements, as documented in the FTP literature (Tumasyan, 2012). In the waterfall, it is derived as the residual: the difference between the observed rate (28.78 per cent) and the sum of the five observable or estimated layers (26.21 per cent). It absorbs the country risk charge (where explicitly priced by international subsidiaries), the loan liquidity premium, estimation error from the operating cost allocation and expected credit loss estimates, and any bank-specific pricing discretion. The sensitivity analysis (opex at 2.50, 3.50, or 4.50 per cent producing residuals of 3.57, 2.57, or 1.57 per cent) illustrates the range.
Kenya data: CBK benchmark rate path from a peak of 13.00 per cent, with easing beginning in August 2024, to 8.75 per cent (February 2026) sourced to CBK monetary policy decisions. Average commercial banks’ lending rate of 17.22 per cent in November 2024 sourced to CBK. January 2026 lending rate of 14.80 per cent sourced to CBK and KNBS. Bank-level pass-through data sourced to Business Daily reporting on CBK data (August 2024 to February 2025). The revised Risk-Based Credit Pricing Model (effective 1 September 2025 for new loans, 28 February 2026 for existing variable-rate loans) is sourced to the CBK final revised RBCPM (26 August 2025) and the DLA Piper Africa analysis (2025). Under the final RBCPM, banks are required to publish their weighted average lending rates, weighted average premium, and fees on the Total Cost of Credit website and on their own websites; the CBK publishes KESONIA daily. The Total Cost of Credit platform has been operated by the KBA in partnership with the CBK since 2017.
India: pass-through improvement from 11-19 basis points (Base Rate regime) to 26-47 basis points (MCLR regime) is from Chattopadhyay and Mitra (2023), “Monetary policy transmission in India under the base rate and MCLR regimes: a comparative study,” Humanities and Social Sciences Communications 10:408.
Asymmetric pricing: Hannan and Berger (1991), “The Rigidity of Prices: Evidence from the Banking Industry,” American Economic Review 81: 938-45. Neumark and Sharpe (1992), “Market Structure and the Nature of Price Rigidity: Evidence from the Market for Consumer Deposits,” Quarterly Journal of Economics 107: 657-80. Gambacorta (2008), “How Do Banks Set Interest Rates?” European Economic Review 52(5): 792-819.
Theoretical framework: Hirshleifer (1956) on opportunity cost; Tumasyan (2012) on funds transfer pricing; Ho and Saunders (1981) on the bank as dealer; Saunders and Schumacher (2000) on determinants of interest margins; Cottarelli and Kourelis (1994) on the speed of adjustment of lending rates; Mishra, Montiel, and Spilimbergo (2012) on monetary transmission in low-income countries.
Moody’s Caa2 rating with positive outlook was affirmed in April 2025. Zambia’s IMF Extended Credit Facility expired in January 2026 and was not renewed.
The non-retail margin data in Table 3 is sourced to the same BoZ Fortnightly Statistical Bulletin, Table 07, using the same observation dates and 21-day window methodology as Table 2. The non-retail (corporate) margin and lending rate are published alongside the retail data in Table 07 from March 2023 onward.
The government securities yield data in Table 4 is sourced to the BoZ Treasury Bill and Government Bond Auction Results. The 364-day T-bill yield is the most recent weekly auction observation at or before the MPC decision date. The 5-year government bond yield is the most recent auction cut-off yield. Where the Fortnightly Statistical Bulletin and the official auction results diverge, this table uses the auction cut-off yield as the primary source. The February 2024 5-year bond yield is sourced to GRZ Bond Auction No. 02/2024/BA (16 February 2024, cut-off 22.00 per cent) rather than the time series observation.
The Bank of Zambia publishes the Fortnightly Statistical Bulletin on a fortnightly cycle with a lag. The underlying data is collected and collated weekly. The 21-day observation window used in Tables 2 and 3 uses the weekly data within the fortnightly publication. The weighted average margin reported in Table 07 is aggregated across all retail loan products and tenors; there is no tenor-specific breakdown on the lending side of Table 07.
Disclaimer
This article does not constitute legal, financial, or investment advice. The author shares views for perspective and discussion only. Do not rely on them as a substitute for professional advice tailored to your specific circumstances. Always consult a qualified legal, financial, investment, or other professional adviser before making decisions based on this content. The analysis reflects proprietary research undertaken by Canary Compass and the author.
Canary Compass and the author accept no liability for actions taken or not taken based on the information in this article.
The views expressed in this article represent the author’s independent professional analysis and do not constitute an endorsement of any individual, institution, or position. Canary Compass and the author accept no responsibility for how this content is interpreted, excerpted, or recontextualised by third parties not involved in its production and publication. Reproducing any portion of this work in isolation, or in combination with other material, in a manner that misrepresents the author’s original meaning constitutes a distortion of the published record.
The author may hold positions in financial instruments, currencies, or assets discussed or referenced in this publication. Such positions do not constitute a recommendation to buy or sell.
All views, projections, and forecasts reflect the author’s assessment at the time of writing. Data sourced from third parties is believed to be reliable but has not been independently verified. Past performance does not indicate future results.
All content published by Canary Compass is the intellectual property of the author. Reproduction, adaptation, or redistribution, in whole or in part, requires written permission.
About the Author
Dean N. Onyambu is the Founder and Chief Editor of Canary Compass, a financial research publication focused on African monetary architecture and financial sovereignty. He brings 18 years of experience across trading, fund leadership, and economic policy, with senior roles at Standard Bank, First Capital Bank, and Opportunik Global Fund.
Read and subscribe at www.canarycompass.com.
The Canary Compass Channel is available on @CanaryCompassWhatsApp for economic and financial market updates on the go.
Canary Compass is also available on Facebook: @CanaryCompassFacebook.
For more insights from Dean, you can follow him on LinkedIn @DeanNOnyambu, X @InfinitelyDean, or Facebook @DeanNathanielOnyambu