
The 2026 Inflection
Part II of V: Pricing, Measurement, Capital

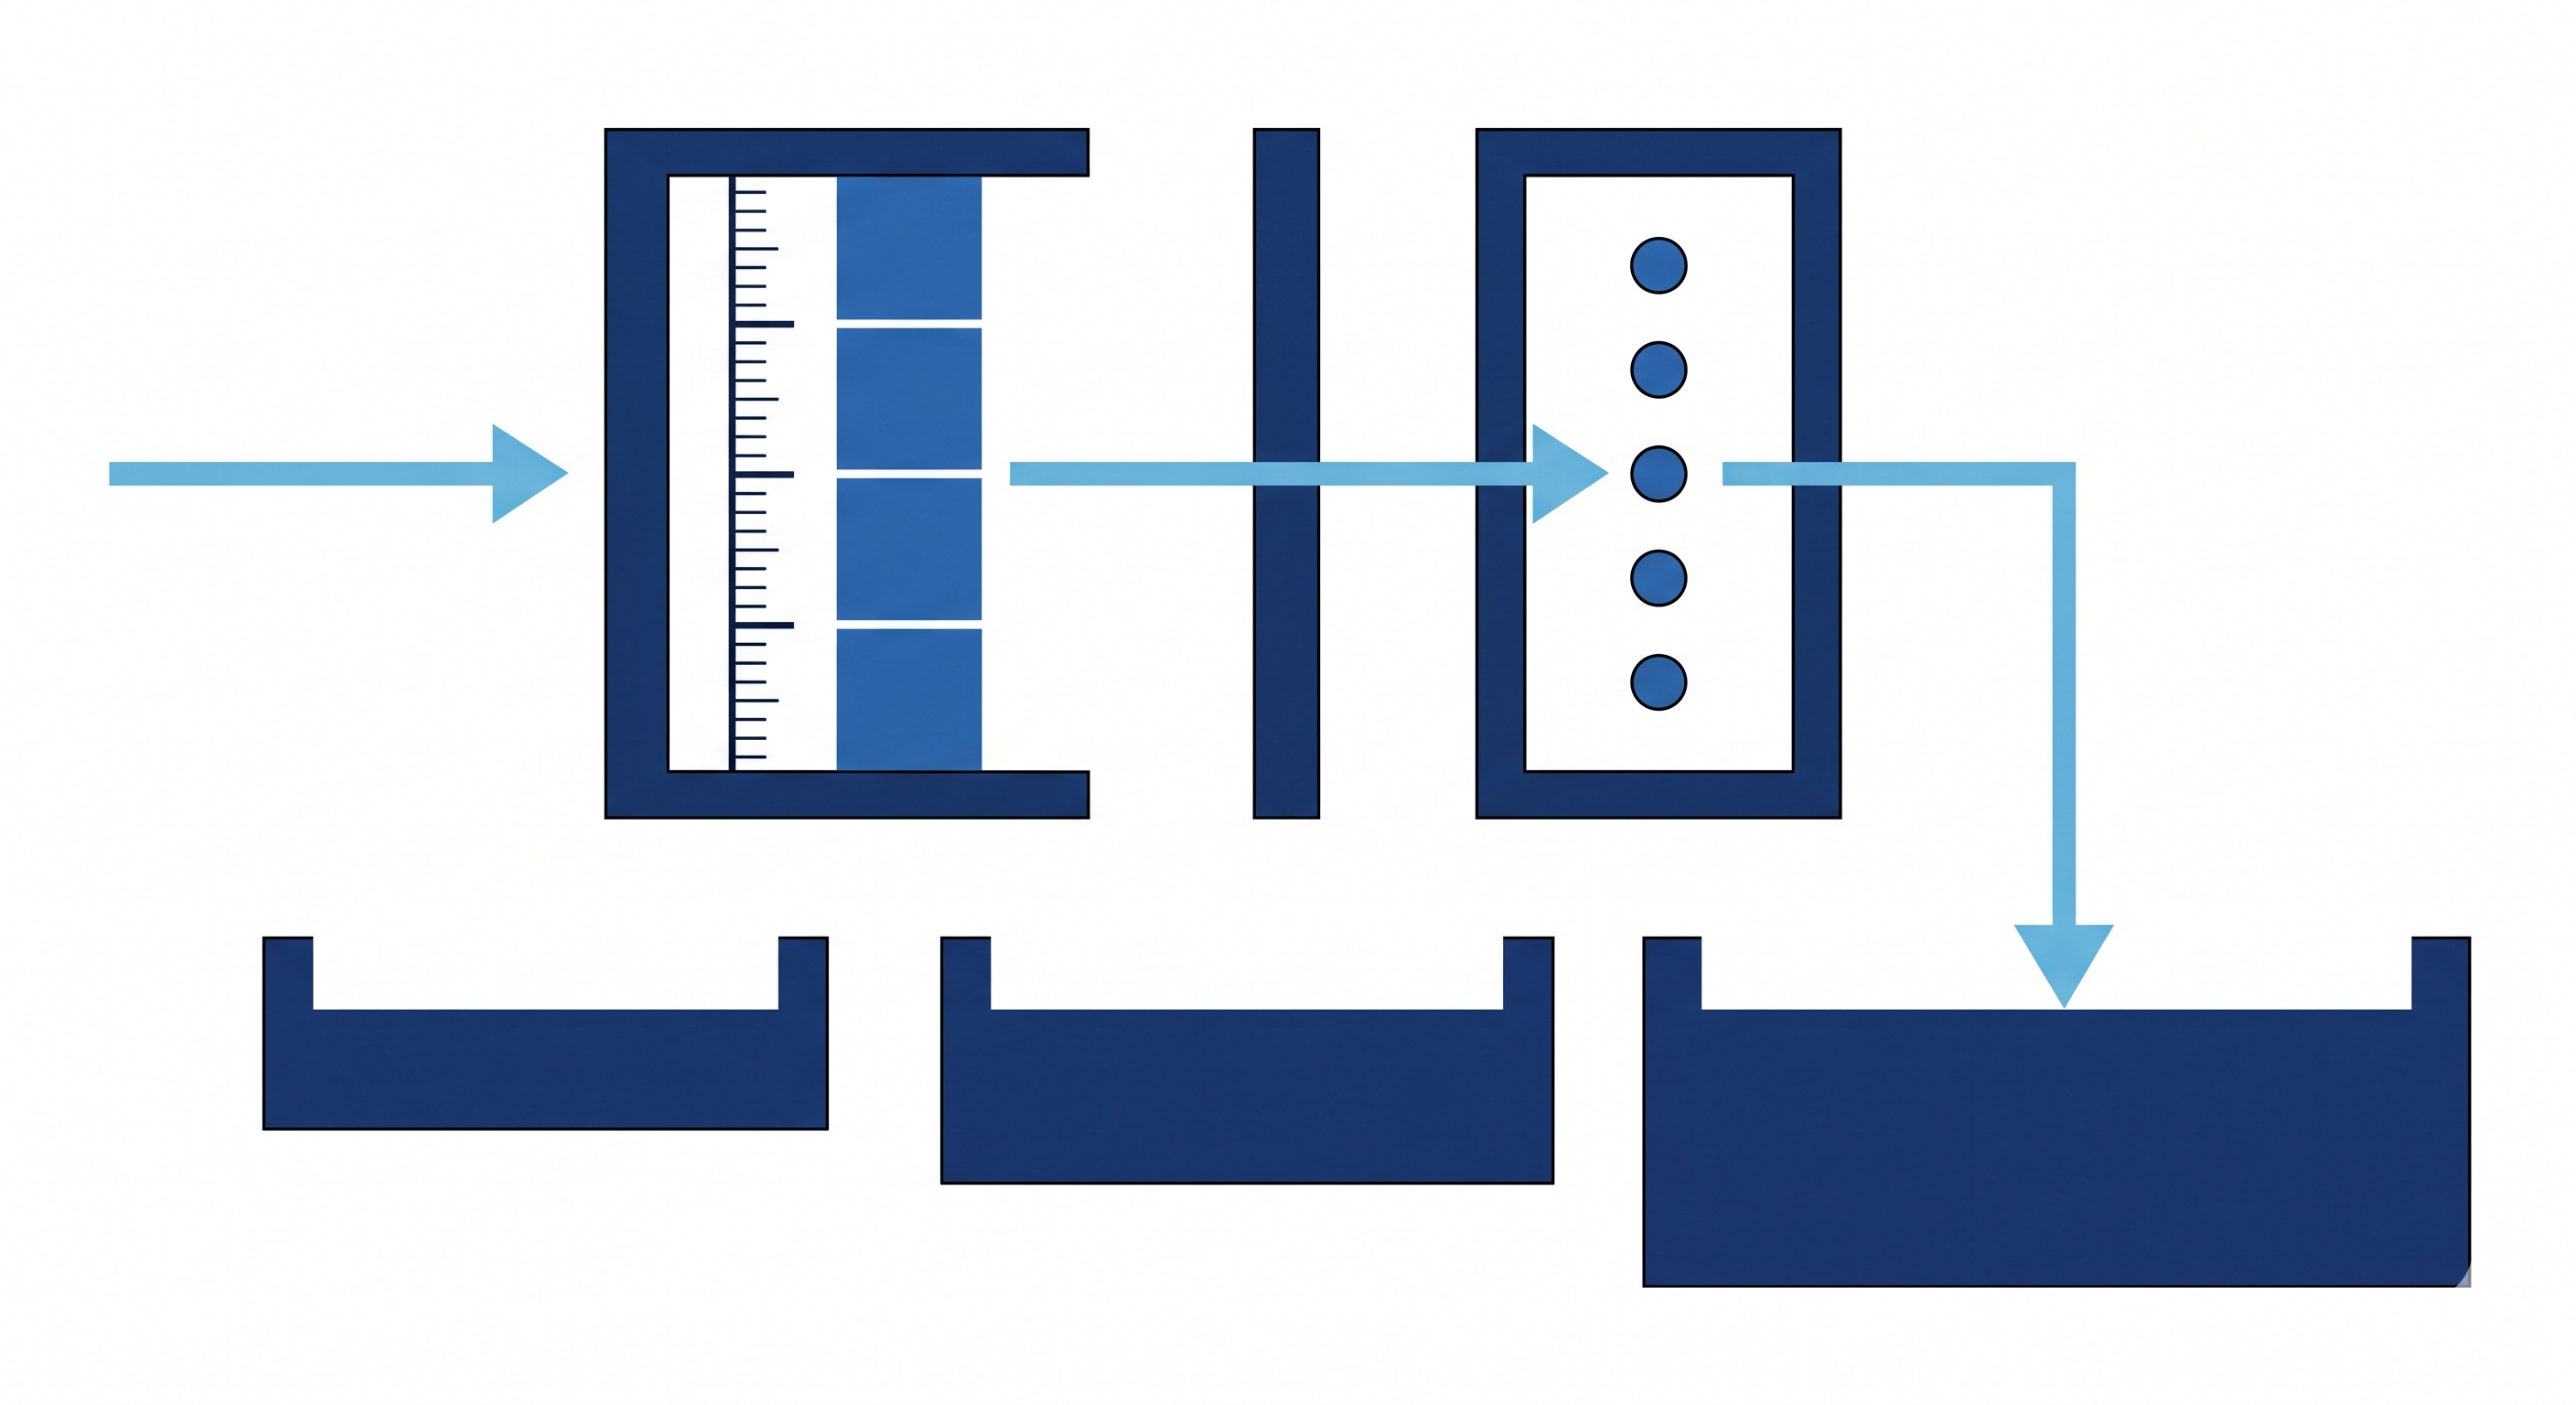
AI-generated Illustration: The two-gate filter and three-pool architecture. Gate One applies a locked fiscal metric uniformly across 55 AU members. Gate Two codifies five override triggers. Pool Three is the capital pool; Pool One and Pool Two are preconditions that move countries through the tiers.
The Canary Compass podcast is live on Spotify and YouTube. Tuesday episodes explore the week’s note from a different angle. Saturday episodes companion the Friday Reflection. Bonus episodes on Thursday when two notes publish in the same week.
0. Executive Summary
Sub-Saharan African sovereign issuers have paid 150 to 200 basis points more at issuance than their fundamentals justify in primary bond markets. The cost compounds across every issuance and represents at least USD5bn in additional interest on current outstanding bonds. The premium is not a grievance. It reflects the institutional capacity markets actually price: whether contracts hold through political cycles and whether fiscal systems absorb shocks without external supervision. African multilateral institutions that should lower the continent’s cost of capital, including Afreximbank, the Trade and Development Bank, and the Africa Finance Corporation, fund themselves in private markets at material spreads over comparable benchmarks, with the precise ranges varying by issuer, tenor, and rating class as earlier Canary Compass research documented (African Multilaterals, June 2025). Africa owns neither the outcomes-measurement layer that verifies capital deployment into productive enterprise nor the capital pool deep enough to set its margin.
This essay introduces the first layer of a capital architecture designed to close that gap. The filter built here is a locked fiscal metric applied uniformly across all 55 African Union members, with a two-gate system combining objective measurement with codified governance overrides. A tier structure determines which countries have earned the fiscal discipline that makes capital deployment safe. The filter is not the product. It is the gate. Part III builds what sits behind it: a four-level measurement engine. Level 1 grades government fiscal data through the confidence system set out below. Levels 2, 3, and 4 use real-time satellite, blockchain, and IoT verification as complementary layers, addressing the 12 to 24 month audit lag that makes public reporting too uneven to support live allocation on its own.
A note on the series. Part I was published in January 2026 and anticipated that Part II would test remittance cycle correlation and institutional research validation. The architecture that emerged demanded a different sequence: the filter must be built before it can be tested. The series is now five parts. Part I (Push, Pull, Friction) established the signal. This essay builds the filter. Part III (Screen, Score, Deploy) applies it across all 55 AU members and constructs the capital pools. Part IV (Hold, Absorb, Prove) addresses safeguards. Part V (Measure First) specifies the minimum viable product.
1. Three Gaps
Part I established the signal: three forces converging on a structural inflection. AI compressing the returns to labour that sustained Black Atlantic economic mobility. Social media collapsing the distance between diaspora and continent. And a structural absorption gap in the industries that could deploy returning capital into productive enterprise: agro-processing, energy, logistics, construction, water infrastructure, healthcare, digital infrastructure. The diaspora professional in London, whether fourth-generation African American or first-generation Nigerian immigrant, whose Vanguard index fund compounds on companies he has never visited. The entrepreneur considering Nairobi over Atlanta. The pension trustee allocating capital. They all face the same operational question Part I left unanswered. If diaspora capital were to flow into African enterprise, infrastructure, and sovereign instruments, what would price them, what would measure the underlying fiscal health, and which countries would earn access?
The existing frameworks do not yet provide a sufficiently Africa-specific, independently owned measurement layer. The information environment they produce is part of the problem.
Gbohoui, Ouedraogo, and Some, writing for the IMF in 2023, analysed 1,592 primary sovereign bond issuances from 89 countries between 2003 and 2021. After controlling for credit ratings, debt levels, GDP, reserves, and institutional quality, they found that Sub-Saharan African countries pay 150 to 200 basis points more at issuance than their fundamentals predict (IMF WP/23/130). Olabisi and Stein, extending their original study through 2022, find the premium persists at approximately 100 basis points. On current outstanding bonds, that represents at least USD5bn in additional interest unexplained by standard fundamentals (Journal of African Trade, 2024, Vol. 11).
Markets do not price fairness. They price the likelihood that contracts will be honoured through full political and economic cycles. Gbohoui et al. also find that the premium narrows substantially when structural factors, including budget transparency, informality, financial development, and institutional quality, are accounted for. That finding is not a refutation. It is a diagnosis. The premium reflects measurable structural conditions, not sentiment. Complaining about it changes nothing. Without the filter, capital allocators default to external assessments and the USD5bn on today’s bond stock compounds with every new issuance through the decade. Measuring those conditions, publishing the results, and creating incentives to improve them is the only path that moves the price. This is the argument I made in From Grievance to Design (Canary Compass, December 2025). This series builds the engine that article called for.
Measurement is where it begins. Africa’s interest-to-revenue burden, the share of government income consumed by the cost of past borrowing, produces two numbers depending on who is counting.
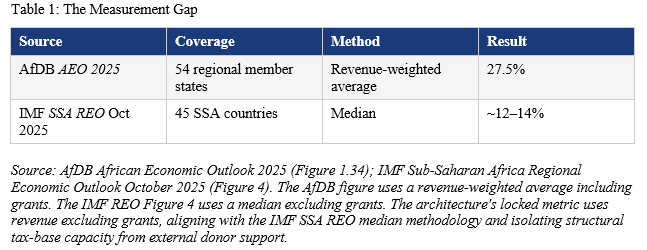
The near two-to-one gap is a statistical artefact with three causes: aggregation method (revenue-weighted average versus median), sample composition (all-Africa versus SSA-only), and the weight of high-ratio economies. Egypt reaches 84 per cent in FY2023/24 first ten months (IMF CR 24/274), but Kenya (~30 per cent), Nigeria at the federal level (~41 per cent), and Angola (~32 per cent) also pull the revenue-weighted average sharply higher. The IMF covers Egypt in its Middle East and Central Asia REO rather than its SSA sample, which accounts for part of the divergence between the two figures but does not eliminate it. Both methodologies are defensible. No single African institution currently produces a standardised, country-comparable, independently verified fiscal dataset that resolves this ambiguity.
The third gap is capital. Ratha and Mohapatra, writing for the World Bank in 2011, estimated African diaspora annual savings at approximately USD53bn, of which USD30.5bn from the Sub-Saharan African diaspora (Migration and Development Brief No. 14). No post-2020 academic update applying the same methodology exists. Remittances to Sub-Saharan Africa reached approximately USD54bn in 2023 (World Bank Migration and Development Brief No. 40) and are projected at roughly USD57 to 58bn in 2025 (KNOMAD); all-Africa flows are estimated to have crossed USD100bn in 2024 (World Bank/KNOMAD estimates). Remittances are flows to households rather than a stock of investable savings, so the 2011 figure is treated as an unchanged conservative floor rather than extrapolated forward. LemFi, a diaspora fintech founded in London, already processes USD1bn in monthly transactions across remittance corridors. The rails exist. The instruments that would convert diaspora savings into African productive assets at scale, with governance structures diaspora investors would trust, do not.
These three gaps are the architecture’s reason for existence. What follows is the engine: a locked fiscal definition, a two-gate system combining measurement with codified governance overrides, four tier bands that determine Pool Three access terms, and a migration mechanism that moves countries between tiers annually on published data.
2. The Locked Definition
Every figure in this architecture traces to a single metric applied uniformly across all 55 African Union members: gross interest payments divided by total government revenue excluding grants, on a central government basis. The architecture uses this ratio rather than the more familiar debt-to-GDP because debt stock is a balance sheet number while interest-to-revenue is a cash flow number. A government does not default because its debt is large. It defaults because it cannot service the debt from current income. Cash flow kills. Grants are excluded from the denominator to isolate structural tax-base capacity from external donor support outside the sovereign’s structural control. The ratio determines which tier a country occupies. The tier determines Pool Three access terms. Pool One and Pool Two are implemented by countries and jurisdictions independently of tier status; their implementation moves countries through the tiers by improving the fiscal indicators Gate One measures. Part III specifies all three layers; Part I set out the absorption industries into which deployment flows.
The choices embedded in that sentence matter.
Rwanda illustrates the calibration. Its ratio is 13.7 per cent excluding grants (11.6 per cent including grants). The excluding-grants figure governs tier assignment. Rwanda’s organic fiscal discipline is what secures Tier 1 Anchor status.
The central government basis is the default because that is the level at which most African sovereigns manage public debt and at which most IMF Article IV fiscal tables report. Where a material gap exists between central and consolidated government ratios, exceeding three percentage points, the architecture publishes both and specifies which governs pricing. The pricing input is always the level of government that holds the debt and would access the capital pools.
This matters most for Nigeria. IMF Country Report 25/157 publishes two fiscal tables. Table 4 covers the Federal Government alone, the entity that issues FGN bonds, Treasury bills, and Eurobonds. Table 5 covers consolidated general government (FGN plus 36 states, the FCT, and 774 LGAs). Federal interest-to-revenue is approximately 41 per cent (Table 4), placing Nigeria in Tier 4; consolidated interest-to-revenue is approximately 20.8 per cent (Table 5). The FGN holds approximately 92 per cent of total public debt; state and LGA revenue enters the consolidated denominator without proportional debt service. The architecture uses the federal basis because FGN is the entity that borrows, issues, and must service. The consolidated figure is published alongside as context.
The tier-determining ratio uses a three-year rolling average of the three most recent fiscal years available. Single-year figures are published as current indicators and inform quarterly monitoring but do not determine tier assignments. Single-year metrics destroy pricing stability: Angola’s ratio swings between 31.9 and 23.8 per cent on kwanza movements. The rolling average delivers predictable classifications for normal FX volatility. Acute shocks exceeding 25 per cent year-on-year trigger the FX liquidity circuit breaker under Gate Two, overriding the rolling average for interim reassessment.
Every figure carries a confidence grade (A, B, C, or X, from verified IMF fiscal table to no verifiable source) and a full source citation. Rwanda’s 13.7 per cent, for example, carries Grade A: extracted directly from IMF CR 25/319, page 8, fiscal table. A ratio derived algebraically from IMF aggregates carries Grade B. A ratio estimated from news sources where no current Article IV exists carries Grade C. Grade X applies where no verifiable fiscal data exists, including South Sudan in reporting-gap years, Sahrawi Arab Democratic Republic, and any country whose statistical system collapses in conflict. Grade X countries sit Below Floor until data resumes. During the data gap, the Canary Codex Lab provides technical assistance targeted at statistical capacity rebuilding, with a published pathway back to Tier 4 when verifiable data is restored. Territories outside the African Union, including Somaliland, fall outside scope by design. Source hierarchy: IMF Article IV fiscal tables, programme reviews, national budget documents, then World Bank and AfDB datasets. Part III publishes the complete verification chain.
3. Two Gates
A single locked metric applied without exception would be clean but dangerous. A country with a low interest ratio and a collapsing economy would receive anchor pricing. A country recovering from restructuring would be treated identically to a country that never defaulted. The architecture avoids both errors by operating as a two-gate system.
Gate One is the locked metric. It determines the baseline tier assignment for every country. It is objective, formula-driven, and universally applied. Four tiers, calibrated against the IMF SSA median of approximately 12 to 14 per cent, as set out in Table 2. Countries in fiscal distress or data opacity sit Below Floor, with no Pool Three access until their metrics improve to Tier 4 or better.
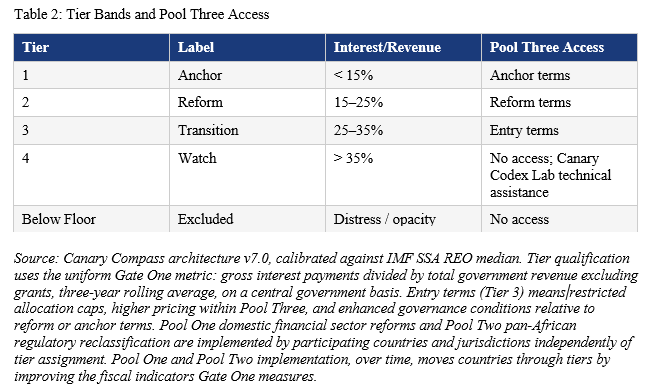
The Tier 1 ceiling at 15 per cent positions anchor pricing for countries whose interest burden sits near or below the continental median. These thresholds are institutional operating bands calibrated against the IMF SSA median, not econometric optima derived from a regression. The Phase One pilot will back-test the 15 per cent threshold against observed SSA default and stress events from 2000 to 2025, with results published transparently.
Each tier carries a governance discount, the reduction in borrowing cost that the architecture’s independent measurement and multi-country diversification are designed to produce. The discount is framed as a testable hypothesis. The literature on patriotic discounts (Ketkar and Ratha, 2010) supports 50 to 100 basis points under conditions of strong governance. Israel Bonds provide the strongest empirical anchor at 100 to 200 basis points below comparable sovereigns over multiple decades; India’s 1998 Resurgent India Bonds showed a more modest and less consistent discount, with the wider patriotic discount literature cautioning against cross-case generalisation. The Phase One pilot will test three scenarios: 100, 150, and 200 basis points. If the achievable discount falls below 100 basis points, the architecture’s value proposition narrows to measurement and transparency rather than pricing compression. That outcome is published transparently.
Consider what even the conservative scenario means. A pension fund manager in Nairobi allocating to Kenyan government securities sees instruments priced by the same external methodologies that produced the Africa premium. The Africa Credit Rating Agency, AU-sponsored and Mauritius-headquartered, is scheduled to issue its first sovereign ratings in June 2026, replicating the sovereign rating function under African ownership. The Canary Codex engine addresses a different layer. It is not a credit rating agency. It is a tiered fiscal filter bound to Pool Three access terms, measuring which African sovereigns have earned specific deployment conditions rather than pricing probability of default. AfCRA rates. The Canary Codex engine assigns access. The two are complementary. The measurement is the public good.
Gate Two is override and eligibility governance. Five codified triggers can modify a Gate One assignment.
The first is the fiscal fragility override. A country with interest-to-revenue below 15 per cent but exhibiting severe fragility receives a Tier 1 Conditional designation with restricted pool access until fragility indicators improve. The triggers are specific and any one is sufficient. Fiscal deficit exceeding 10 per cent of GDP for two consecutive years. IMF sovereign risk rating of High or In Distress. Reserve cover below three months of imports (IMF reserve adequacy benchmark). Tax-to-GDP ratio below 13 per cent, the IMF tax capacity tipping point above which sustained growth and state capacity durably improve (Gaspar, Jaramillo and Wingender, IMF WP/16/234). Data opacity preventing independent verification.
Algeria illustrates why the primary metric alone is insufficient. Algeria qualifies for Tier 1 with a ratio of approximately 1.8 to 3.0 per cent in FY2024/25 (IMF CR 25/270), one of the lowest on the continent. But Algeria’s fiscal deficit stands at 13.9 per cent of GDP, its sovereign risk rating is High, and hydrocarbon revenues are declining structurally. Anchor status on a low interest ratio while the fiscal position deteriorates would fail every investor looking past the headline. Algeria receives Tier 1 Conditional.
Ethiopia presents a different problem. Its interest-to-revenue ratio of approximately 9.5 per cent (IMF CR 25/188) also qualifies for Tier 1. The low ratio is real. But it appears to reflect concessional borrowing at sub-2 per cent average interest rates rather than fiscal discipline. Ethiopia’s tax-to-GDP ratio of 7 to 8 per cent is among the lowest globally, meaning even modest interest payments would consume a larger share if the debt portfolio shifted toward market rates. The fragility is in the revenue base, not the interest cost. Ethiopia receives Tier 1 Conditional until tax-to-GDP exceeds 13 per cent, aligned with the IMF tax capacity tipping point. The path out is specific: whichever trigger placed a country in Conditional governs exit, and meeting that trigger threshold for two consecutive annual assessments lifts the designation. The architecture tells countries exactly what they must fix and exactly when the restriction ends.
The second is the fiscal distress override, activated when total debt service, interest plus principal, exceeds 100 per cent of total government revenue regardless of the interest-only ratio. This trigger catches refinancing walls and bullet-maturity events that the primary metric alone misses. It is one mechanism for the architecture to say no to a country whose headline ratio looks workable but whose cash flow reality does not.
The third is a Watch Negative designation, activated when a country’s Gate One ratio is within Tier 1 but the underlying fiscal trajectory places the ratio above 15 per cent within five years. Botswana is Tier 1 on current data with an interest-to-revenue ratio of approximately 3 to 5 per cent, among the lowest on the continent. But diamond revenues are declining structurally, the fiscal deficit is projected at 9.3 per cent of GDP in FY2025/26 and 8.9 per cent in FY2026/27 (S&P, March 2026), and S&P downgraded the sovereign to BBB negative on 13 March 2026. Net debt is projected to reach 37.4 per cent of GDP by 2029 from a recent net asset position. The interest-to-revenue trajectory points toward the Tier 1/2 boundary by the end of the decade. Botswana carries Tier 1 Watch Negative, signalling that the classification is not permanent.
The fourth is emergency reclassification, activated upon sovereign default or restructuring announcement, IMF programme suspension for breach of quantitative performance criteria, or discovery of material fiscal misrepresentation. It requires a published determination by the measurement authority with full documentation. Senegal is the test case. Senegal’s interest-to-revenue ratio of approximately 19 to 22 per cent would place it in Tier 2 on the primary metric alone. The Court of Auditors revealed hidden borrowing initially estimated at USD7bn, subsequently expanded toward USD13bn. The IMF now shows total public sector debt at 132 per cent of GDP at end-2024 (IMF PR 25/360, 6 November 2025). The IMF Mission Chief for Senegal, Edward Gemayel, described the hidden debt as of a magnitude he had “never seen” in Africa. The USD1.8bn Extended Credit Facility was suspended in June 2024; S&P downgraded Senegal to CCC+ in November 2025. Senegal sits Below Floor under emergency reclassification despite being a WAEMU anchor. The arithmetic and the triggers admit no exception.
The fifth is the FX liquidity circuit breaker, activated when a sovereign experiences year-on-year cumulative currency depreciation exceeding 25 per cent against the weighted average of its external debt denominations. Acute FX collapses destroy hard-currency debt service capacity instantly, long before the three-year rolling average reflects the damage. The circuit breaker overrides the rolling average for interim reassessment within 90 days of the trigger event. Angola’s 2023 kwanza devaluation of approximately 39 per cent against the US dollar between May and June 2023 is the case reference. A shock of that magnitude would have triggered interim reassessment under this rule, separate from the normal year-to-year volatility the rolling average is designed to handle.
Gate Two overrides operate downward only. A country with a favourable Gate One assignment that exhibits fragility, trajectory risk, misreporting, or acute FX pressure receives a stricter designation. A country whose Gate One assignment already reflects a difficult fiscal position does not receive an upgrade. The architecture prices the arithmetic; it does not soften arithmetic outcomes through narrative context. Kenya’s Tier 3 position reflects the interest burden accumulated through sustained market-rate borrowing that Kenya has continued to service. Nigeria’s Tier 4 on the federal basis reflects FGN debt service reality on the entity that issues and must repay. Both countries move through tiers by improving the underlying arithmetic. Neither receives an upward override for structural context alone.
4. How the Engine Moves
Tiers are reassessed annually, using the most recent audited fiscal data, published simultaneously for all participating countries on a fixed date. African fiscal calendars are not synchronised. The annual reassessment uses the most recent completed fiscal year for each country. The architecture publishes what is available, grades its confidence, and updates as new data arrives. Where a country’s most recent audited fiscal data is older than 24 months, the confidence grade drops one band and the tier assignment carries a Watch designation until current data is published. This staleness penalty incentivises rapid financial reporting and prevents prolonged audit lag from masking deterioration. Quarterly monitoring indicators signal trajectory but do not trigger tier migration between annual reassessments.
Countries exiting debt restructuring present a specific problem. During grace periods, a country may exhibit an artificially low interest burden because restructured instruments have not yet stepped up to market-rate coupons. Kenya’s interest-to-revenue ratio sits in the Tier 3 range, servicing a heavy burden at significant fiscal cost. Zambia, post-restructuring under the G20 Common Framework, shows a materially lower near-term service burden (IMF CR 25/225), with the interest-only component lower still. On the primary metric, post-restructuring Zambia sits closer to Tier 1 while Kenya sits in Tier 3. Investors may reasonably prefer Zambia’s clean slate. But the clean slate reflects concessional grace period terms that will escalate when coupon step-ups activate through 2028-2031. Without a fairness mechanism, the architecture would assign Zambia anchor pricing on temporary terms and then violently reclassify it when those terms reset.
The architecture applies a three-year smoothing adjustment. In the first year following restructuring, the tier assignment blends the current ratio at 40 per cent with the pre-restructuring ratio at 60 per cent. Year two shifts to 70/30. Year three returns to 100 per cent current data. The three-year window tracks typical coupon step-up schedules in Common Framework and London Club restructurings, where concessional terms generally expire within that horizon. The weights approximate the net present value of step-up coupons over a typical Common Framework restructuring profile; this recognises that headline ratios during grace periods misstate the true service burden. Weights are fixed ex ante and published before the first annual reassessment; if the Phase One pilot demonstrates recalibration is needed, any revision is published before implementation. The smoothing ensures that countries which stretched to honour their obligations are not penalised relative to countries that did not. Ghana receives identical treatment.
5. What the Engine Is
A question this invites: why fiscal as the gate? Enterprises and projects vary enormously in performance within any sovereign. The answer is that the filter governs the deployment environment, not project selection. A high-performing enterprise in a sovereign facing fiscal distress sees returns extracted through capital controls, emergency taxation, FX restrictions, or payment freezes long before operating performance matters. The sovereign filter defines the envelope within which project-level selection becomes meaningful. Levels 2 and 3, which track deployment and sectoral absorption, operate inside that envelope, not as a substitute for it.
The filter does not guarantee absorption. A country can qualify for Tier 1 on the fiscal metric while its financial sector remains shallow, dollarised, or concentrated in sovereign exposure. Pool Three eligibility is preserved at the tier level, but realised allocation depends on the absorption capacity that Pool One domestic financial sector reforms build over time. A Tier 1 country with deep private credit markets, extended tenor structure, and working collateral infrastructure can absorb Pool Three flows at scale. A Tier 1 country without these conditions cannot. Fiscal discipline is the gate. Absorption capacity is what determines how much the gate admits.
Tiered access mechanisms exist. IDA graduation, the IMF’s PRGT and GRA windows, AfDB pricing, and EU Structural Funds all use differentiated access on development metrics. What is new in this architecture is not the tiering but what the tiers unlock.
The tier system built in this essay is Level 1 of a four-level measurement engine. Level 1 measures sovereign creditworthiness: the fiscal filter. Part III builds the remaining three levels. Level 2 measures what borrowed capital actually builds, verified through satellite imagery and blockchain-tracked deployment alongside government self-reporting. Level 3 measures whether capital reaches the absorption industries Part I identified. Level 4 measures whether deployed capital strengthens household balance sheets: youth employment, land title registration, financial inclusion, income diversification, enterprise formation. Mainstream sovereign risk frameworks, including S&P, Moody’s, and Fitch methodologies and the IMF DSA and AfDB sovereign assessment framework, rate instruments at issuance on fiscal and institutional variables. Part II’s Level 1 fiscal filter operates in that space and contributes confidence-graded African-owned verification, the Productive Asset Discount, and codified Gate Two overrides. Levels 2, 3, and 4, built in Part III, extend the architecture beyond rating at issuance into outcomes-conditional pricing across staged Pool Three tranches. Subsequent tranche terms reflect prior-tranche verification: Level 2 confirms what capital built, Level 3 confirms whether it reached the absorption industries Part I identified, Level 4 confirms household impact including youth employment, financial inclusion, land title, and enterprise formation. Pricing moves with verified outcomes rather than with promises at issuance. This is not a rating function. It is a capital deployment architecture that prices sovereigns differently depending on what their prior borrowing actually achieved. That mechanism is the architecture’s distinctive contribution relative to both mainstream frameworks and AfCRA, and it is what distinguishes this work from a repackaging of IMF fiscal tables under African ownership.
Two uniform refinements extend the locked Gate One definition. They are not price adjustments. They are shaping mechanisms. The architecture uses pricing to change how sovereigns borrow, not only to assess how they have borrowed.
The first is a Productive Asset Discount. Mainstream sovereign risk frameworks address the productive-versus-consumptive distinction qualitatively; the PAD operationalises it in pricing. Interest tied to verified self-liquidating revenue-generating assets is discounted from the Gate One ratio. A sovereign borrowing to build a revenue-generating port or energy asset is not pricing-equivalent to one borrowing to fund recurrent expenditure. Sovereigns seeking Anchor terms have a direct structural incentive to borrow productively. The pricing mechanism shapes the borrowing.
Phase One operates in beta form. The beta does not accept the blunt IMF Article IV capital expenditure classification, which groups a non-revenue-generating parliament building with a self-liquidating toll road under the same CapEx line. It requires project-level verification through national audit office classifications or equivalent African development finance institution project assessments. The discount applies only where the underlying debt has ring-fenced revenue accounts, audited cash flow segregation, and covenant-protected servicing tied to the specific asset’s revenue stream. The empirical record on ring-fencing in African sovereigns is uneven: Chad’s 2000s oil revenue framework and Ghana’s Petroleum Revenue Management Act both show how political override can erode integrity in practice. Level 2 satellite verification and Level 3 blockchain tracking in Phase Two upgrade the detection layer.
The second refinement is a denomination weighting. Hard-currency interest carries heavier weight than local-currency interest, because a central bank can theoretically monetise domestic obligations in ways it cannot with external hard-currency debt. Denomination weighting follows the Phase One pilot.
Five elements combine that do not elsewhere: a locked sovereign fiscal gate applied across 55 AU members, confidence-graded African-owned verification, real-time deployment and household-outcome tracking across Levels 2 through 4, a productive-versus-consumptive debt distinction via the Productive Asset Discount with ring-fencing conditions, and a measurement-plus-incentive architecture binding domestic reform to Pool Three access under mission-oriented governance. Each element has prior art. The integration does not.
Part I’s central claim demands this filter. The return pathway must be enterprise-led. A continent adding over 150 million to its working-age population by 2030 needs diaspora members as enterprise builders in countries whose fiscal discipline creates space for productive investment. The filter identifies which countries have earned that space. The strategic question, as Part I argued, is no longer which jobs to seek but which productive assets to own.
When applied continent-wide, as Part III does in full, the engine produces uncomfortable results. Fewer than a third of the 55 members qualify for Tier 1 Anchor on the uniform excluding-grants metric, and several of those carry Conditional or Watch designations. Nigeria, the continent’s largest economy, sits in Tier 4 on the federal government basis that governs its pricing. Egypt, at 84 per cent in FY2023/24, is the continental outlier by a factor of six. Senegal, a WAEMU anchor, is Below Floor. The engine says what the locked definition produces when applied uniformly.
The measurement is a public good. This requires institutional form. The measurement authority is structured as an African-sponsored independent entity. Political mandate sits with the AU Specialized Technical Committee on Finance, Monetary Affairs, Economic Planning and Integration; the AfCFTA Secretariat provides convening support on trade-adjacent questions but does not co-own technical governance. The board is nominated by African development finance institutions, African research institutions, and private-sector representatives, with technical governance separate from direct AU supervision. Funding is African-sourced by design: anchor commitments from African DFIs, secondary contributions from African institutional investors, and subscription revenue from African financial institutions using the framework. External non-African donor funding is excluded to preserve independence from external policy conditionality. Methodology, source citations, and confidence grades are published openly under a permissive public licence. Sovereigns hold the right of appeal with reasoned response, methodology changes require notice and a consultation window, and the authority is externally audited annually. These provisions make the architecture durable across political cycles.
This is not the development model. It is the fiscal and governance gate inside a wider mission-oriented African capital platform. Part III specifies the pools that deploy into the absorption industries Part I identified. Part IV addresses safeguards. Part V specifies the minimum viable product. Together these parts define the missions, reciprocal conditions on deployed capital, public value capture mechanisms, and state capability building. The filter clears fiscal space. The mission work fills it.
The architecture does not argue that Africa is mispriced and deserves better. It builds the measurement system, publishes the results, and lets the pricing follow. Countries that fail the metric are excluded by arithmetic, not by editorial choice. Structure before sentiment.
6. What Comes Next
Part III applies the filter across the 55, constructs the three capital pools, and takes up the deployment question. The absorption universe Part I opened is being refined through parallel workstreams. The Mineral Trilogy maps Africa’s position in the critical minerals value chain and the non-extractive manufacturing path that sits alongside it, beginning with Forced Choice on coalition logic. The Misaligned Transition disaggregates energy into firm and variable components and takes up the financing architecture behind each, previewed in EVs Are the Last Mile, Not the First. Part III inherits the taxonomy these workstreams develop.
Part III also constructs the three capital layers. The structure is asymmetric. Pool Three is the architecture’s capital pool in the conventional sense. Diaspora capital sits outside African sovereign regulatory reach, and a vehicle that channels it into productive enterprise brings new capital into African deployment. Pool Three operates through a two-strand framework and a coalition of the eligible governing diaspora capital access. It starts with a Phase One vehicle and scales to the African Diaspora Reserve over Phase Two and Three. Pool One and Pool Two are not capital pools in this sense. They are preconditions. Pool One is a programme of domestic financial sector reforms drawing on the Structure Before Sentiment series, combined with a measurement layer that publishes country-comparable indicators of capital market structure. Its policy toolkit overlaps with established IMF, World Bank, and AfDB recommendations; its distinctive contribution is measurement, incentive architecture, and African institutional ownership. Pool Two is a regulatory reclassification mechanism. It shifts pan-African institutional capital, a pension and insurance base of roughly USD775bn (OECD/AFC 2025), from ‘foreign’ to ‘pan-African’ classification in allocation caps. Bicameral governance and sub-regional corridor phasing structure the reclassification. Phase One mobilisation potential, at regulatory ceilings around 5 per cent, sits in the order of USD30 to 40bn across eligible jurisdictions. Parts IV and V address safeguards and specify the minimum viable product.
The filter is built. Part III puts it to work.
The 2026 Outlook continues in Part III: Screen, Score, Deploy
Sources
Sources: IMF WP/23/130 (Gbohoui, Ouedraogo, and Some 2023), Journal of African Trade Vol. 11 (Olabisi and Stein 2024), AfDB African Economic Outlook 2025, IMF Sub-Saharan Africa Regional Economic Outlook October 2025, World Bank Migration and Development Brief No. 14 (Ratha and Mohapatra 2011), World Bank Migration and Development Brief No. 40, KNOMAD 2025 remittance projections, DMO Nigeria Annual Report 2024, IMF Country Reports (CR 24/316 Kenya, CR 25/157 Nigeria, CR 25/188 Ethiopia, CR 25/189 Ethiopia Selected Issues, CR 25/225 Zambia, CR 25/270 Algeria, CR 25/319 Rwanda, CR 24/274 Egypt), IMF Selected Issues Paper 2025/108 (Hegab, Ethiopia’s Tax System), IMF Press Release 25/360 (Senegal, 6 November 2025) and RFI interview with IMF Mission Chief Edward Gemayel, 6 November 2025, OECD and Africa Finance Corporation, Institutional Investment in Africa (2025), Ketkar and Ratha (2010) on diaspora bond discounts, diaspora bond empirical precedents (Israel Bonds; Resurgent India Bonds 1998), S&P Global Ratings (March 2026 Botswana sovereign action; November 2025 Senegal sovereign action), Banco Nacional de Angola 2023 exchange rate data, Canary Compass architecture v7.0, From Grievance to Design (Canary Compass, December 2025), Forced Choice (Canary Compass, Mineral Trilogy Part I), EVs Are the Last Mile, Not the First (Canary Compass, December 2025), Structure Before Sentiment series Parts 1-4 (Canary Compass, November-December 2025).
Disclaimer
This article does not constitute legal, financial, or investment advice. The author shares views for perspective and discussion only. Do not rely on them as a substitute for professional advice tailored to your specific circumstances. Always consult a qualified legal, financial, investment, or other professional adviser before making decisions based on this content. The analysis reflects proprietary research undertaken by Canary Compass and the author.
Canary Compass and the author accept no liability for actions taken or not taken based on the information in this article.
The views expressed in this article represent the author’s independent professional analysis and do not constitute an endorsement of any individual, institution, or position. Canary Compass and the author accept no responsibility for how this content is interpreted, excerpted, or recontextualised by third parties not involved in its production and publication. Reproducing any portion of this work in isolation, or in combination with other material, in a manner that misrepresents the author’s original meaning constitutes a distortion of the published record.
The author may hold positions in financial instruments, currencies, or assets discussed or referenced in this publication. Such positions do not constitute a recommendation to buy or sell.
All views, projections, and forecasts reflect the author’s assessment at the time of writing. Data sourced from third parties is believed to be reliable but has not been independently verified. Past performance does not indicate future results.
All content published by Canary Compass is the intellectual property of the author. Reproduction, adaptation, or redistribution, in whole or in part, requires written permission.
About the Author
Dean N. Onyambu is the Founder and Chief Editor of Canary Compass, a financial research publication focused on African monetary architecture and financial sovereignty. He brings 18 years of experience across trading, fund leadership, and economic policy, with senior roles at Standard Bank, First Capital Bank, and Opportunik Global Fund.
Read and subscribe at www.canarycompass.com.
The Canary Compass Channel is available on @CanaryCompassWhatsApp for economic and financial market updates on the go.
For more insights from Dean, you can follow him on LinkedIn @DeanNOnyambu or X @InfinitelyDean.