

AI-generated image: The chain runs to the port and stops. The empty stages are the argument.
The Mineral Trilogy examines Africa’s position in critical mineral supply chains at the molecular level. Article 1, The Forced Choice (February 2026), established the policy architecture. Its pillars: the distinction between absorber economies that can purchase African manufactures and surplus economies whose industries compete for the same markets, the dual-track supply framework, the Coalition of the Eligible, and the five to seven year leverage window. This article grounds that architecture mineral by mineral, stage by stage. Article 3, Beyond the Cathode (forthcoming), names the destination beyond critical minerals.
Africa’s mineral leverage is real but uneven. South Africa alone holds approximately 83 per cent of reported global platinum group metal reserves, a world total USGS tabulates as a minimum, concentrated in the Bushveld Complex (USGS, 2026). The African share rises to roughly 85 per cent with Zimbabwe included. The DRC accounts for roughly three-quarters of mined cobalt output and about half of global cobalt reserves. Southern Africa holds major manganese and chromium resources, though reserve shares depend on classification methodology. Copper reserves are smaller, at roughly 10 to 12 per cent of the global total on current USGS data. African production nonetheless accounts for roughly one fifth of global output, about 19 per cent on 2025 data (Onyambu, 2026a).
The grade story sits in the DRC: Kamoa-Kakula’s updated reserve grades 2.82 per cent copper, and DRC operations commonly run 2 to 3 per cent, against a global average of 0.5 to 0.7. The Forced Choice described Zambian grades as exceptionally high. That holds on the classic Copperbelt ore bodies: KCM averages 2.9 per cent copper, reaching 3.3 at the Konkola Deep Mine, and it is also the operationally troubled exception, its ramp-up only now under way (CopperTech, 2025). The North-Western province mines that now carry most Zambian output, Sentinel, Lumwana, and Kansanshi, run at roughly 0.5 to 0.9 per cent on their own reserve statements, at or near the world average. The continent’s grade advantage is a Congolese fact. The rest is arithmetic. Richer ore yields more copper per tonne mined at lower cost, expansion capital follows that arithmetic, and the DRC now mines more than three times Zambia’s volume.
Geology is not the whole story. Zambia’s mining tax regime changed on average every 18 months from 2001 (Zambia Chamber of Mines, 2018). The 2014-15 royalty regime was reversed within months of enactment, though not before Barrick had moved to suspend Lumwana over it. The churn eroded trust between state and industry, and the decade closed with the KCM liquidation and Mopani’s forced sale (UNU-WIDER, 2021). The copper section carries the operational consequences. Where current data revises The Forced Choice’s vintages, this essay states the revision in one place. PGM reserve shares run higher, roughly 85 against its 79 per cent. Cobalt reserve estimates now span 50 to 55 per cent against its 55. Copper reserves read 10 to 12 per cent against its 6 to 9, with USGS 2026 carrying the DRC alone at 80 million tonnes of a roughly 1 billion tonne world total. One framework refinement travels with the data. The Forced Choice defined absorbers by persistent external deficits. This essay defines them by demonstrated absorption of manufactured imports, a test the EU passes on its China goods deficit despite an overall external surplus, and the UK passes alongside it.
The Forced Choice drew a structural distinction between absorber economies and surplus economies. Absorber economies (the United States, the European Union, the United Kingdom) are the markets that absorb the world’s manufactured surplus, including China’s. The United States runs persistent current account deficits with household consumption at 68 per cent of GDP. The European Union runs an external surplus overall yet absorbs manufactured imports at scale, carrying a goods deficit with China alone of roughly EUR 360 billion in 2025 (Eurostat, 2026). The capacity that matters is absorption: these markets demonstrably take in other economies’ manufactures, because they already take in China’s. Surplus economies (principally China) produce more than they consume. They can and do import manufactured goods, but their domestic industries compete for the same export markets, making them structurally unreliable as primary absorbers of African industrial output at scale. Africa sits upstream of both, supplying raw material to whoever pays (Onyambu, 2026a). This essay traces what happens to that raw material after it leaves, and asks whether the extractive lane can deliver industrial transformation regardless of which partner buys at the other end.
The political discourse that measures progress by refining stage, and the popular narrative that treats cathode as an achievement, is measuring the wrong distance. Institutional documents from the AU and SADC acknowledge the distinction between beneficiation and manufacturing. The gap is not in the documents but in the operational decisions: corridor investments, processing incentives, and bilateral agreements that treat intermediate output as the destination. This essay grounds the claim mineral by mineral.
This essay follows five minerals through their complete journey: the metallurgical chain where refining occurs, and the manufacturing chain where value multiplies. It traces each mineral from the point Africa exits the chain through the stages that follow, to the finished good that returns to the continent as an import. The pattern that emerges is consistent across all five. The exit points differ. The failure mechanisms differ. The economic outcome does not.
A note on naming. This essay identifies owners by domicile because the stage is the variable under examination, not the flag holding it. Chinese firms appear most often for an arithmetical reason: the surplus economy holds more of the stages African minerals cross than anyone else. Where the stage is held from Madrid or Johannesburg, or the anode lands in Belgium, the same test applies, and the pages that follow apply it. The critique is positional. Whoever stands on the value-capturing stage draws it.
1. Five Minerals, Five Chains
Copper
Copper follows two processing routes in Africa, and the distinction matters.
The sulphide route (Zambia). The Zambian Copperbelt is predominantly a sulphide province at depth. The sulphide ores carry chalcopyrite, bornite, and chalcocite in varying proportions across the classic Copperbelt deposits (Konkola, Nchanga, Nkana, Mufulira) (Onyambu, 2026b). The North-Western majors that now lead Zambian output are sulphide operations too: Sentinel and Lumwana mine chalcopyrite-dominant sulphide ore and ship flotation concentrate into the same smelting route, while Kansanshi processes three ore types including oxide (NI 43-101 technical reports). Processing runs: sulphide ore → crushing and grinding → flotation → concentrate at roughly 25 to 30 per cent copper → smelting in flash or top-submerged lance furnaces at roughly 1,200 to 1,300 degrees Celsius, yielding blister at approximately 98.5 per cent plus sulphur dioxide, captured and converted to sulphuric acid through the contact process → fire refining to anode at roughly 99.5 per cent → electrolytic refining to cathode at 99.99 per cent. Every one of these smelting circuits captures its sulphur dioxide off-gas as sulphuric acid; the regional acid ledger is taken up with the oxide route below, where the acid is consumed.
Zambia’s output varies by mine and by year. Lumwana, First Quantum operations, and several other producers moved concentrate under temporary export allocations during the 2025-26 smelter disruptions. Mopani and KCM carry the chain to cathode where refinery capacity exists. But Zambia’s operational electrolytic refining capacity is concentrated in a small number of facilities. Their combined throughput falls short of the anode the smelters produce (Zambia Chamber of Mines, 2017; consistent with the 2025-26 waiver record).
The refining gap is structural, not energetic. Electrorefining is the least power-hungry stage in the chain, at roughly 300 to 400 kWh per tonne against 2,000 or more for electrowinning. The gap has three causes. Kansanshi, the largest smelter, was configured without an anode refinery, so its anode exports by design. The Chambishi copper smelter sends its blister and anode to its parent group’s refineries in China, an ownership decision rather than a capacity constraint. And the legacy tankhouses at Mufulira and Nkana decayed through two decades of ownership churn and underinvestment, so operational availability, not nameplate, is what collapsed. At a zero TC/RC benchmark, new refining capacity cannot pay for itself on processing fees; the investment case rests on byproduct capture and premiums. Power gates the expansion. It does not explain the existing gap.
Smelter outages forced the government to introduce a duty-free concentrate export waiver in August 2025, extended in June 2026 to cover 271,742 tonnes across several producers (Reuters, June 2026). Zambia produced a record 890,346 tonnes of copper in 2025 on the final count, up 8 per cent on the year (Reuters, January and June 2026). Exports tracked close to that level as a mix of cathode and anode. Customs data put anode and unrefined copper at roughly three-quarters of copper export value in 2022 and 2023 (UN Comtrade). The 2025-26 smelter disruptions pushed that dominance further down the chain rather than up it, with concentrate joining the outflow under waiver. Export figures also carry copper of DRC origin, processed in or transiting through Zambian facilities as concentrate and blister alongside domestic ore, so exported volumes can exceed domestic mine output in a given year.
The step from anode to cathode is where the refining margin is supposed to sit. For decades, treatment and refining charges (TC/RCs) paid smelters and refiners for that step. That cycle has inverted. The 2026 annual benchmark settled at zero for the first time on record, and spot terms turned negative (IEA, 2026; Onyambu, 2026b). When the processing fee is zero, the value inside the concentrate becomes the entire commercial question. Smelters increasingly survive on what the fee never priced: gold, silver, and sulphuric acid. Byproduct assay, recovery, and sale terms are no longer a secondary consideration. They are the margin. An assay is the laboratory measurement of what a material contains and in what concentrations. The cycle will turn; the structural point will not. Domestic refining captures information, byproduct optionality, and industrial capability that concentrate and anode export surrender, wherever the cycle sits. And both anode and cathode remain inputs to a manufacturing chain that begins after the point Africa exits.
At the electrolytic refining stage, anode slime settles at the bottom of the refining cell. Slime is not slag: slag forms at the smelter, slime forms only here, when the anode dissolves and its insolubles drop. It can contain gold, silver, platinum group metals, selenium, tellurium, and other trace elements, but composition varies sharply by ore body and refinery feed. Technical literature puts slime yields at roughly 0.2 to 0.8 per cent of refined copper output (Hait, Jana and Sanyal, 2009). The commercially relevant point is not a single global average. It is control of assay, recovery, and sale. At Konkola Copper Mines in Zambia, estimates range from roughly 1 tonne of slime per 200 tonnes of anode to 1 per 450 on more recent KCM-specific figures (Metal Bulletin, 2018; UNZA, 2023; 2024 market estimates). Reported average value at the time ran near USD 33,000 per tonne. Quantity and value move materially with assay, metal prices, and payable terms. Zambia-specific assay data at mine level is not publicly available for most operations, which is itself part of the argument: the quantification of what leaves happens at the refinery.
And the slime itself does not stay. Where Zambia refines to cathode domestically, the slime is generated on Zambian soil, then exported under long-term contracts for third-party precious metal recovery, principally to South Africa. The export has a structural reason. Refining copper and refining slime are different industries: the tankhouse ends copper’s chain, while recovering gold, silver, and PGMs from slime requires a precious metals refinery, with its own furnaces, chemistry, security regime, and scale. At a tonne of slime per 200 tonnes of anode, Zambian volumes sit below the scale such a plant wants. Zambia planned exactly that plant near Ndola in the mid-1970s, sized at 1,300 to 1,500 tonnes a year; it never sustained (US Bureau of Mines, 1974). So the slime travels to where the industry exists, and Rand Refinery’s integrated complex lists copper anode slimes among the feeds its smelter treats (Rand Refinery, 2026). Zambia captures the slime sale price and the assay information. The final recovery and refining margin leaves with the slime. Where anode exits for offshore refining, even the assay and the sale decision move with the buyer. The truncation runs one stage deeper than the cathode.
The gold that leaves in copper anode slime is the same gold that African central banks are now trying to accumulate through domestic purchasing programmes. Tanzania requires 20 per cent of gold exports sold to the central bank. Ghana raised mandatory state purchases from large-scale miners to 30 per cent, effective 1 July 2026, applied to gold in doré form. That last detail is the point. These programmes reach gold the state can see and assay as gold. The gold in exported anode slime is classified as a copper byproduct, assayed by the buyer, and recovered into metal only after it leaves. It sits outside their reach not by oversight but by design of the export itself.
Africa is not entirely absent after cathode. Zamefa (Metal Fabricators of Zambia), whose ultimate parent is Reunert of Johannesburg, produces copper wire rod and cable domestically (Zamefa, 2026). South Africa has pockets of downstream copper fabrication. But these are exceptions at insufficient scale. Three numbers fix the scale, and each measures a different thing. Africa mined approximately 4.5 million tonnes of copper in 2025. African refineries produced 3.1 million tonnes of cathode, the refined copper this chain has been following. And African fabricators consumed approximately 193,400 tonnes of that refined copper to make things on African soil (ICSG Table 2, May 2026 update). The consumption figure counts cathode entering formal fabrication channels, not refinery output and not copper inside imported finished goods, and it likely understates the true total by excluding scrap, recycled copper, and informal usage. Even on the formal measure, the ratio holds: Africa consumed roughly 4 per cent of what it mined and about 6 per cent of what it refined. The downstream fabrication that exists processes a fraction of continental output. The question the conservation section returns to is direct: whose electrification does African copper serve?
The oxide route (DRC). The Katanga operations sit on large oxide deposits: malachite, chrysocolla, cupriferous goethite. These are not smelted but leached. Processing runs: oxide ore → sulphuric acid leaching → solvent extraction → electrowinning → cathode at 99.99 per cent. No smelting. No anode stage. No electrorefining anode slime. DRC oxide operations do recover cobalt, nickel, and manganese from SX-EW bleed streams, and that byproduct value is covered in the cobalt section below. The anode slime comparison applies to copper-specific precious metals: gold, silver, PGMs, selenium, and tellurium. These leave with the anode where sulphide copper is exported without domestic refining.
The acid economy binds the two routes together. DRC oxide operations are acid consumers. Friedland put the Gulf’s share of southern Africa’s imported sulphur above 90 per cent; trade analysis cited by S&P Global places the whole continent’s share closer to 48 per cent in 2025. The two numbers measure different geographies, and both are true. The copper and cobalt producers of the DRC and Zambia source over 90 per cent of their imported sulphur from the Gulf (Argus, 2026). The consumption sits predominantly in the DRC, whose oxide and cobalt circuits run on acid.
Zambia’s acid ledger runs the other way. The acid itself has two origins. Smelting sulphide concentrate releases sulphur dioxide gas; acid plants capture that gas and convert it to sulphuric acid, so on the Copperbelt every operating smelter makes acid as a co-product. The other origin burns elemental sulphur to produce the same gas and then the same acid. The distinction matters because Zambia’s sulphur is not scarce. It is conditional. The sulphur in sulphide ore is chemically bound within the ore minerals, and in Zambia’s flowsheet only smelting liberates it, at smelter sites, at smelter operating rates. Elemental sulphur is the same element on demand: a solid that stores, trucks, and burns when the leach circuit needs it.
Acid capacity stands near 3.9 million tonnes a year, overwhelmingly smelter co-product, against domestic consumption near 1 million tonnes (CRU, 2025). The consumption is Zambia’s own leaching. The Copperbelt is predominantly sulphide, not purely: Kansanshi leaches its oxide and mixed ores, and Nchanga’s Tailings Leach Plant, among the largest in the world, dissolves current and stockpiled tailings into cathode. Industrial uses beyond mining take a small residual. A 300,000 tonne sliver comes from plants burning imported sulphur, insurance against a co-product stream that follows the smelting schedule rather than the acid demand. A feedstock is the input material a process consumes to make its product. So Zambia imports the feedstock its own ore carries in abundance, because the ore surrenders it only through the smelter. And when concentrate leaves under the waiver, the sulphur leaves with the copper, feeding acid plants at whichever smelter receives it. The surplus historically flowed to the DRC. But capacity is not production: the 2025 smelter outages cut the co-product stream. Lusaka banned acid exports in September 2025, then moved them onto a permit footing from March 2026 that releases volumes only as domestic stocks recover (Onyambu, 2026b; Reuters, May 2026). The 2026 Gulf disruption proved the exposure (Onyambu, 2026e). The Strait of Hormuz closure cut sulphur flows from late February, and China announced a halt to sulphuric acid exports in April, effective May. Goldman Sachs estimated DRC producers held roughly three months of acid inventory against the gap (Onyambu, 2026b). Friedland warned that some oxide operations could face closure within three weeks of supply failure.
Kamoa-Kakula under Ivanhoe is the largest exception within DRC, not the only one. It sits on sulphide ore and processes through an on-site direct-to-blister flash smelter, Africa’s largest at 500,000 tonnes per year of design capacity. The production trajectory matters. Ivanhoe entered 2025 projecting 520,000 to 580,000 tonnes. A seismic event at the Kakula Mine in May 2025 forced a recovery plan, and the year closed at 388,838 tonnes. The ore grade fell with the ground. Kakula was planned at an ore grade above 6 per cent copper over its first five years, and milled ore grading 5.5 per cent in 2022. That is roughly ten times the global average ore grade, by Ivanhoe’s own count. The seismic event struck that high-grade eastern ground, and the cut-off grade, the minimum ore grade worth mining, fell from 2 to 1.5 per cent.
Guidance for 2026 was set at 380,000 to 420,000 tonnes, then cut to 290,000 to 330,000 tonnes in March 2026. The revised mine plan adopted more cautious geotechnical parameters and restated the reserve at 466 million tonnes grading 2.82 per cent copper (Ivanhoe Mines, 2026). The cut-off grade is the floor; the reserve grade is the average of everything above it. The restatement moved both ends: seismic losses removed high-grade ground, the lower floor admitted lower-grade tonnes, and the average fell from 3.94 to 2.82 per cent copper on roughly unchanged tonnage. The ramp back above 500,000 tonnes per year is now scheduled from 2028. The on-site smelter poured first anode in late December 2025 and produces 99.7 per cent copper anode alongside high-strength sulphuric acid sold to Copperbelt operations within the DRC. The smaller exception predates it: the Chinese-owned Lualaba Copper Smelter outside Kolwezi has produced blister from purchased concentrate since 2020, at roughly 120,000 tonnes a year, and tolls a share of Kamoa concentrate under a ten-year agreement (CNMC, 2020; Mining Weekly, 2026). The anode exits the DRC for refining elsewhere. The slime exits with it. Lualaba’s blister travels the same road.
The third DRC route is the quietest: sulphide operations that mine without smelting. Frontier at Sakania, ERG’s open pit two kilometres from the Zambian border, produces roughly 100,000 tonnes of copper in concentrate a year, the largest custom sulphide concentrate output in the DRC (ERG Africa, 2026). The nearest smelters are Zambian, with Mufulira thirty kilometres down the road. This is the flow the Zambian export figures earlier carried as transit material: DRC concentrate in, Zambian blister and anode out, refining elsewhere. The border crossing changes the flag on the intermediate product. It does not change the category.
Two countries, two processing chemistries, two vulnerability profiles. Zambia’s sulphide route loses byproduct value through anode slime when refinery capacity falls short, and its processing infrastructure is degraded. DRC’s oxide route produces cathode directly but depends on imported acid that a single supply disruption can cut. Both exit the chain as intermediate products.
Copper is also the strategic control case among the five chains. Demand runs the direction the others lack: electrification and compute are growing the market, not closing it, and substitution operates only at the margin, aluminium taking cable and winding share when the copper price stretches. No window is shutting. Supply management is neither available nor needed: African producers, at roughly a fifth of world output, are price-takers in a market that Chile, Peru, and scrap balance. The copper risk is different in kind. It is not a closing window but a growing market whose new stages are being built now, and built somewhere. The fitting instrument is the one the Bridge proposes, conditioning corridor access on semi-fabrication, so the stages land where the metal starts. Time is on copper’s side only until the buildout locks its geography.
After the exit. Cathode produced anywhere in the world enters the manufacturing chain: cathode → wire rod, strip, and foil → cable, busbar, winding wire, and circuit materials → data centre, electric vehicle, power grid → AI model, transport system, electrified economy. The semi-fabrication, component manufacturing, and assembly stages are where employment compounds, technology transfers, and value added accumulates. Africa is absent at scale from every stage after cathode, with only marginal exceptions that do not alter the structural pattern.
Cobalt
The Democratic Republic of Congo produces roughly three-quarters of global cobalt. Most cobalt is extracted as a byproduct of copper mining. The copper-cobalt ore bodies of central Africa contain cobalt as sulphides (carrollite, linnaeite, siegenite) and oxides (heterogenite, asbolite), with the carbonate sphaerocobaltite (Britannica, 2025). The processing chain runs: copper-cobalt ore → concentration → leaching → precipitation → cobalt hydroxide or cobalt carbonate. The DRC exits predominantly at crude cobalt hydroxide, with some carbonate. Artisanal production, historically estimated at 10 to 30 per cent of DRC output depending on year and estimator, fell to a historic low near 2 per cent by 2024 as industrial supply surged, and remains a volatile, price-elastic swing share (Cobalt Institute, 2025). It complicates the Track A “clean asset” argument because artisanal supply is the hardest to certify as compliant with US foreign entity of concern (FEOC) rules under the Inflation Reduction Act (IRA). The tracks are the Forced Choice’s: Track A routes certifiably clean supply toward US-aligned demand, Track B routes what cannot clear those screens toward markets that do not apply them.
The step from hydroxide to battery-grade material is where the value shifts. Cobalt hydroxide at roughly 30 per cent cobalt content is dissolved in sulphuric acid. It is then purified to remove iron, copper, manganese, and other impurities through staged hydrometallurgical processing including precipitation, solvent extraction, and selective crystallisation. The purified solution is crystallised into battery-grade cobalt sulphate, roughly 20.5 per cent contained cobalt with tight impurity limits. That cobalt sulphate is the feedstock for precursor cathode active material (pCAM) production. There it is co-precipitated with nickel sulphate and manganese sulphate in controlled ratios to form the nickel-manganese-cobalt (NMC) compounds that power lithium-ion battery cathodes. Each of these steps requires specific chemical engineering expertise, quality control infrastructure, and energy supply. Each is a distinct industry.
Chinese refineries control approximately 78 per cent of global cobalt refining to battery-grade material (IEA, 2025).
The processing does not stop at cobalt. Copper-cobalt ore from the DRC carries nickel, manganese, zinc, and iron alongside the target metals, and the DRC exports them together inside crude cobalt hydroxide. Whether each rides as impurity, penalty, or recoverable stream varies by ore body, flowsheet, and product specification. Separation, purification, and whatever recovery the feed makes economic happen at the receiving refinery through staged hydrometallurgical processing, overwhelmingly in China. The industry’s chemistry then closes a loop: what purification strips from the cobalt stream as impurity, the precursor step buys back as ingredient, nickel sulphate and manganese sulphate dosed in at controlled ratios. The payables schedule prices the contained cobalt. What the exported hydroxide therefore transfers is not a proven by-metal payday but the optionality: purification control, impurity management, assay knowledge, and any minor-metal recovery the feed supports, all exercised by the buyer. Public mine-level product specifications are insufficient to price that optionality. The information asymmetry is itself part of the structural capture: the value of what leaves is calculated by whoever receives it, not by whoever ships it.
The manufacturing chain after hydroxide runs: cobalt hydroxide → cobalt sulphate (battery-grade) → pCAM → CAM → battery cell → battery pack → electric vehicle or grid storage system. Each stage is a distinct industry with distinct margins, employment, and technology. The DRC, holding the reserves and producing the output, occupies none of them.
Zambia produces cobalt too, though the endowment is smaller than its reputation and the route hides even what there is. Zambian cobalt rides in the same Copperbelt sulphide ores, hosted mainly in carrollite, and travels with the copper concentrate into the smelter.
There the paths divide.
Most of the cobalt oxidises into the slag during smelting; the slag-cleaning furnace, run hot and reducing, pulls it back out fused with copper as a copper-cobalt alloy. Slag is not a residue in mass terms; a smelter makes roughly two tonnes of it per tonne of blister. The cobalt is what is scarce: Copperbelt ore carries it at around a tenth of the copper grade or less, so the alloy stream is small because the element is, not because the slag is. The remainder stays in the metal through to anode and surfaces in the refinery electrolyte, where the purification bleed recovers it. Output runs at a few hundred tonnes a year against the DRC’s six figures. The alloy exits from the Nchanga smelter to buyers in Asia for separation (KCM, 2026; Zambia Ministry of Mines, 2026). The scarcity is real: the USGS historical series puts Zambian reserves near 270,000 tonnes, roughly a twentieth of the DRC’s and about 2 per cent of the world’s. The popular belief in vast Zambian cobalt does not survive that table. But geology does not explain the trajectory. As recently as 2008, Zambia produced 7,800 tonnes and ranked third in the world. The directional fact is the sharper one. Chambishi Metals refined cobalt to finished metal on Zambian soil, at 6,800 tonnes of annual capacity and roughly 7 per cent of global cobalt metal supply in 2018, running partly on DRC feed (CRU, 2019). It suspended operations in 2019 over a concentrate import duty and never restarted. Zambia held the refined-metal stage and moved backwards from it: from cobalt metal to alloy, from a cobalt industry to cobalt as a passenger in copper products. The truncation is not only a ceiling countries fail to break. It is a stage a country can lose.
The leverage is real but time-limited. The Forced Choice estimated the overall mineral leverage window at five to seven years. For cobalt specifically, the window may be shorter. Lithium iron phosphate (LFP) chemistry passed half of the global EV battery market in 2025 (IEA, 2026). Sodium-ion is in mass production, with CATL’s Naxtra cells powering the first mass-production sodium-ion passenger vehicle, unveiled in February 2026 for mid-2026 market entry (CATL, 2026). Beijing is constructing the substitution pathway for the very commodities it locks in across Africa. Secondary supply from copper scrap recovery and end-of-life battery recycling will further tighten the leverage window for both copper and cobalt : a narrowing at the margin for copper, whose demand window stays open, and a compounding pressure for cobalt. Supply-side erosion compounds the demand-side exit: Indonesian HPAL plants now deliver cobalt as a nickel byproduct inside mixed hydroxide precipitate (MHP), the second-largest national stream, growing on nickel economics regardless of the cobalt price (Cobalt Institute, 2026). On the evidence assembled here, the cobalt window is the shortest of the five minerals examined. Revenue should be conservation-priced as windfall from a depleting position, not as permanent income from an enduring one.
The DRC has begun spending that leverage. Kinshasa suspended cobalt exports in February 2025, then replaced the ban with a quota system from October 2025 administered by ARECOMS, the state strategic minerals authority. The cap is 96,600 tonnes for each of 2026 and 2027, less than half of 2024 output, with 9,600 tonnes reserved to the state for strategic use including domestic processing support. Prices rose roughly 160 per cent from the February 2025 low to above USD 56,000 per tonne by mid-2026. In June 2026 the regulator ordered producers to forfeit unused first-half quotas into the strategic reserve (Bloomberg, 2026).
The instrument deserves precision. Indonesia ran two on nickel: the export ban that forced processing onshore, and the annual mining quota that manages volume. Kinshasa has adopted the quota without the ban’s condition; an allocation holder ships hydroxide unprocessed. That places the regime closer to OPEC than to Jakarta. And the OPEC comparison indicts rather than flatters. Riyadh, facing its own substitution horizon, has pivoted back to defending volume, keeping oil affordable to slow the exit and hold share. Kinshasa cuts volume and hands USD 56,000 cobalt to every cathode designer weighing chemistries without it. History sides with Riyadh’s method: the 2018 and 2022 cobalt spikes each accelerated thrifting and LFP adoption, and the current substitution wave was gathering before the quota and compounds under it. Cobalt’s byproduct nature sharpens the point. The units arrive with the copper, so mine supply barely responds to the cobalt price, the textbook case for selling volume rather than withholding it. Recovery and processing costs are material, but they discipline margins, not the supply decision.
The tactical case for the quota is real: it rescued revenue from a collapse driven by overproduction, and design cycles lock near-term demand firmly enough to pay the higher price. The strategic case fails on this essay’s own window analysis. Each year the cap runs, buyers qualify Indonesian MHP, a rival cobalt stream sitting outside ARECOMS’s writ because it is Indonesian, not Congolese. Jakarta constrains it only incidentally, through nickel ore quotas and the same Gulf sulphur chokepoint the acid economy above maps, and it grew to roughly 15 per cent of global supply in 2025 regardless. The price recruits engineers to cobalt-free chemistry, and feedstock buyers began qualifying non-DRC supply within months of the cap (Fastmarkets, 2026). And the state reserve accumulates a stockpile whose terminal buyer is the open question. The stranding is already physical: CMOC mined 117,549 tonnes in 2025 against a 31,200-tonne export allocation for 2026, nearly four tonnes mined for every tonne saleable abroad, the surplus warehoused in Katanga (CMOC, 2026; Bloomberg, 2026). A resource facing substitution is not leverage to be banked. It is an option to be exercised before expiry, and the quota converts the window into present revenue at the cost of pulling expiry forward. The windfall framing is therefore not optional but exact: quota revenue is the liquidation of a depleting position and must be conservation-priced as one. What the regime does not do is move the DRC up the chain. The country still exits at hydroxide. Supply discipline raises the price of the intermediate product. It does not change the category of the product.
Chromium
South Africa mined 23 of the world’s 51 million tonnes of chromite in 2025, 45 per cent of global output, from reserves concentrated in the Bushveld Complex (USGS, 2026). The metallurgical chain runs: chromite ore → concentration → smelting in an electric arc furnace at approximately 3,200 to 4,200 kWh per tonne (ICDA) → ferrochrome. South Africa can and does produce ferrochrome. This is the most energy-intensive smelting process of the five minerals examined.
Then the manufacturing chain: ferrochrome → alloying with iron and nickel → stainless steel slab → sheet, strip, tube → component manufacturing (surgical instruments, industrial equipment, kitchen and catering products, architectural materials) → final product. South Africa is absent at scale from the manufacturing chain. It produces ferrochrome and exports it. Columbus Stainless is the narrow integrated exception: it consumes ferrochrome rather than exporting it. The plant melts ferrochrome with iron, nickel, and scrap into stainless slab, then rolls the slab to flat products, occupying the first two stages of the chain above. It is majority foreign-held: Acerinox of Spain at 76 per cent, the IDC at 24 (Acerinox, 2026). The scale does not alter the aggregate export structure.
The failure mode is energy. Power is not the only cost pressure. Labour, logistics, ore quality, and deep-level mining also compound the competitiveness loss. But power is the binding variable because ferrochrome smelting is electricity-intensive and cannot run competitively on an unreliable grid. Electricity tariffs rising more than 900 per cent since 2008, compounded by Eskom load-shedding, broke South African ferrochrome competitiveness (Minerals Council South Africa, 2026). Chinese producers undercut on price because they have firm power, reinforced by scale, industrial clustering, and proximity to stainless demand. South Africa increasingly exports chromite ore rather than ferrochrome, surrendering even the smelting margin it once held. Once the world’s largest ferrochrome producer, it has ceded that position to China, and each tonne that exits as ore instead of ferrochrome exits without the smelting employment. The bloc politics sharpen the loss. The producer that absorbed South Africa’s smelting industry is its own BRICS partner, and membership purchased no industrial shield. Eskom opened the door; Chinese overcapacity walked through it; the diplomacy never entered the room. The Forced Choice criticised South African strategy on precisely this axis, deepening alignment with the economy that de-industrialises it. The chromium chain is that critique rendered in metal. The destruction is historical, not settled. Eskom’s grid has been recovering, and in May 2026 the energy regulator approved a preferential 62 cents per kilowatt-hour tariff for the two largest producers, an explicit attempt to arrest the closures (NERSA, 2026). The Bridge, Section 6 below, assesses whether restarting closed capacity clears within the window. Part 4 of the Misaligned Transition stated it directly: “Who captures the mineral processing value depends on who has the firm power to process” and “Energy is the foundation layer. Capital deployment is the structure. Mineral value capture is the prize” (Onyambu, 2026c).
Lithium
Zimbabwe holds Africa’s largest lithium reserves. Africa’s global share is small, roughly 1.4 to 2.5 per cent of reported reserves depending on dataset vintage, with Zimbabwe and Mali the only material holders (USGS, 2026); the 1.6 per cent The Forced Choice cited sat on the earlier vintage (Onyambu, 2026a). This is not a leverage position. It is included to ground the truncation pattern across a mineral where Africa’s position is weakest. The metallurgical chain for hard-rock (spodumene) lithium runs: pegmatite ore → mining → crushing and concentration → spodumene concentrate. Then, typically in China: calcination at 1,050 to 1,100 degrees Celsius → acid roasting → leaching → purification → lithium carbonate or lithium hydroxide → CAM (lithiation of pCAM at calcination) → battery cell → electric vehicle.
Zimbabwe exits at concentrate. In 2022 the government banned raw lithium ore exports. In June 2025 it announced a ban on concentrate exports from January 2027. In late February 2026 it suspended unprocessed mineral exports outright, citing malpractices and revenue leakages. A ministry letter of 2 April set the terms of resumption (S&P Global, 2025; Reuters, April 2026). The terms: individual export quotas, compliance conditions, written commitments to build lithium sulphate plants before January 2027, and a 10 per cent export tax on concentrate until the ban takes effect. The pressure is forcing construction. Huayou’s USD 400 million, 50,000-tonne lithium sulphate plant at Arcadia is built and exporting. Sinomine’s Bikita plant and others follow, with the producers’ association reporting one of seven majors ready and petitioning to defer the deadline to mid-2027. The ministry rejected the request on 17 July 2026, holding to 1 January 2027 (Bloomberg, June and July 2026). Zimbabwe exported 1.128 million tonnes of spodumene concentrate in 2025, a volume equal to roughly 15 per cent of China’s imports for the year. The power to run conversion at scale remains the open question. And the destination product is lithium sulphate, an intermediate feedstock refined into battery-grade material elsewhere, still short of the battery-grade sulphate that Table 2 places in the semi-finished band. If every plant commissions on time, Zimbabwe moves from one intermediate product to another. The ban changes the exit point. It does not cross the threshold.
The substitution horizon reads differently here than for cobalt. LFP, the chemistry closing cobalt’s window, is lithium iron phosphate: cobalt’s exit is lithium’s volume. The threat to lithium is sodium-ion, in mass production from 2026 and entering through the entry-level vehicles and stationary storage where lithium’s growth concentrates. And Zimbabwe’s position differs from Kinshasa’s in the one way that settles strategy. At roughly 2 per cent of reserves, Zimbabwe is a price-taker; supply management is not on its menu, so the ramp-or-restrict question the cobalt section weighs never arises. What remains is the other half of the Indonesian toolkit, the half the DRC has not used: conditioning export on domestic processing. That is the instrument Harare is running. The bet is not on price. It is on whether sulphate capacity lands and pays back before sodium-ion reaches the segments that would have bought the lithium.
The byproduct question is distinct from copper’s. Zimbabwean pegmatites carry tantalum and tin alongside lithium. Whether those minerals report into saleable by-concentrates, into the lithium concentrate itself, or into tailings is deposit- and flowsheet-specific, and public mass-balance data do not exist. That absence is the finding: on the public record no authority can price what leaves. As with cobalt, whatever byproduct value the concentrate carries is calculated by whoever receives it.
Platinum Group Metals
South Africa hosts the bulk of Africa’s PGM reserves, concentrated in the Bushveld Complex. This is the most complete processing chain on the African continent. The metallurgical chain runs: ore → concentration → smelting at 1,350 to 1,500 degrees Celsius → converting to matte → base metal refining (separating nickel, copper, cobalt) → precious metal refining (separating platinum, palladium, rhodium, ruthenium, iridium, osmium). Six metallurgical stages. South Africa performs all of them.
Then the manufacturing chain: refined PGMs → PGM-loaded catalyst substrate → catalytic converter for ICE vehicles, hydrogen fuel cell catalyst, industrial process catalyst, electronics components → vehicle, fuel cell stack, chemical plant, electronic device.
The failure mode is not processing. South Africa has the processing. The failure mode is the absorber market. Most refined PGMs flow to Northern Hemisphere automotive manufacturers for catalytic converters, a market that declines as internal combustion vehicles decline. The decline is drivetrain-specific, not vehicle-specific. Battery-electric drivetrains carry no exhaust and no catalyst. Hybrids keep the combustion engine and the converter at comparable loadings, and the current hybrid wave is the demand bridge. Fuel-cell vehicles are electric vehicles too; they move the platinum from the exhaust to the power source. Hydrogen fuel cell demand could replace automotive catalyst demand over time, and South Africa’s HySA programme aims to capture that shift domestically. But the fuel cell market remains small relative to the installed PGM production base, and the transition from ICE decline to fuel cell scale is a timing gap that current producers must survive. Even under optimistic hydrogen scenarios, fuel cell demand absorbs only a fraction of current PGM production capacity in the medium term. Industrial catalysis absorbs a smaller fraction still.
The supply-strategy test from the cobalt section lands differently here. Ramping produces nothing: platinum group content is a few hundred dollars of a vehicle at most, so no price cut slows the battery drivetrain, and cheap metal only breaks South Africa’s own deep-level cost curve. Restriction extends nothing: the decline is regulatory and technological, not price-driven. Neither OPEC tool has purchase.
What South Africa holds is the strongest conditioning hand on the continent: 83 per cent of reserves with no comparable alternative source. The leverage runs over every buyer who still needs the metal, and it is exercisable not on price but on stages. Substrate, converter, and electrolyser capacity can be conditioned on supply the way the Bridge proposes, and unlike the DRC’s quota, the counterparty cannot walk to Indonesia.
South Africa built part of the absorber, deliberately, and is now losing it. Catalytic converters are the country’s largest automotive component export, 26 per cent of component exports in 2025, an industry constructed under the MIDP from 1995 and carried by the APDP since (naamsa, 2026). Two measures size the split, and they measure different things. Commercially, under 3 per cent of platinum and palladium sales are domestic; the metal sells abroad (DMR data in IDC, 2018).
Physically, the converter plants at their 2012 peak worked roughly 15 per cent of locally mined PGMs into converters, and virtually all of it left as product (SAIMM, 2012). The two reconcile because local fabrication is not a domestic sale: the metal is typically bought by the handful of global catalyst firms that work more than 85 per cent of all PGMs (IDC, 2018). Fabrication touches a minority of the metal, final domestic consumption almost none of it, and the rest ships as refined metal.
Vehicle assembly sits above it, with the verb chosen precisely: global carmakers assemble their own models in South Africa. The country exported a record 414,271 of them in 2025, and automotive trade ran at 15.6 per cent of total exports. This is the one place on the continent where a mineral becomes a component and the component enters a vehicle on African soil.
But the absorber is borrowed twice over. The marques are foreign and the plants are wholly owned subsidiaries of the parents; even the empowerment ownership element is met through an equity-equivalent fund rather than local shares (the dtic, 2019). The production is near fully export-focused. The destination is electrifying besides: component exports fell 3.5 per cent in 2025 on the converter decline (naamsa, 2026). The EU’s 2035 endpoint was formally proposed for softening in December 2025, a 90 per cent cut that keeps hybrids selling. A regulation written in Brussels still sets the pace at which a beneficiation triangle built in Gauteng and the Eastern Cape unwinds. The proposal lengthens the converter tail without changing its direction. The ferrochrome arc, one stage further downstream.
The constraint is compounded by trade architecture. South Africa carried a 30 per cent US reciprocal tariff from August 2025 until the US Supreme Court struck the underlying measure down in February 2026. The blanket rate fell to 10 per cent under interim authority that expires on 24 July 2026, with a proposed successor tariff pending and Pretoria petitioning for exemption. Steel, aluminium, and automotive lines remain exposed under Section 232 throughout, while refined PGMs themselves move under critical mineral exemptions; the exposure sits in the manufactured goods that would use them. The instruments rotate; the direction holds. A major absorber market for South African manufactured goods that would use PGMs as inputs keeps narrowing. The EU remains accessible, but EU demand flows through European automotive manufacturers who purchase predominantly refined metal, with South African manufactured components a narrow stream against the metal flow. South Africa sells refined PGMs into absorber markets that capture the bulk of the catalyst-substrate and converter manufacturing stages. Processing exists and is the most complete of any mineral chain on the continent, yet the economic outcome at the manufacturing level is largely the same as if it did not. A country that refines PGMs to the highest metallurgical purity and exports most of them for someone else to manufacture into catalytic converters is a sophisticated supplier, not an industrialised economy.
2. The Pattern
Five minerals. Five different exit points. Five different failure mechanisms. One structural outcome.
Table 1 draws the five chains together.
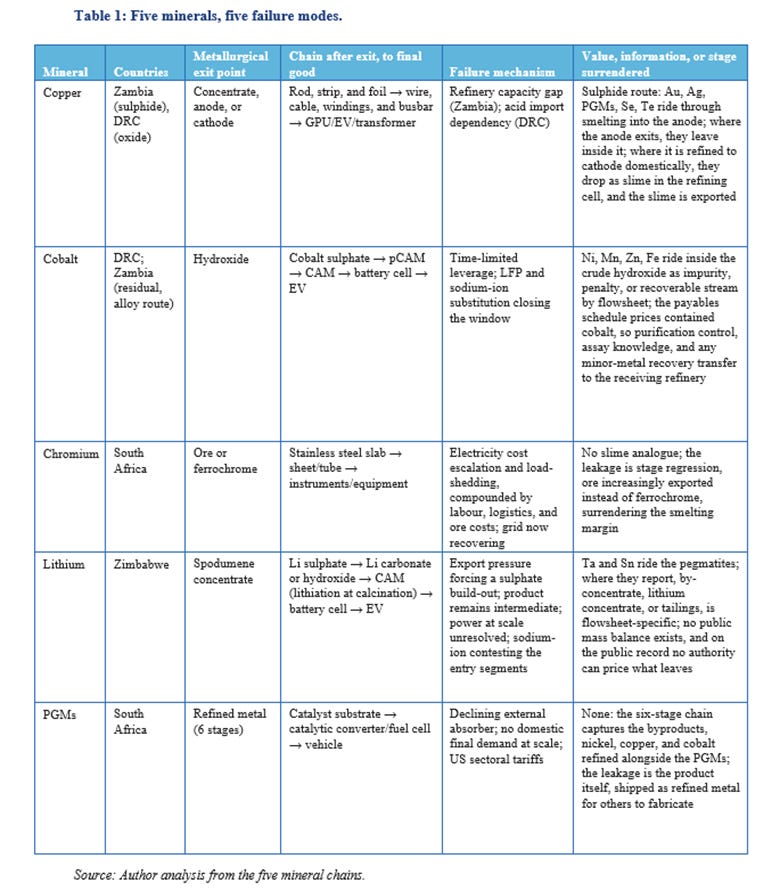
Across the five chains, the dominant export volume exits Africa before the manufacturing threshold, regardless of where each mineral sits on the metallurgical chain. Measured by the flow itself, the furthest the dominant volume reaches is refined PGM metal after six processing stages. It is still an input. It is still intermediate. The manufacturing exceptions are real, the converter industry above all, but they process a minority of the underlying flow: at its peak, converter production beneficiated roughly 15 per cent of locally mined PGMs (SAIMM, 2012).
Figure 1 maps each metallurgical chain to its dominant African exit.
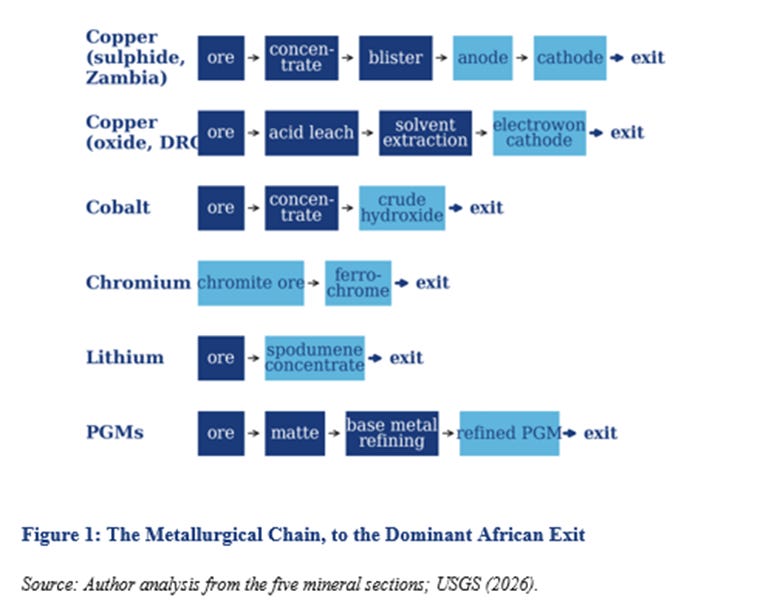
Figure 2 draws the chain after exit, every row beginning at the manufacturing threshold the dominant flow has not crossed.
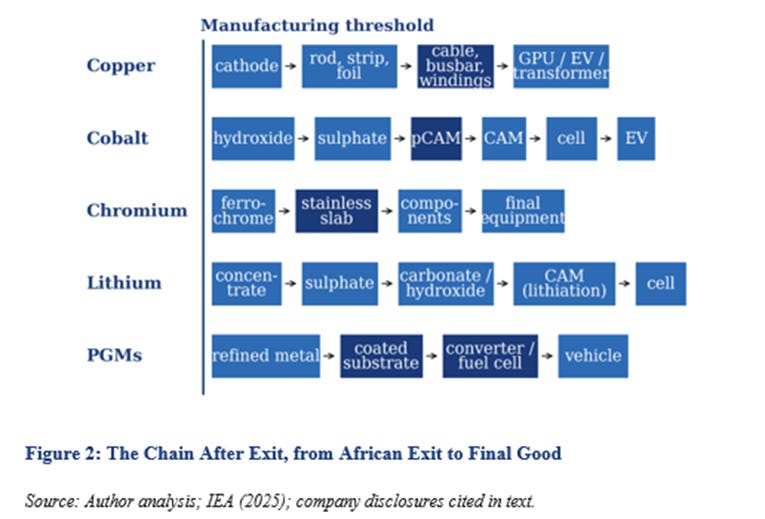
Chile, the world’s largest copper miner, refines roughly 2 million tonnes to cathode annually and remains a copper exporter, not a copper manufacturer. The same holds inside Africa: the DRC’s electrowon cathode exits at comparable scale as an input. Cathode at scale does not become less intermediate. The manufacturing threshold is not crossed by volume.
Three ledgers keep the accounting honest, and the essay applies all three. Geographic capture asks where the jobs, tax base, utilities demand, and industrial learning land. Ownership capture asks who takes the dividends, the control rights, and the intellectual property. Absorption capture asks where the final product sells and who owns that buyer market. The exceptions that follow score differently on each ledger, which is why no single test settles them.
Isolated exceptions exist: Zamefa’s wire rod and cable in Zambia, Columbus Stainless carrying ferrochrome into flat-rolled stainless, and South Africa’s catalytic converter plants manufacturing the country’s largest automotive component export. These are significant firms but not scale transformations. And the exceptions inherit the pattern’s pressures rather than escaping them. Columbus rolls stainless from the smelting the power crisis priced out, and the converter plants serve combustion demand Brussels scheduled to end, then moved to reopen: the December 2025 proposal cuts the target to 90 per cent and lets hybrids sell past 2035. The direction holds; the tail lengthens. Zamefa’s 2025 accounts carry the third pressure: metal prices lifted revenue while profit after tax fell by roughly two thirds, the cable maker buying its cathode at world price like any offshore rival.
And ownership runs the same direction as everything else in this essay: each crossing is owned from one rung further out, Zambia’s cable maker from Johannesburg, South Africa’s stainless mill from Madrid. The rungs are not equivalent, and the distinction matters because this essay counts in continental terms. Madrid takes the margin off the continent. Johannesburg moves it within Africa while moving it out of Zambia: leakage on the national account, integration on the continental one. African capital owning a crossing across a border, selling manufactured copper to African buyers, is the intra-African structure the closing sections argue for, arrived early. What no rung alters is the direction: not one crossing examined here is owned from the country whose mineral it carries. The exceptions prove crossing is possible. They do not prove it is durable.
The question is not whether any African firm crosses the manufacturing threshold. The question is whether the structural pattern, across the chains that carry the bulk of the continent’s critical mineral output and export revenue, permits industrial transformation through the extractive lane alone. Counter-examples exist outside the five minerals examined: Moroccan phosphate fertiliser manufacturing crosses the intermediate threshold at export scale. The framework’s value is diagnostic specificity: it identifies which minerals are truncated, at which stage, and why.
Across all five minerals, the processing stages that capture value require continuous industrial-scale power. Ferrochrome smelting at 3,200 to 4,200 kWh per tonne (USGS and industry data). Lithium calcination above 1,000 degrees Celsius. Copper flash smelting at roughly 1,200 to 1,300 degrees. PGM furnacing at 1,350 to 1,500 degrees. High-temperature pyrometallurgical processing requires firm power. Hydrometallurgical routes (leaching, solvent extraction, electrowinning) are more flexible in scheduling but still require reliable supply at scale. The binding constraint is not renewable energy per se. It is firm power: continuous, dispatchable supply at industrial scale, the attribute the furnace prices. The grid is the delivery layer, moving firm power to the furnace within borders and pooling variability across them, which is why the Misaligned Transition finances the two separately, Firm Power Finance and Grid Finance. The series carries the full diagnosis. The point here is narrower: every mineral’s processing requirement is a firm power requirement.
The distinction between metallurgical completion and manufacturing entry is not new. The African Mining Vision (2009), the ECFR mineral partnerships paper (2025), and industry classification models all recognise it in different formulations. What the five minerals examined here demonstrate is not a conceptual insight but an empirical pattern. The distinction operates consistently across the five critical mineral chains examined, the chains that carry the bulk of the continent’s critical mineral export value. Whether it extends beyond critical minerals is Article 3’s question. The byproduct leakage at each exit point has not been traced across the five chains in the policy literature. The conservation arithmetic that follows from the pattern has not been assembled in the African policy debate. The framework below is not offered as a theoretical contribution. It is offered as an operational tool for assessing where policy effort yields industrial return and where it does not. This framework operates on economic and commercial boundaries. The metallurgical classification is the input; the manufacturing lens is the test.
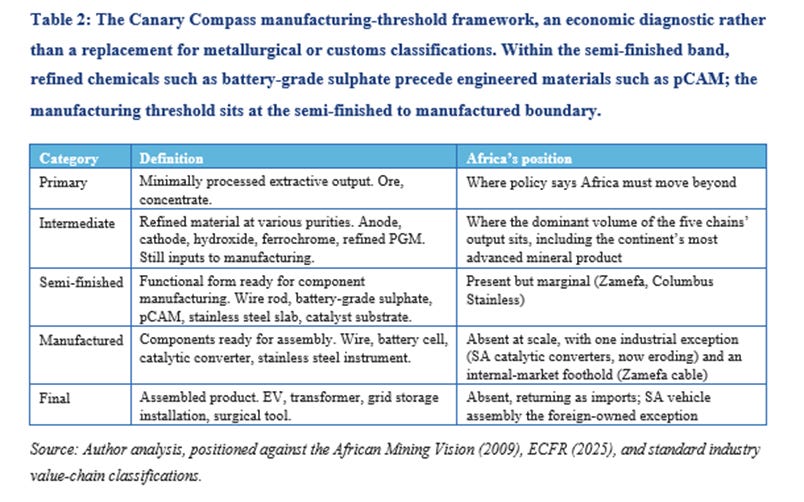
Under this framework, moving from concentrate to anode to cathode is movement within the intermediate category. Each step captures a refining margin. None crosses the economic boundary into manufacturing. The corridor that carries that cathode to a port, however well financed, is better logistics for the same truncation. For allocators, the framework maps a structural cap: the mining assets in these chains are priced as commodity producers because the chain truncates before manufacturing margin. The investable signal sits with the firms and policies that cross the threshold. The framework reads on the geographic ledger; ownership and absorption are scored separately where the exceptions are assessed.
3. The Corridors
Billions of dollars are flowing into mineral corridor infrastructure across the continent. The question is what those corridors are designed to carry.
Table 3 compares the corridors.
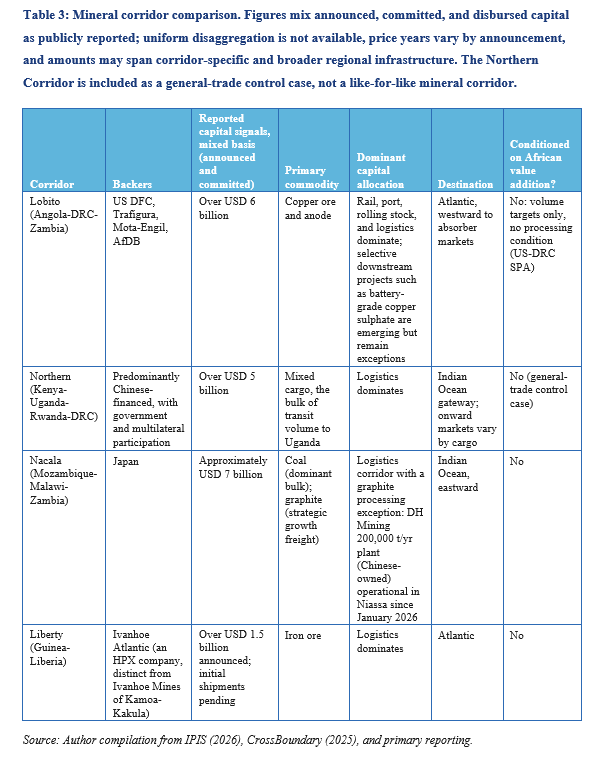
Global commitments to the Lobito Corridor alone now exceed USD 6 billion. First-year DRC copper volumes through the corridor reached approximately 40,000 tonnes in 2024. Ivanhoe Mines’ Kamoa-Kakula holds a capacity agreement for 120,000 to 240,000 tonnes of copper products annually, and the route is live. First commercial exports of Kamoa-Kakula copper anodes ran in the first quarter of 2026, reaching the port in roughly a week by rail against three or more by road. Trafigura’s first sale delivered Kamoa anodes to Aurubis’ Olen refinery in Belgium for final refining (Ivanhoe Mines, 2026; Trafigura, 2026). The byproduct ledger travels with the cargo: the anode slime from that copper, and the gold, silver, and selenium it carries, now forms at Olen rather than on Congolese soil, assayed by the buyer. The infrastructure is real, scaling, and already tested: severe flooding suspended full operations for roughly two months before the line resumed in June 2026. Nacala carries the table’s one operational processing exception: DH Mining’s 200,000 tonne per year graphite plant in Niassa, operational since January 2026, Chinese-owned, processing on African soil inside a Chinese supply chain.
In February 2026, Angola, the DRC, and Zambia formalised a joint investment platform in Luanda (Government of Zambia, February 2026). The coordination meeting drew AfDB, the EU, the World Bank, Japan, and the United States. The platform explicitly names value-added mining alongside transport as a corridor objective. The rhetoric has evolved beyond pure logistics. Whether committed capital follows the rhetoric is the test the corridor’s next phase must pass.
Morocco is the control case. In June 2025, COBCO, a joint venture between Morocco’s Al Mada and China’s CNGR, inaugurated Africa’s first battery precursor (pCAM) production complex at Jorf Lasfar: 238 hectares, USD 2 billion committed, first-phase NMC precursor cathode production operational. Full-scale targets are 120,000 tonnes of NMC precursors, with a further 60,000 tonnes of LFP cathode capacity conditional on a regional LFP ecosystem developing (COBCO, 2025). Gotion High-Tech is scheduled to begin production at Africa’s first battery gigafactory in Kenitra in Q3 2026: 20 GWh initial capacity on a USD 1.3 billion first phase. The programme scales toward 100 GWh, announced at 65 billion dirhams, roughly USD 6.5 billion (Reuters, May 2025). BTR New Material Group is developing 50,000 tonnes of cathode and 60,000 tonnes of anode materials production near Tangier.
Morocco’s case should not be romanticised. The battery ecosystem is substantially Chinese-financed and Chinese-operated. COBCO is a joint venture. Gotion and BTR are Chinese-linked investments. Chinese firms still control important technology, process know-how, and corporate economics. What Morocco achieves is not full sovereignty over the battery stack. It is hosted industrial capture: land, labour, utilities, tax base, supplier linkages, and proximity to European automotive demand. That is materially better than exporting concentrate. It is not the same as owning the value chain. On the three ledgers The Pattern sets out, Morocco maximises geographic capture, cedes much of ownership capture, and rents absorption through European proximity.
What makes Morocco work is a combination not currently replicated at comparable scale in sub-Saharan Africa. A dominant sovereign mineral position with clean ownership: OCP Group, roughly 94 per cent Moroccan state-owned, controls roughly 70 per cent of global phosphate reserves. An existing Western manufacturing base: Renault, Stellantis, Boeing, Safran, 700,000 vehicles of installed annual capacity as of 2024 and expanding toward one million. And institutional capacity to manage dual-market strategy at asset level, running sovereign phosphate operations alongside Chinese joint venture processing, navigating FEOC boundaries within a single country.
The question the Misaligned Transition asked of green-labelled instruments applies here: does the value route through Morocco or land in Morocco? If the processing technology, supply chain management, and corporate economics serve Chinese strategic interests through a Moroccan domicile, the exception proves a different rule than the one the essay claims. What is replicable is the dual-market strategy and the insistence on sovereign mineral control as the anchor around which foreign capital assembles. What is not replicable is Mediterranean proximity to European manufacturing demand and the specific geology of phosphate, which requires less energy to process than copper, chromium, or lithium.
4. The AI Compute Connection
The mineral truncation and the digital economy are the same chain.
In 2026, four hyperscalers (Amazon, Alphabet, Microsoft, Meta) committed approximately USD 695 to 725 billion in combined capital expenditure, heavily directed at AI and cloud infrastructure (Financial Times, April 2026). That is up roughly three-quarters on 2025 levels. Amazon alone committed USD 200 billion. Alphabet raised guidance in April 2026 to USD 180 to 190 billion. Microsoft raised calendar-year 2026 guidance to approximately USD 190 billion in its April 2026 earnings. Meta guided USD 125 to 145 billion. Reported cloud order backlogs at the three hyperscalers that disclose them exceed USD 1 trillion, with Microsoft’s roughly doubling year on year.
Much of that spending lands in physical infrastructure that requires mineral inputs. Copper for cabling, busbars, transformers, and data centre power distribution. Lithium, and cobalt where chemistries retain it, for backup and grid storage systems. The physical chain runs: Zambian copper ore → cathode → rod, strip, and foil → cable, busbar, and package materials → data centre rack → AI model training → subscription product returning to Zambia at current market tiers of USD 20 to USD 200 per month.
The mineral extracts value going up. The digital product extracts value coming down. Africa provides the copper for the board that trains the model that prices out the user who mined the ore. The verb is arithmetic, not rhetoric. A USD 20 monthly tier equals roughly one fifth of Zambia’s monthly GNI per capita, the annual USD 1,260 divided by twelve (World Bank, 2025). The benchmark is illustrative, not household income data; against the markets the model serves, the same tier is a rounding error. Deployed compute capacity is expanding faster than hardware retirements, with hyperscaler capex rising across successive chip generations. Efficiency gains in model architecture and chip design may moderate mineral intensity per unit of compute over time. But deployment outpaces retirement, and the build-out phase is accelerating, not plateauing. The mineral demand is structural because scale of deployment outpaces intensity reduction.
Africa holds no controlling position at globally significant scale on any floor of this building: no hyperscale platform, no frontier model, no semiconductor stage. Africa is inside the building as raw material. The digital infrastructure through which the value chain completes its journey is not a single system. It is two parallel stacks, American and Chinese, and Africa is layered across both without owning either. M-Pesa is the strongest exception, an African-built, African-scaled digital layer, though its ownership structure is not purely African, and it operates in payments, not AI. The physical inputs (copper, cobalt, PGMs) flow into both stacks as raw material. The digital outputs flow back as services priced in dollars. Different chain, same structural position.
5. The Conservation Question
Everyone calculates Africa’s mineral endowment as export capacity. Washington counts it as supply security. Beijing counts it as input access. The Atlantic Council counts it as corridor throughput. FORGE, the Forum on Resource Geostrategic Engagement launched in February 2026 with 54 partner states, proposes price floors to guarantee flow. Project Vault builds a USD 12 billion American strategic stockpile. The hyperscalers commit over USD 700 billion in capex requiring mineral inputs.
Nobody runs the calculation from the other side: how much does Africa need to keep?
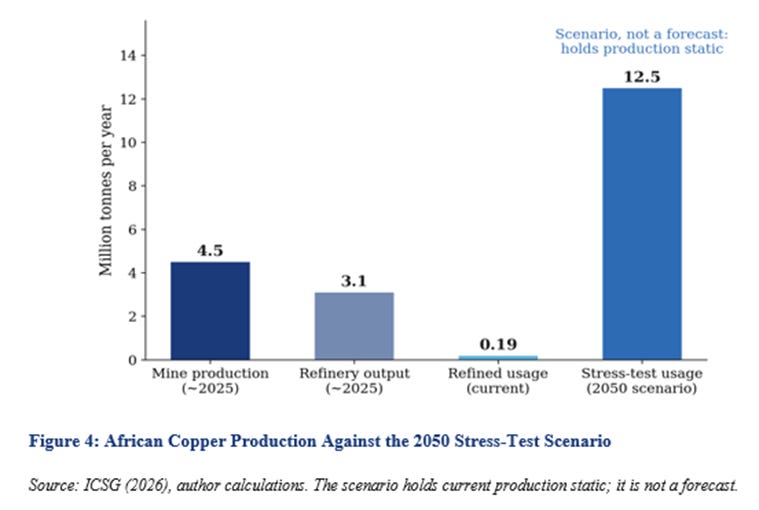
Africa’s refined copper usage in 2025 was approximately 193,400 tonnes against a population of roughly 1.5 billion, giving per capita consumption of approximately 0.13 kilograms (ICSG Table 2, May 2026 update; UNECA, 2024). China consumed roughly 11 kilograms per capita. The United States consumed roughly 5 kilograms. BHP estimates China’s accumulated copper stock-in-use at approximately 100 kilograms per capita, against roughly 200 kilograms in developed economies (BHP, 2024). This is not a forecast. It is a stress test against current production held static. A middle-income target of 5 kilograms per capita, below China’s current consumption, applied to Africa’s projected 2.5 billion population by 2050 produces annual demand of 12.5 million tonnes. Current African production is approximately 4.5 million tonnes. The 5 kilogram assumption is conservative relative to China’s path and approximate relative to the US. If Africa’s electrification follows a copper-intensive grid build-out, the figure could be higher. If leapfrogging to aluminium conductors and fibre optics occurs at scale, it could be lower. Either way, under the static-production stress test, the arithmetic produces a deficit within the planning horizon. The 5 kilogram benchmark is deliberately mid-range: at 3 kilograms the 2050 figure is 7.5 million tonnes, at 7 kilograms it is 17.5 million, and the deficit holds across the range. Substitution, recycling, and different industrial pathways may reduce the requirement. They do not eliminate the need to calculate domestic future absorption before exporting as if reserves are surplus.
Figure 3 sets the consumption arithmetic side by side.
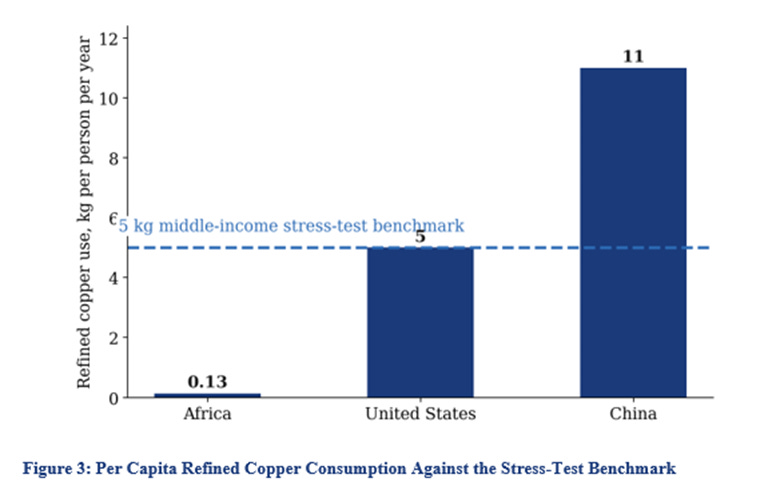
Figure 4 runs the production side of the same arithmetic.
The same planning principle applies to every mineral examined in this essay, though the demand model and the relevant unit differ by commodity, and the essay’s own substitution timeline disciplines the list. African battery storage and entry-level EVs will arrive on the chemistries winning the cost curve, LFP and sodium-ion, whose inputs are lithium, iron, phosphate, manganese, and sodium. Africa holds that list: Moroccan phosphate, the Kalahari manganese field, and the soda ash already produced at Magadi and Sua Pan. Cobalt is the exception that proves the discipline: the chemistry replacing it does not need it, so its African future is export revenue against a closing window, not a domestic demand story. Chromium for the stainless steel that construction, medical, and industrial development requires. The minerals Africa ships out today are, with that one honest exception, the minerals Africa will need for its own industrialisation.
This calculation sits in tension with the global decarbonisation timeline. The IEA and IRENA project mineral demand multiples that assume uninterrupted African supply growth. Conservation pricing or export conditioning would tighten that supply at exactly the moment climate models assume it expands. The tension is real but not symmetrical. Africa holds no obligation to subsidise global decarbonisation at the cost of its own industrialisation. Africa accounts for roughly 3 per cent of cumulative fossil CO2 emissions and about 4 per cent of current annual emissions (Global Carbon Project via Our World in Data; Onyambu, 2026c). It holds roughly 18 per cent of the world’s population (UNECA, 2024).
Conservation is not autarky. It is sovereign sequencing: building the firm power base and domestic absorption capacity before maximising export volumes. Africa can meet contractual offtake obligations during the leverage window while conditioning new extraction on domestic processing and forward consumption needs. The claim is not that Africa should withhold minerals the world needs. The claim is that Africa should condition extraction on terms that ensure its own electrification and industrialisation are funded by the same resource base. The two objectives are compatible if the sequencing is right. They are incompatible only if Africa is expected to deplete its resources for other countries’ transitions while its own remains unfunded.
Conditioning new extraction on domestic processing does not mechanically reduce revenue from existing operations, though investor risk premiums and brownfield investment decisions can respond to the policy signal. Existing mines continue producing. Existing revenue, optimised through intermediate-band capture, continues. Successful new projects preserve extraction revenue while adding processing employment and refining margin. The fiscal risk is slower growth in new extraction during the processing build-out, not a reduction in the existing revenue base.
The reason Africa cannot absorb its own minerals now is the same reason the Misaligned Transition series diagnosed: the firm power gap. The processing temperatures and energy intensities documented in the five chains above require continuous industrial-scale supply. That supply does not exist at scale across the continent. As “EVs Are the Last Mile, Not the First Mile” argued: “A state does not get rewarded for picking every working technology. A state gets rewarded for closing binding constraints first” (Onyambu, 2025). The minerals are leaving because Africa cannot yet use them. By the time the foundation is built, the window may be gone.
Indonesia understood this. The raw nickel export ban, first imposed in 2014, relaxed in 2017, and fully reinstated from January 2020, forced international buyers and processors to establish operations within Indonesian borders. Chinese and Korean battery manufacturers built high-pressure acid leach (HPAL) facilities converting laterite ore into mixed hydroxide precipitate, an intermediate battery feedstock, on Indonesian soil. The government manages production through annual mining quotas as a sovereign conservation tool (S&P Global, 2025). Indonesia maintained the ban despite losing the 2022 WTO panel ruling brought by the EU, appealing into a paralysed Appellate Body while keeping the policy in force. Indonesia now accounts for approximately 60 per cent of global mined nickel, with market share rising from roughly 31 per cent in 2020 to 60 per cent in 2024. The DRC’s cobalt quota regime is the quota half of that toolkit arriving on African soil.
The Indonesia precedent is not uncomplicated. Nickel price suppression damaged producers elsewhere. The processing facilities are predominantly Chinese-financed and Chinese-operated, raising the same question the Morocco section asks: whether domestic processing with foreign ownership constitutes genuine value capture or geographic relocation of someone else’s industry. Environmental damage from rapid laterite processing in Sulawesi and Maluku is still being managed. The lesson is not “ban exports.” The lesson is that conservation only works when processing capacity, power, environmental regulation, and buyer discipline exist before the restriction hardens. The conservation calculation, the conditioning of extraction on domestic capacity, is what transfers. The ownership and employment structure requires closer examination than the headline numbers suggest.
The United States understands the conservation logic perfectly. Project Vault is a USD 12 billion domestic strategic reserve, roughly USD 10 billion in EXIM financing and USD 2 billion private. The inference is direct: America is stockpiling the class of minerals it is building corridors to extract from Africa. Washington runs the conservation calculation for its own industrial future. The question is why African governments are not running the same for theirs.
6. The Bridge
The five chains examined above produce a consistent finding. Its parts are individually well known. What the policy debate does not do is hold them together and price what the combination implies.
Chinese firms dominate the downstream processing, refining, and offtake of three of the five chains outright, and set the price ceiling in a fourth, chromium, through surplus capacity. Chinese refineries process Zambian and Congolese copper. Chinese hydrometallurgical plants separate DRC cobalt and its adjacent metals. Chinese ferrochrome producers undercut South African smelters on price. Chinese facilities process Zimbabwean lithium concentrate. Chinese capital built Kamoa-Kakula into one of the fastest-growing copper mines in the world (Ivanhoe itself is part-Chinese-owned). COBCO’s precursor plant is the first pCAM production on African soil. The question is not whether Chinese capital delivers. It is whether the terms of delivery serve African industrial sovereignty over time. The surplus economy captures the value between extraction and manufacturing. It is also building the substitutes (LFP, sodium-ion) that will close the leverage window from the demand side.
The absorber economies (the United States, the European Union) want African minerals. But the record shows they want the intermediate output, not the African manufactured good. The Lobito Corridor carries copper ore and anode westward, not wire rod or components. European automotive manufacturers purchase predominantly South African refined metal, the intermediate under its most finished name; converter exports exist but remain narrow against the metal flow. The United States tariff wall runs against all comers, skewed hardest at China and aimed at bringing manufacturing home. Africa is not the target, but the incidence grades by stage: mined commodities pass least affected while manufactures and agricultural goods carry duties two to three times higher (UNCTAD, 2025). The grading showed in metal: South African vehicle exports to the United States fell roughly three-quarters in 2025 under the sectoral auto tariff, the record export year rescued by other buyers (ISS, 2026). A market rebuilding its own factories absorbs fewer of anyone’s, whatever the flag. Absorber economies invest in extraction logistics. Their critical mineral commitments weight extraction and transport far more heavily than African component manufacturing.
But this does not mean Africa lacks agency. It means the agency is mineral-specific and must be exercised now.
Where Africa can demand manufacturing. South Africa holds approximately 83 per cent of reported global PGM reserves, roughly 85 per cent with Zimbabwe included, with no alternative primary source at comparable scale (USGS, 2026). It already processes through six stages. The manufacturing step is catalyst substrate production and fuel cell components. The demand is credible: continued refined supply conditional on absorber economy co-investment in South African manufacturing and tariff reduction. Capital is available from South African institutional investors, GCC sovereign wealth funds, EU partnership, and Japanese fuel cell technology transfer. The EU has no comparable primary alternative; recycling, Russian, and North American supply do not close the gap. PGMs score highest because the gap to manufacturing is one step and the leverage is exceptional. Secondary supply runs at roughly a fifth of platinum and a third of palladium volumes, growing but well below primary.
Three of every four tonnes of mined cobalt come out of the DRC. The IRA requires FEOC-compliant sourcing. Companies need DRC cobalt from clean supply chains. The demand: new extraction licences conditional on pCAM plant co-investment on DRC soil, with technology transfer and specified local ownership within 10 years. Capital: the US International Development Finance Corporation (US DFC, redirectable from logistics to processing), EU development finance institutions driven by the Critical Raw Materials Act (CRMA), Gulf (GCC) sovereign wealth (fast, no contamination), diaspora capital with alignment to DRC development outcomes. No plant, no licence. The window disciplines this demand more than any other in the table, and three clocks the essay has already set govern it. Design cycles lock NMC demand firmly enough to pay for plants, and FEOC rules give a non-Chinese precursor plant scarcity value independent of total cobalt volume. Because Congolese cobalt arrives as copper’s byproduct, the licence being conditioned is at bottom a copper licence, priced in the growing market rather than the closing one. The condition should specify chemistry-flexible co-precipitation capacity, able to run cobalt-lean ratios as thrifting proceeds, so the asset outlives its founding chemistry. And the demand expires: exercised in the current licensing rounds or not at all, because each year of substitution and Indonesian qualification prices it down. This demand requires governance capacity to enforce licence conditions and monitor compliance, capacity that varies sharply across mineral-producing countries and within the DRC itself. It is only credible where infrastructure and project economics can carry the plant.
Copper’s demand set is larger than fabrication. DRC ore grades give production leverage, and Kinshasa has converted its share into a signed instrument. The December 2025 US-DRC Strategic Partnership Agreement writes corridor volumes into treaty, targeting 50 per cent of state-marketed copper through Lobito within five years (US Department of State, 2025; Egmont Institute, 2026). Security followed within three months: US sanctions on Rwandan forces landed in March 2026, sequencing Kinshasa reads as the partnership delivering. The same month, Kinshasa deepened its Beijing track, a producer auctioning its geology to both bidders (ISS, 2026).
Zambia’s posture runs opposite to its leverage. Lusaka is not idle in the band: the state now trades copper through the IDC-Mercuria joint venture, capturing intermediary margins it previously ceded, a move in the right direction. It is also insufficient, because trading optimises the intermediate band while the tankhouse and the rod cross out of it. It smelts at scale but refines a fraction of its anode: Kansanshi has no anode refinery, and the Chambishi copper smelter’s output routes to its parent’s refineries in China. The first demand is therefore the refining gap itself: tankhouse capacity conditioned on new licences and corridor access, economics resting on the byproduct capture the slime passage priced, since zero TC/RC forecloses fee-based refining. The benchmark prices the concentrate chain; the same collapse compresses the anode-to-cathode margin, so the fee route is closed at either stage and the case rests on byproducts and premiums. The second is wire rod on the corridor, where certification and offtake economics support it; Zamefa proves the capability, and the constraint is firm power at the scale expansion requires.
Yet in the season Kinshasa signed with Washington, Lusaka’s flagship corridor decision ran east: TAZARA concessioned to CCECC for 30 years and USD 1.4 billion, toward Dar es Salaam. The weakness is not the port, which can serve any buyer. It is that the concession carries no visible tie to Zambian refining or fabrication commitments, awarded to the surplus economy that already owns its smelting, the buyer against whom Zambia holds least leverage. The unexercised leverage points west, where the absorber finances the Zambia-Lobito greenfield to its border and Mingomba’s development, and no Zambian equivalent of Kinshasa’s instrument exists.
Capital: US DFC redirect, AFC, GCC, Indian offtake-anchored capital, Vedanta at KCM the precedent. The ladder does not stop at the rod. Africa at 0.13 kilograms per capita copper consumption will need wire, cable, and wound copper for its own electrification. The internal market is the buyer for whom the manufactured form is the product, and Zamefa’s cable already serves it. Semi-fabrication for the corridor funds the crossing. Manufacture for the internal market IS conservation in manufactured form.
Chromium leverage exists, but it must be sized honestly, because the counterparty is the bloc anchor. The instrument is the ore: South Africa mines 45 per cent of the world’s chromite and supplied more than 80 per cent of China’s chrome ore imports on the last full accounting (USGS, 2026; CRU, 2020). USGS’s own 2026 export-control table already lists the South African permit requirement. Beijing’s industry has shifted from importing ferrochrome to smelting imported ore, which makes the ore the chokepoint (Fastmarkets, 2025). The instrument is drafted: Cabinet approved chrome export restrictions in June 2025, consultation opened in October, and the presidency flagged export tariffs on chrome and manganese alongside the preferential electricity tariffs NERSA has granted.
What the bloc takes back is room to use it. South Africa’s 2025 export basket to China ran USD 13.56 billion, USD 9.51 billion of it ores, slag, and ash, so the retaliation surface is the mining economy itself (COMTRADE, 2026). Zimbabwe, Turkey, and Kazakhstan cap the tax at the margin. The same trade table states the truncation exactly: stainless flat products to China totalled under USD 100,000 in 2025, effectively zero manufactured stainless into the market its ore feeds. The chromium section found that membership purchased no industrial shield. The Bridge adds the harder finding: the bloc binds the seller, not the beneficiary.
The demand is therefore calibrated, not embargo-shaped: an ore export tax escalating with domestic smelting recovery, priced below the level that makes alternative ore worth qualifying. The restart economics support it. Eskom recorded 365 consecutive days without load-shedding on 16 May 2026 (Eskom, 2026), and the grid that serves the Bushveld PGM operations also serves the ferrochrome belt. PGM plants operated through the crisis while ferrochrome plants closed, and restarting closed capacity is faster than building new where furnaces remain technically recoverable. The manufacturing demand (stainless steel alloying) activates as the recovery sustains and the escalator gives it a protected market.
Lithium at roughly 2 per cent of global reserves carries minimal leverage in the supply chain context the Forced Choice defined, insufficient for supply management at the scale Kinshasa attempts with cobalt. Zimbabwe nonetheless retains licence-level bargaining power over individual projects, and its conditioning regime is exercising exactly that.
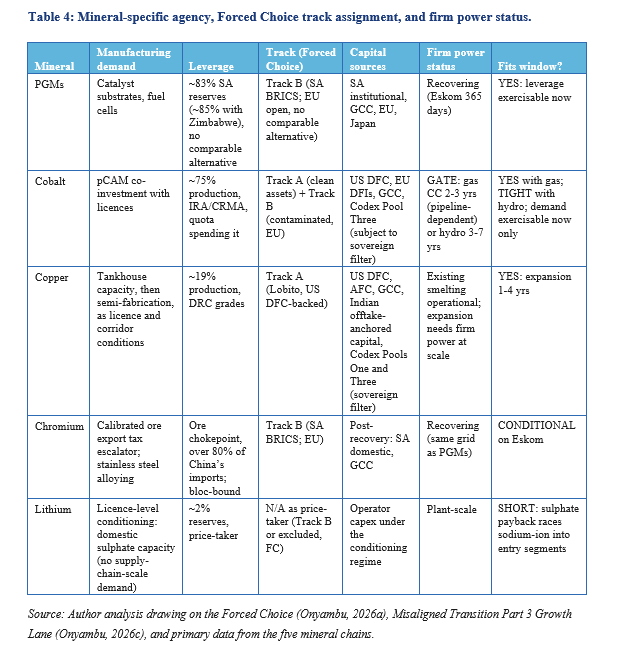
The firm power gate and the Growth Lane. Every manufacturing demand except PGMs at current scale requires either new firm power or grid reinforcement. The Misaligned Transition Part 3 specified the Growth Lane: gas open-cycle turbines (OCGT) at 1 to 2 years, gas combined-cycle at 2 to 3, geothermal at 3 to 5 where the geology permits, medium hydro at 3 to 7, and pumped hydro at 5 to 8 (Onyambu, 2026c). The timelines assume fuel supply, land, permits, financing, and grid connection are in place; Zambia and the DRC lack existing gas pipeline infrastructure, which extends the practical schedule.
The Growth Lane is not gas-only. Geothermal is cheaper (USD 50 to 80 per MWh) and label-eligible, but geography-limited to the East African Rift. Exploration risk runs USD 5 to 7 million per well with 20 to 40 per cent failure rates. Medium hydro fits the window at 3 to 7 years where project preparation is funded (Zambia has Ngonye Falls and Lunsemfwa Lower in development), but faces climate vulnerability. Both are label-eligible for concessional climate finance. Neither faces a classification constraint. Their binding constraints are exploration risk capital and project preparation funding. The Misaligned Transition Part 3 carries the full specification (Onyambu, 2026c).
Gas was the fastest across three criteria in that assessment: deployment speed, resource availability across African jurisdictions, and industrial-grade dispatchability. For the specific mineral-processing zones in this essay, no geothermal project pipeline exists at industrial scale within the window, the proven resource sitting on Rift branches away from the smelting belts. Medium hydro timelines are tighter still. The chains demonstrate the Misaligned Transition’s China finding, expansion with marginal substitution: renewable capacity expands while firm power remains the binding constraint for processing (Onyambu, 2026c). The series’ procurement record sharpens the gate. The same sovereign that contracted more than 6 gigawatts of variable renewables through REIPPPP had awarded zero gas capacity through GASIPPPP across three deadline extensions to May 2026 (Onyambu, 2026c). Gas is where the classification constraint binds: excluded from green bonds, climate funds, JETP structures, and most, though not all, DFI concessional windows; institutional policies differ. The pattern has a macro-financial precedent. Any country that channels investment into capacity the real economy cannot productively absorb, while accumulating the corresponding debt, eventually writes down the excess and allocates the hidden losses (Pettis, 2026). The energy equivalent is installed megawatts that cannot be dispatched for industrial processing while the sovereign carries the PPA obligations. The mineral equivalent is a smelter that cannot run. The consequence is observable at the mineral level. Processing relocates to wherever firm power exists unconstrained: China on coal, or Chinese-funded facilities elsewhere. The Misaligned Transition tested this across three green-labelled instruments and found consistent outcomes from structurally different instruments (Onyambu, 2026c). The Cathode Economy’s five mineral chains confirm the same structural outcome at the molecular level. The classification does not prevent the minerals from being processed. It shapes where the processing lands.
Scoring the strategic options. Four options are available to African mineral-producing countries; Table 5 profiles them on two axes. The Forced Choice assessed five strategic pathways and found fatal flaws in each, arriving at the Coalition of the Eligible as the least bad path. The Cathode Economy tests the options at the mineral level against seven variables drawn from the evidence of the five chains.
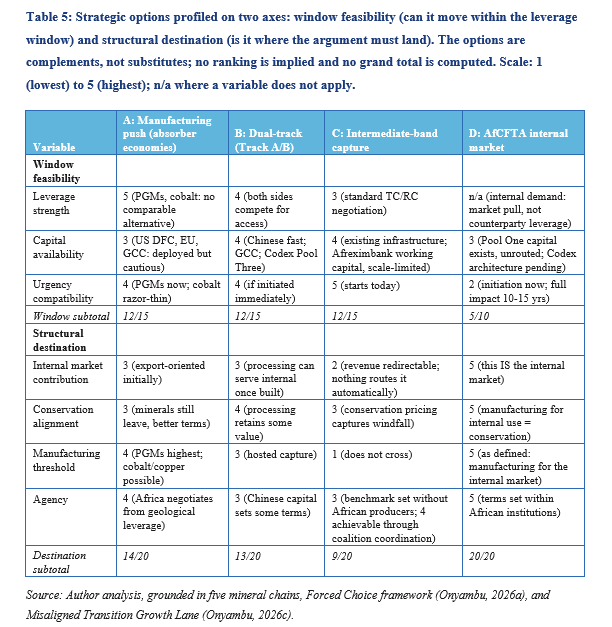
The scores are ordinal indicators of strategic friction, not cardinal optimisation, and the two subtotals are deliberately never summed. The four options are different kinds of object: an external industrial strategy, a partner architecture, a value-capture mechanism, and a demand destination. Ranking them against each other would imply substitution; the argument requires all four running simultaneously. Read by axis, the table says one thing clearly. Three options tie at 12 of 15 on window feasibility: they can move now. Option D scores 5 of 10 on its applicable window variables and a perfect 20 of 20 on destination. It is where the argument must land, and it cannot move alone: it needs A and B’s plants, C’s revenue, and firm power it does not generate. Option C is the mirror, the fastest mover and the weakest destination, the band that funds the crossing without making it. A and B are the Forced Choice facing outward, the absorber demands and the contamination-managed track; C and D are this essay’s inward-facing additions. The table extends Article 1’s assessment; it does not re-litigate it.
The options are not sequential. They are simultaneous. The leverage window demands it.
Intermediate-band capture is not abstract. Zambia is already doing it. Industrial Resources, the state’s joint venture with Mercuria, trades copper to capture margins that previously accrued to offshore intermediaries. The Local Content Regulations (Statutory Instrument No. 68 of 2025, effective January 2026) allocate an increasing share of core mining procurement to Zambian-owned firms, starting at 20 per cent and rising to 40 per cent. All non-core services are reserved for local companies. In 2025, First Quantum Minerals spent USD 2.14 billion on Zambian suppliers, supporting over 1,500 local businesses. Barrick’s Lumwana Mine procured USD 356 million from Zambian companies in the first half of 2025, 73 per cent of total purchases (Government of Zambia, June 2026). Anode slime capture, refining margin optimisation, conservation pricing on depleting minerals, trading company formation, and local content regulation are all mechanisms within the intermediate band. None crosses the manufacturing threshold. All generate the revenue a crossing must be financed from. Whether it does depends on where the state routes it, and nothing routes it there automatically.
The financial plumbing behind the band deserves the same scrutiny as the mechanisms. Offshore traders capture intermediary margins because they finance them: pre-export credit, inventory carry, and hedging are the services the margin pays for. Afreximbank’s structured trade finance substitutes that balance sheet for African traders, which is its specific claim to the band’s row in Table 6. The substitution has limits, though not the ones the ratings fight implies. Fitch cut the bank to junk and lost the mandate in January 2026; Moody’s held investment grade, and S&P restored it at BBB+ in June 2026. The constraint is scale, not access: a USD 42.3 billion balance sheet cannot carry a continental band alone. PAPSS earns a different row. It settles intra-African legs in local currencies, slime to Johannesburg, wire to Lubumbashi, which serves the internal market’s growth more than the band’s dollar-priced core. Regional currencies are the wrong instrument for the band itself: price discovery happens at the LME in dollars, and the settlement gain inside Africa is achievable through PAPSS without a monetary project. The deeper currency architecture is the Codex’s territory (Onyambu, 2026d).
The Forced Choice named the Coalition of the Eligible. This essay’s facts give it a workplan. The demands in Table 4 read country by country, but the chains do not: the corridor is tri-national with its Luanda platform already standing, the PGM position is Pretoria plus Harare at 85 per cent of reserves, and the TC/RC benchmark that hit zero was set in a bilateral negotiation no African producer sat in. Coordinated, the band’s terms change: joint assay and slime standards, common minimum offtake terms, shared trading capacity financed once instead of five times. Solo, each producer accepts the benchmark. Eligible together, they set the floor. That is the coalition’s intermediate-band function, and it is the opposite of the quota-style restriction the cobalt section indicts: coordination on terms and standards, not restriction of supply.
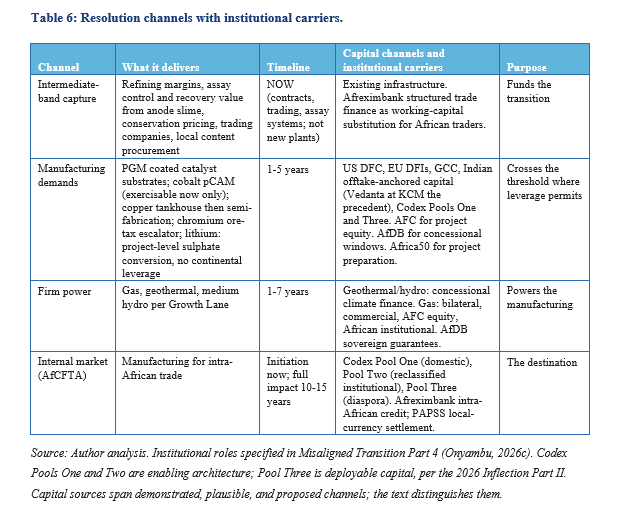
Domestic processing does not automatically mean African ownership. In both Morocco and Indonesia, processing facilities are substantially Chinese-financed. Value capture still occurs: jobs, tax revenue, infrastructure, industrial learning. But the full industrial multiplier requires domestic equity participation, technology transfer, and joint venture structures that build capability over time. The ownership question sits downstream of the processing question. Build the processing first, but write the terms before financial close: sunset clauses on tax holidays, equity participation ratchets tied to production milestones, technology transfer timelines, and local content escalation schedules embedded in the original licence, investment, and offtake agreements.
The mineral bridge is a bridge, not a destination. Critical minerals are the funding mechanism, not the endpoint. The intermediate-band value is real revenue that should be maximised during the window. It does not deliver manufacturing-stage industrialisation for external markets. It delivers the revenue and the industrial learning that funds manufacturing for the internal market.
Article 3 asks three questions. First, given the mineral bridge, which critical mineral-derived manufacturing reaches the AfCFTA internal market fastest: copper wire for African electrification, battery precursors for African energy storage, or catalyst components for African industrial use? These are still mineral value chains, but serving the internal buyer instead of the external one. They cross the manufacturing threshold because the buyer is African.
Second, beyond critical minerals, what about the non-critical extractive lane? Titanium, gold, soda ash, fluorspar, gemstones, industrial minerals. These face different demand drivers, different pricing structures, and different geopolitical exposure. The leverage window and supply chain capture dynamics that govern the five minerals examined here may not apply in the same way. The truncation argument needs testing mineral by mineral rather than assuming it transfers.
Third, beyond the extractive lane entirely, what non-extractive sectors constitute the absorption industries that 2.5 billion people require, and how does the AfCFTA create the market for them? Where is value created through enterprise rather than geology? Where does the Codex capital architecture channel investment into productive capacity that does not depend on geological endowment? The mineral bridge funds the transition. The non-extractive destination is what the transition builds. That is what “Beyond the Cathode” names.
7. Close
The title of this essay is The Cathode Economy. It could just as well be The Anode Economy, or The Hydroxide Economy, or The Ferrochrome Economy. The refining margin between anode and cathode is commercially real. But neither product enters a consumer’s hands or a firm’s production line without further transformation. The name of the intermediate product changes. The structural position does not.
Africa holds genuine leverage in specific critical minerals where geological concentration exists. That leverage is narrower than commonly claimed and faces a closing window. The leverage is not passive. It can be exercised to demand specific manufacturing investments as the price of access to minerals that no counterparty can replicate. But exercising it requires firm power, and the fastest firm power within the window is the energy the classification restricts. The non-critical extractive lane and the non-extractive absorption industries are different conversations with different dynamics. This essay covered the critical lane. The trilogy continues.
The forced choice is not only between Washington and Beijing. It is between accepting the intermediate band permanently, or building the foundation that makes the manufacturing threshold crossable. The three series that converge here, energy, minerals, and capital, are the same architecture at different layers.
The cathode economy is what Africa has. It is not what Africa needs.
Sources
Data cut-off: 18 July 2026.
Acerinox and Columbus Stainless, shareholding disclosures (Madrid and Middelburg, accessed July 2026). Acerinox 76 per cent, IDC 24 per cent.
African Union, Africa Mining Vision (Addis Ababa, 2009).
Argus Media and Kpler, trade-flow analysis of Copperbelt sulphur sourcing and the 2026 Hormuz disruption (2026).
Atlantic Council and US EXIM reporting on the FORGE reference-price framework and the Strategic Critical Minerals Reserve (Washington DC, 2026).
BHP, ‘How Copper Will Shape Our Future’, BHP Insights (Melbourne, September 2024).
Bipartisan Policy Center, Project Vault and the US Strategic Critical Minerals Reserve, analysis (Washington DC, 2026). USD 10 billion EXIM financing plus approximately USD 2 billion private.
Bloomberg, ‘Congo Orders Cobalt Miners to Give Up Unused Export Quotas’ (June 2026). ARECOMS quota framework and 96,600-tonne annual export caps for 2026-2027. Bloomberg reporting on Zimbabwe lithium producers’ deferral petition (June 2026) and the ministry’s rejection of the deferral (July 2026).
Botswana Ash (Botash), Sua Pan soda ash operations, producing since 1991 and supplying nine Southern African countries (Sowa, accessed July 2026).
Britannica, ‘Cobalt Processing’, updated 2025.
BTR New Material Group, Tangier cathode and anode materials project announcements (2025).
CATL and CHANGAN Automobile, ‘World’s First Mass-Production Sodium-Ion Passenger Vehicle’, launch announcement (Yakeshi, February 2026). Naxtra sodium-ion cells; mid-2026 market entry.
CNMC and Yunnan Copper, Lualaba Copper Smelter commissioning and capacity disclosures (Kolwezi, 2020); Kamoa Copper ten-year concentrate tolling agreement (May 2021); Mining Weekly, Kamoa-Kakula Copper Complex project update including Lualaba first-half 2026 output (July 2026).
CNBC Africa and Financial Afrik, Afreximbank ratings record 2025-2026. Fitch BBB- June 2025, cut to BB+ and withdrawn January 2026 after mandate termination; Moody’s Baa2 stable; S&P restoration to investment grade at BBB+ stable, 11 June 2026; total assets USD 42.3 billion at end-2025.
Cobalt Institute, Cobalt Market Report 2024 (Guildford, May 2025) and Cobalt Market Report 2025 (May 2026). Artisanal share estimates and DRC production shares; Indonesian HPAL cobalt as the second-largest national supply stream.
COBCO, ‘COBCO Inaugurates Its First Manufacturing Unit with a Capacity of 40,000 Tons’, Press release (Jorf Lasfar, June 2025).
COMTRADE (United Nations), South Africa exports to China, 2025 (accessed July 2026). Total USD 13.56 billion; ores, slag, and ash USD 9.51 billion; iron and steel USD 529 million, predominantly ferro-alloys; stainless flat products under USD 100,000.
Congressional Research Service, ‘Presidential 2025 Tariff Actions: Timeline and Status’, R48549 (Washington DC, 2026). Supreme Court ruling of 20 February 2026 on IEEPA tariff authority; Section 122 interim rate and expiry.
CopperTech Metals and Vedanta Resources, KCM launch disclosures (November 2025). Average ore grade 2.9 per cent; 3.3 per cent at the Konkola Deep Mine.
CrossBoundary Group, ‘Inside the Lobito Corridor: A Firsthand Look at Africa’s New Trade Route’ (Nairobi, July 2025).
CRU, chrome ore trade analysis cited in Mining.com (2020). South Africa supplied 12.5 million tonnes of chrome ore to China, more than 80 per cent of Chinese imports.
CRU BC Insight, ‘Sulphur and Sulphuric Acid in Southern Africa’ (November 2025). Zambian acid capacity of 3.9 million tonnes per year against roughly 1 million tonnes of consumption; smelter and sulphur-burning plant capacities. CRU via Fastmarkets, Chambishi Metals cobalt refinery capacity of 6,800 tonnes per year and estimated share of global cobalt metal supply (2018-2019).
Department of Trade, Industry and Competition (the dtic), Equity Equivalent Programme for multinationals (Pretoria); seven-OEM automotive transformation fund of ZAR 6 billion established in lieu of direct equity sales (2019).
ECFR, ‘From Ore to More: Mineral Partnerships for African Industrialisation’ (Berlin, September 2025).
Egmont Institute, ‘The Washington Agreements: Peace for Business is not Enough’ (Brussels, January 2026). US Department of State, Strategic Partnership Agreement between the United States and the DRC, published text (Washington DC, December 2025): the corridor targets apply to volumes the DRC and its SOEs elect to commercialise under their equity and contractual marketing rights. US-DRC Strategic Partnership Agreement signed 4 December 2025 alongside the Washington Accords: corridor targets of 50 per cent of copper, 90 per cent of zinc concentrate, and 30 per cent of cobalt through Lobito within five years; Strategic Asset Reserve designation. DRC-China deepened mining cooperation agreement of March 2026 including domestic processing commitments, as reported.
ERG Africa, Frontier operation disclosures (Sakania, accessed July 2026). Annual capacity of approximately 100,000 tonnes of copper in sulphide concentrate; largest DRC supplier of custom copper sulphide concentrate; location two kilometres from the Zambian border.
Eskom, system status announcement, 365 consecutive days without load-shedding (Johannesburg, 16 May 2026).
Eurostat, ‘Trade in Goods with China in 2025’ (Luxembourg, April 2026). EU 2025 goods deficit with China of EUR 359.8 billion.
Fastmarkets, cobalt market previews and DRC quota execution reporting (2025-2026). Consumer qualification of non-DRC feedstock including MHP and black mass; Indonesian cobalt-in-MHP supply growth; CMOC 2025 production against 2026 export allocation. Fastmarkets, ‘Global Ferro-Chrome Markets Navigate Supply Chain Shifts’ (October 2025): South Africa China’s largest ferrochrome import source in 2024 at 1.82 million of 3.66 million tonnes; chrome ore export-control consultation opened 3 October 2025; presidential announcement of export tariffs on chrome and manganese with preferential electricity tariffs.
Financial Times, ‘Big Tech AI Spending Approaches $700 Billion’ and related quarterly earnings reporting and company earnings releases (London, various April-May 2026).
First Quantum Minerals and Barrick, NI 43-101 technical reports and reserve statements for Kansanshi, Sentinel, and Lumwana (various). Reserve grades between roughly 0.5 and 0.9 per cent copper; chalcopyrite-dominant sulphide mineralogy; the December 2014 Lumwana suspension announcement; grade declines noted in USGS Minerals Yearbook reporting.
Friedland, Robert, Chairman of Ivanhoe Mines, quoted in various reporting on Gulf sulphur supply disruption (March 2026).
S&P Global, trade analysis of continental sulphur import shares (2026). Continental Gulf share near 48 per cent in 2025.
Ghana Gold Board (GoldBod) and Ghana Chamber of Mines, increase of mandatory state gold purchases from large-scale miners to 30 per cent, applied to gold in doré form, effective 1 July 2026, reported in Reuters and regional financial press (Accra, June 2026).
Global Carbon Project via Our World in Data, cumulative and annual CO2 emissions by region (accessed July 2026). Africa below 3 per cent of cumulative fossil CO2 emissions; 3.4 to 4 per cent of annual emissions.
Government of Zambia, Ministry of Finance and National Planning, ‘Angola, Democratic Republic of Congo, and Zambia Agree on Concrete Steps to Accelerate Development of the Lobito Corridor’, Press statement (Lusaka, February 2026).
Government of Zambia, Office of the Chief Communications Specialist, Local Content Regulations (Statutory Instrument No. 68 of 2025) implementation data, cited in Mwebantu (Lusaka, June 2026). First Quantum and Barrick procurement figures.
Hait, J., Jana, R.K. and Sanyal, S.K., ‘Processing of Copper Electrorefining Anode Slime: A Review’, Mineral Processing and Extractive Metallurgy (Transactions of the Institutions of Mining and Metallurgy, Section C), 118(4), pp. 240-252 (2009). Slime yield range.
ICSG, The World Copper Factbook 2025 (Lisbon, October 2025). ICSG Table 2: World Refined Copper Production and Usage by Region (Lisbon, updated May 2026). Africa mine production, refinery production, and refined usage figures.
IDC (Industrial Development Corporation), ‘Opportunities for Downstream Value Addition in the PGMs Metals Value Chain’ (Johannesburg, 2018). DMR data showing under 3 per cent of platinum and palladium sold into the domestic market; five international fabricators purchasing more than 85 per cent of PGMs from refiners; converter industry consumption of domestic stainless steel.
IEA, Global Critical Minerals Outlook 2025 (Paris, 2025). China refined cobalt dominance and cathode production concentration data.
IEA, ‘Copper Prices Have Hit Record Highs, But Smelters Face Mounting Strategic Pressures’, Commentary (Paris, 2026). Zero TC/RC benchmark settlement.
IEA, ‘Global Battery Markets Are Growing Strongly’, Commentary (Paris, February 2026). LFP past half of the EV battery market in 2025.
INFACON conference literature and USGS, ferrochrome smelting energy intensity data, approximately 3,200 to 4,200 kWh per tonne.
IPIS, ‘Infrastructure, Extraction, and Accountability around the Lobito Corridor in Southern DRC’ (Antwerp, February 2026).
ISS (Institute for Security Studies), ‘AGOA Changes Add to Africa’s Rollercoaster Ride of US Tariffs’ (Pretoria, 2026). South African vehicle exports to the US down almost 75 per cent in 2025, from 25,544 to 6,530 units, with total exports a record on redirection to other buyers; AGOA extended to 31 December 2026 retroactively, signed February 2026. ISS, ‘Why Minerals-for-Security Deals Won’t Save the DRC’ (Pretoria, April 2026): US sanctions on Rwandan army officials and the Rwanda Defence Force in March 2026.
Ivanhoe Mines, 2025 Production Results and 2026 Production Guidance (January 2026); Kamoa-Kakula Updated Mineral Reserve Estimate and Revised 2026 Guidance (March 2026); Q1 and Q2 2026 Production Releases (Johannesburg, April and July 2026).
Johnson Matthey, PGM Market Report (London, May 2026). Platinum and palladium secondary supply shares.
KoBold Metals and Lobito corridor reporting (2024-2026). Mingomba MOU for over 300,000 tonnes of copper per year via the corridor; construction of the 800-kilometre Zambia-Lobito greenfield rail link targeted from the second half of 2026, subject to financial close.
Konkola Copper Mines, operations and products disclosures (Chingola, accessed July 2026). Copper-cobalt alloy production at the Nchanga smelter and sales to Asian markets; anode slime as an exported refinery byproduct.
Metal Bulletin, Anode slime pricing data (London, August 2018).
Minerals Council South Africa, industrial electricity tariff escalation data, cited in Reuters and CNBC Africa reporting (2026).
naamsa | The Automotive Business Council, Automotive Trade Manual 2026 media release (Pretoria, May 2026). Catalytic converters at 26 per cent of automotive component exports; component exports of ZAR 61.2 billion in 2025, down 3.5 per cent on the converter decline; record 414,271 vehicles exported; automotive trade at 15.6 per cent of total South African exports.
NERSA, preferential ferrochrome electricity tariff approval, 62c/kWh for Samancor Chrome and the Glencore-Merafe venture (Pretoria, May 2026).
Onyambu, Dean N. (2025), ‘EVs Are the Last Mile, Not the First Mile’, Canary Compass (December 2025).
Onyambu, Dean N. (2026a), ‘The Forced Choice’, Canary Compass (February 2026). Policy architecture: absorber and surplus distinction, dual-track framework, Coalition of the Eligible, leverage window, and the ‘Track B or excluded’ Zimbabwe assignment.
Onyambu, Dean N. (2026b), ‘Africa Macro Note: The Acid Test’, Canary Compass (13 April 2026). Zambian Copperbelt mineralogy, sulphide versus oxide routes, the Gulf disruption’s transmission to sulphuric acid, DRC acid inventories, and the zero TC/RC settlement.
Onyambu, Dean N. (2026c), ‘Africa Energy Series: Misaligned Transition’, Parts 1-5, Canary Compass (May-June 2026). Part 2: expansion with marginal substitution. Part 3: Growth Lane timelines and the REIPPPP-GASIPPPP procurement record. Part 4: Misaligned Capital, the Foundation Layer.
Onyambu, Dean N. (2026d), ‘The 2026 Inflection’, Part II, Canary Compass (April 2026). Codex pool architecture: Pools One and Two as preconditions, Pool Three as deployable capital under the sovereign filter.
Onyambu, Dean N. (2026e), ‘Quick Take: The Shock That Is Not One’, Canary Compass (19 March 2026). Real-time mapping of the Gulf disruption’s transmission to Zambian fuel, fertiliser, and mining inputs.
Pettis, Michael, X (formerly Twitter), response to Brad Setser on non-productive investment and lost decades (June 2026). Applied to energy capital misallocation in the African context. Cited as commentary, not as a data source.
Rand Refinery, services and smelting complex disclosures (Germiston, accessed July 2026). Copper anode slimes listed among materials treated; sourcing from customers in Africa and internationally.
Reuters, ‘Gotion High Tech Morocco Gigafactory to Start Production in 2026’ (May 2025).
Reuters and Euronews, European Commission proposal of 16 December 2025 replacing the 2035 zero-emission requirement with a 90 per cent CO2 cut, permitting plug-in hybrids and range extenders beyond 2035; negotiations from January 2026 (Brussels).
Reuters, ‘Antofagasta Agrees Zero Copper Processing Charges for 2026 with Chinese Smelter’ (December 2025).
Reuters, ‘Zimbabwe to Introduce Lithium Export Quotas, Sets Conditions for Resumption of Shipments’ (April 2026). Ministry letter of 2 April 2026; 10 per cent export tax; 2025 spodumene export volume.
Reuters, ‘Zambia Eases Ban on Sulphuric Acid Exports to Congo as Stocks Recover’ (May 2026); Zambia SI No. 17 of 2026 permit system.
Reuters, ‘Zambia Extends Duty-Free Copper Concentrate Export Duty Waiver Amid Smelter Outages’ (June 2026).
S&P Global, ‘Zimbabwe to Ban Lithium Concentrate Exports from 2027 to Boost Refining’ (June 2025).
S&P Global Market Intelligence, ‘Indonesia Navigates Nickel Market with Output Cuts, Policy Shifts’ (December 2025).
SAIMM (Dewar, N.), ‘The Catalytic Converter Industry in South Africa’ (Johannesburg, 2012). Peak beneficiation of roughly 15 per cent of locally mined PGMs into catalytic converters; industry capacity of 23.7 million units; near-total export orientation.
Tanzania Mining Commission and Bank of Tanzania, directive requiring mining companies and gold traders to reserve at least 20 per cent of exported gold for purchase by the central bank, announced September 2024 and effective from October 2024, reported in Reuters (Dar es Salaam, September 2024).
Tata Chemicals Magadi, Lake Magadi soda ash operations, Africa’s largest producer, expansion toward 1 million tonnes per annum announced for mid-2027 start-up (Magadi, accessed July 2026).
TAZARA revitalisation agreement, Zambia, Tanzania, and China (Beijing, 29 September 2025). CCECC 30-year concession, USD 1.4 billion investment, 32 locomotives and 762 wagons, three years of rehabilitation followed by 27 of operation, USD 15 million annual concession fee (Ministry of Transport and Logistics, Lusaka; Railways Africa, 2026).
Trafigura, Aurubis and Kamoa Copper, announcement of the first sale of low-carbon copper anodes from Kamoa-Kakula, delivered via the Lobito Corridor to Aurubis’ Olen refinery in Belgium (February 2026). Ivanhoe Mines Q1 2026 production release: first anodes reached the Port of Lobito after approximately one week by rail.
UN Comtrade via TrendEconomy, Zambia exports by HS code (2022-2023). HS 7402 unrefined copper and anodes at USD 6.1 billion (2022) and USD 5.0 billion (2023) against HS 7403 refined copper at USD 1.9 billion and USD 1.6 billion.
UNCTAD, ‘AGOA Expiry Impact on African Export Diversification’ (Geneva, October 2025). US tariff incidence on African goods graded by stage: manufactures and agricultural goods at duties two to three times those on fuels and minerals; exporters of mined commodities least affected.
UNECA, African population estimates (Addis Ababa, 2024). Continental population crossing 1.5 billion.
UNU-WIDER, ‘Boosting Mineral Revenues in Zambia’, Working Paper 2021/178 (Helsinki, 2021). Fiscal regime instability and its consequences. Zambia Chamber of Mines, ‘Taxing the Mining Sector’ (Lusaka, 2018), cited in IGC analysis. One tax change every 18 months on average since 2001.
UNZA, ‘Review of Zambia’s Potential for More Value’, Journal of Natural and Applied Sciences (Lusaka, 2023). KCM anode slime production and valuation data.
US Bureau of Mines, Minerals Yearbook, Zambia chapter (Washington DC, 1974). Copper sludges and slimes shipped abroad for recovery of gold, silver, and selenium; planned recovery plant near the Ndola Copper Refinery sized at 1,300 to 1,500 tonnes of slime per year.
USGS, Mineral Commodity Summaries 2026 (Reston, January 2026). PGM, copper, and lithium reserve figures; earlier vintages carried lower world totals and lower DRC copper reserves. Zambian cobalt reserves near 270,000 tonnes against a DRC total near 6 million and an MCS 2026 world total of 12 million; USGS historical series for Zambian cobalt output of 7,800 tonnes and third global rank in 2008. Chromium: South Africa the leading chromite producer at 23 million tonnes of a 51 million tonne world total in 2025, with 2024 revised to 22.9 of 49.6 million tonnes; potential South African export controls and tariffs noted as a factor for Chinese ferrochromium production. MCS 2026: South African chromite 23 million tonnes of a 51 million tonne world total in 2025; DRC cobalt quota 96,600 tonnes with a 9,600 tonne stockpile carve-out; South African chromium ore export permit controls listed in the export-control table; world PGM reserve total tabulated as a minimum.
World Bank, GNI per capita, Atlas method, Zambia (2025 data release). USD 1,260 for 2024.
Zambia Chamber of Mines, ‘Mines Not Exporting Copper Concentrate, Says Chamber Chief’, Press statement (Kitwe, June 2017). Refinery capacity constraint consistent with the 2025-26 waiver record.
Zambia Ministry of Mines and Minerals Development, first quarter 2026 production statement by Minister Paul Kabuswe, reported in Zambia Monitor (Lusaka, May 2026). Cobalt output driven by copper-cobalt alloys at KCM and recovery of cobalt contained in copper anodes.
Zamefa (Metal Fabricators of Zambia Plc), investor relations disclosures and Annual Report 2025 (Luanshya, accessed July 2026). Ultimate parent Reunert Limited of Johannesburg, held through Reunert International Investments (Mauritius); copper rod and cable product range; exports at 74 per cent of 2025 revenue; 2025 revenue of ZMW 3.45 billion driven by metal price increases, profit after tax of ZMW 63.5 million against ZMW 179.4 million in 2024. Reunert Limited, interim results for the six months to 31 March 2026 (Johannesburg, May 2026): record raw material commodity prices driving working capital investment in the power cable businesses.
Disclaimer
This article does not constitute legal, financial, or investment advice. The author shares views for perspective and discussion only. Do not rely on them as a substitute for professional advice tailored to your specific circumstances. Always consult a qualified legal, financial, investment, or other professional adviser before making decisions based on this content. The analysis reflects proprietary research undertaken by Canary Compass and the author.
Canary Compass and the author accept no liability for actions taken or not taken based on the information in this article.
The views expressed in this article represent the author’s independent professional analysis and do not constitute an endorsement of any individual, institution, or position. Canary Compass and the author accept no responsibility for how this content is interpreted, excerpted, or recontextualised by third parties not involved in its production and publication. Reproducing any portion of this work in isolation, or in combination with other material, in a manner that misrepresents the author’s original meaning constitutes a distortion of the published record.
The author may hold positions in financial instruments, currencies, or assets discussed or referenced in this publication. Such positions do not constitute a recommendation to buy or sell.
All views, projections, and forecasts reflect the author’s assessment at the time of writing. Data sourced from third parties is believed to be reliable but has not been independently verified. Past performance does not indicate future results.
All content published by Canary Compass is the intellectual property of the author. Reproduction, adaptation, or redistribution, in whole or in part, requires written permission.
About the Author
Dean N. Onyambu is the Founder and Chief Strategist of Canary Compass, a financial research publication focused on African monetary architecture and financial sovereignty. He brings 18 years of experience across trading, fund leadership, and economic policy, with senior roles at Standard Bank, First Capital Bank, and Opportunik Global Fund.
Read and subscribe at www.canarycompass.com.
The Canary Compass Channel is available on @CanaryCompassWhatsApp for economic and financial market updates on the go.
For more insights from Dean, you can follow him on LinkedIn @DeanNOnyambu or X @InfinitelyDean.