
THE FORCED CHOICE
Absorber Economies, Surplus Economies, and the Closing Window: A Working Paper | 60–75-minute read

AI-generated image of the Forced Choice
Abstract
This working paper examines Africa’s strategic position in critical mineral supply chains amid intensifying US-China competition. Applying value chain analysis, Porter’s Five Forces, VRIO, and Ansoff Matrix frameworks, the analysis finds that African mineral leverage is narrower than commonly claimed but strategically significant where geological concentration exists; principally in platinum group metals (PGMs, Africa holds 79 per cent of global reserves, concentrated in South Africa) and cobalt (55 per cent of reserves, over 70 per cent of production). This leverage faces a closing window five to seven years before battery chemistry substitution erodes bargaining power.
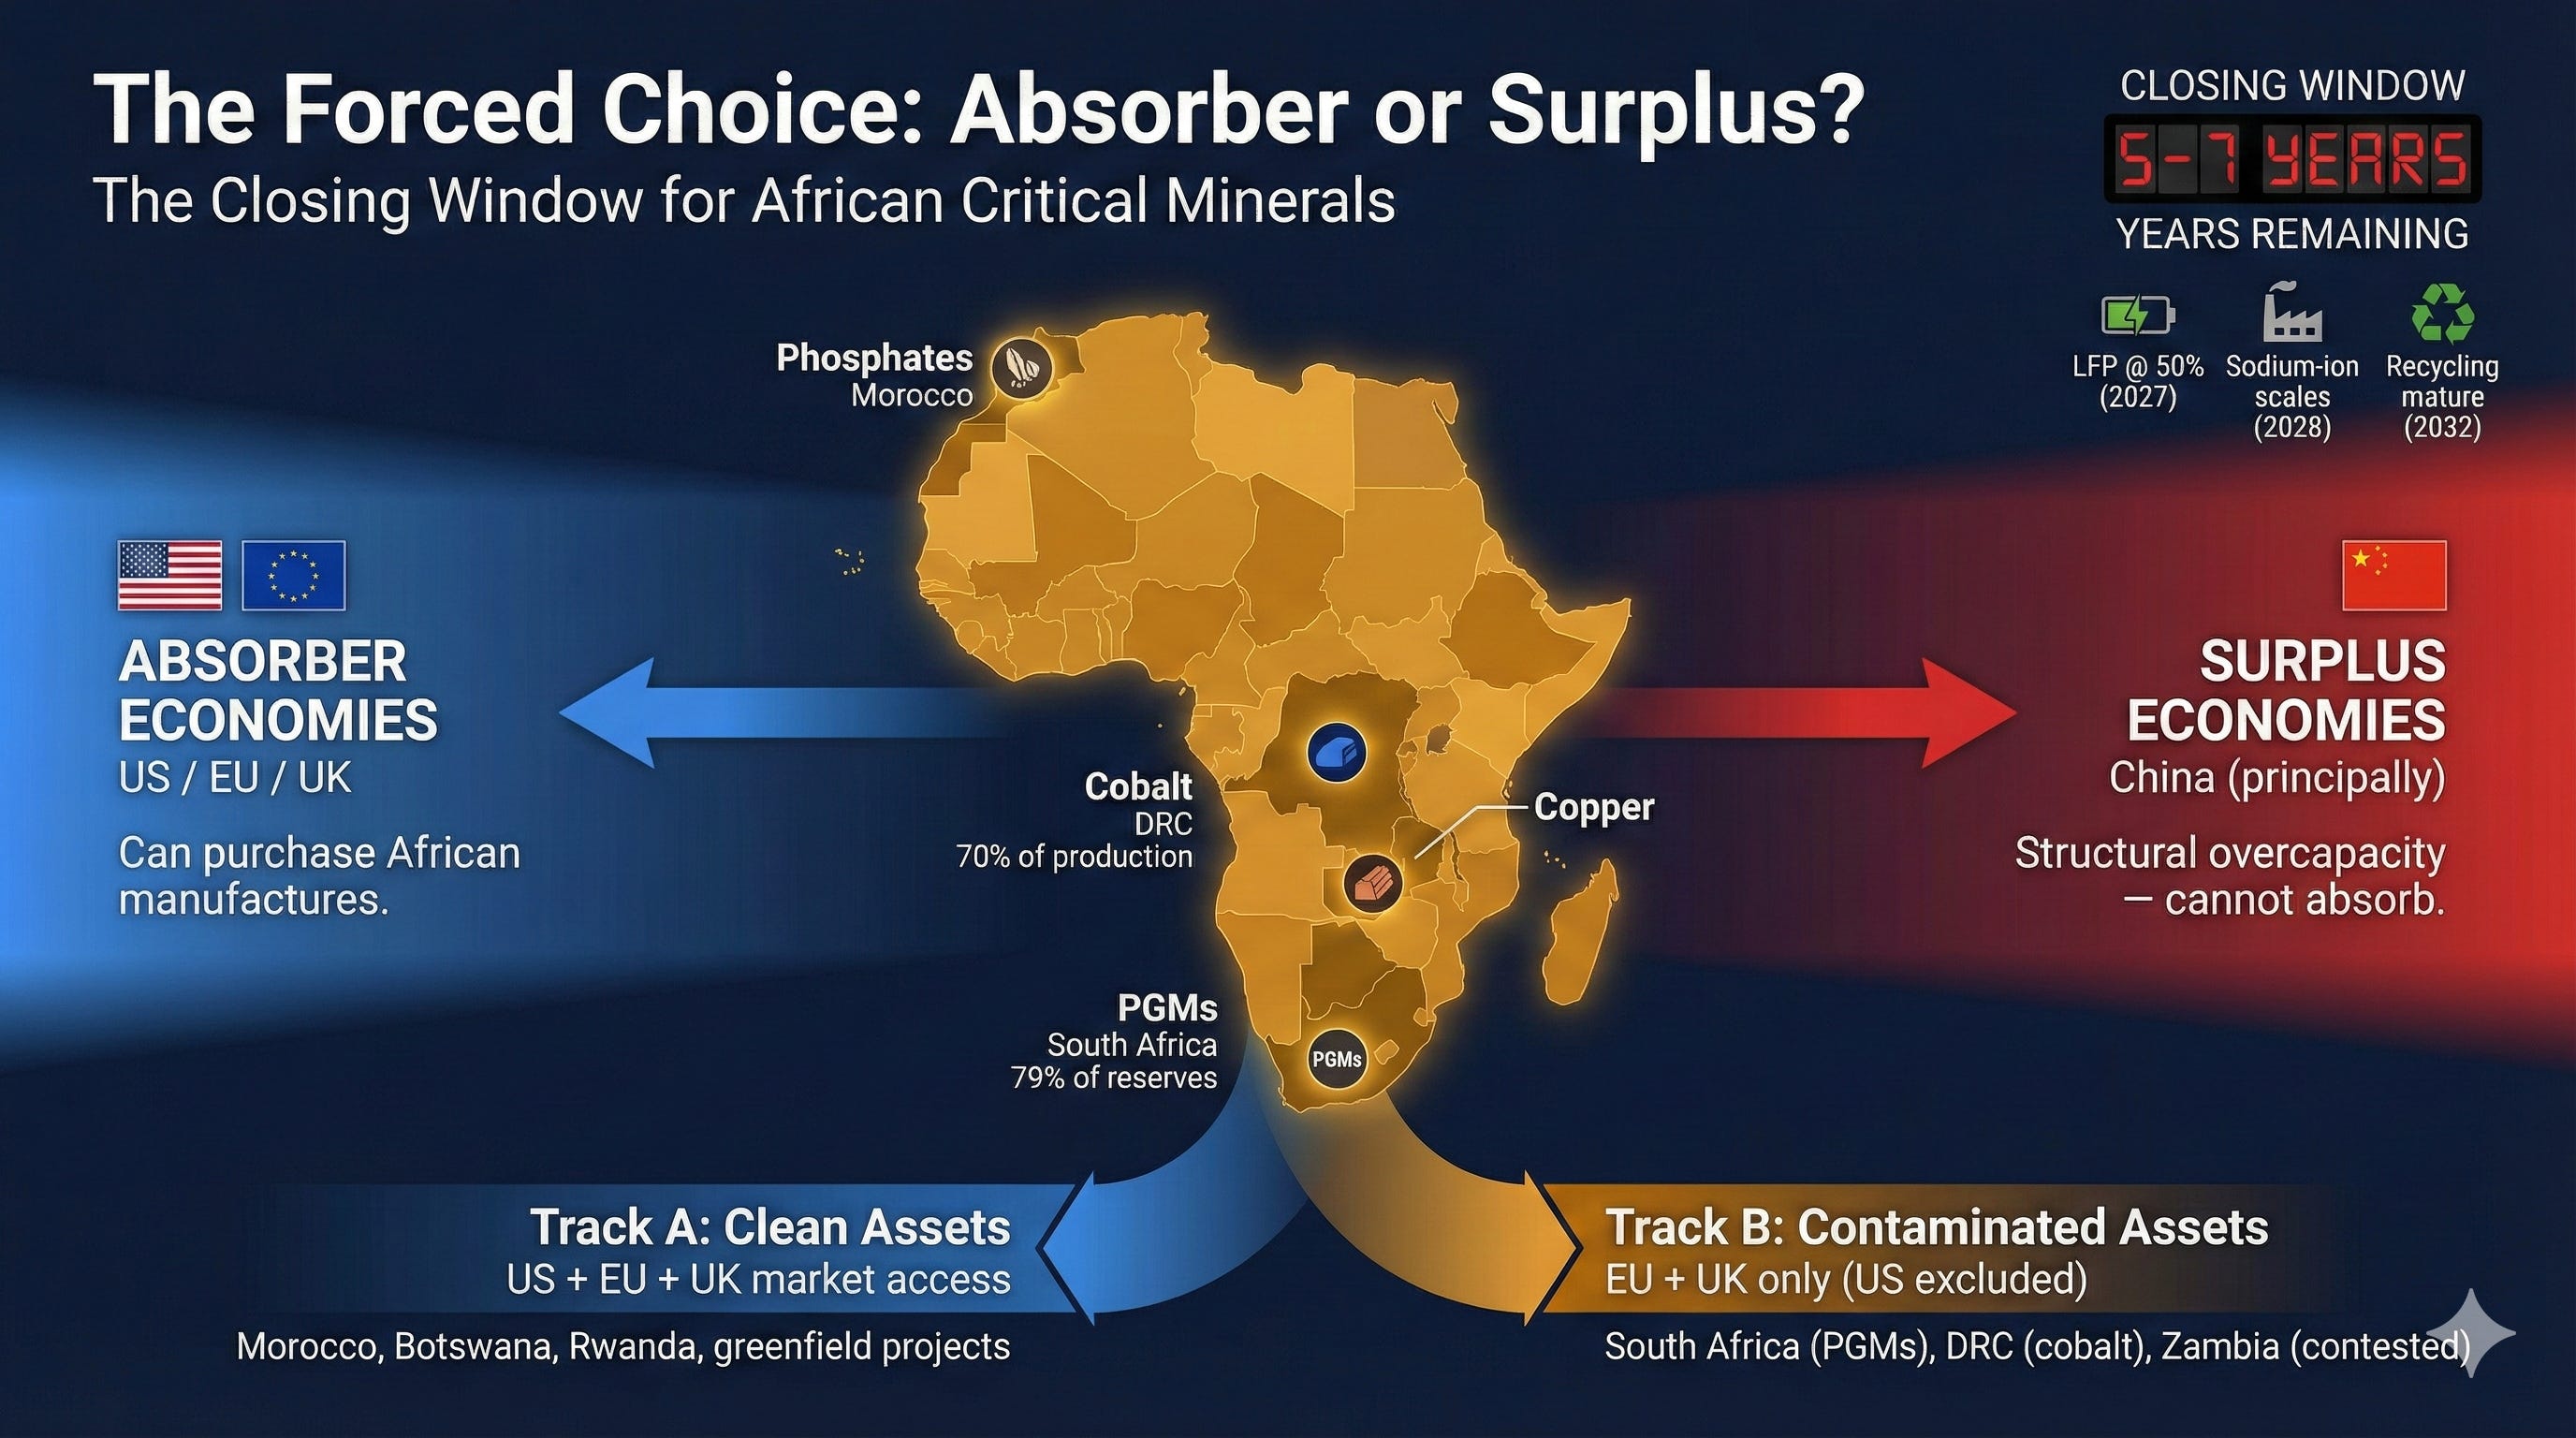
The paper introduces a structural distinction between absorber economies (United States, European Union) that can purchase African manufactures and surplus economies (principally China) whose overcapacity prevents them from serving as markets for African industrial output. This distinction governs which partnerships can deliver industrial upgrading rather than permanent commodity extraction.
Five strategic pathways are assessed: strategic autonomy, full China alignment, full US alignment, the Carney middle-power model, and EU/UK diversification. Each faces fatal flaws. The paper proposes a ‘Coalition of the Eligible’ operating on two tracks: Track A for assets with clean access to all absorber markets, Track B for contaminated assets accessing EU/UK markets only, as the least bad pathway for converting geological leverage into industrial capacity before the window closes.
Keywords: critical minerals, Africa, industrial policy, supply chains, US-China competition, cobalt, platinum group metals
Executive Summary
This working paper addresses critical minerals as defined by the US Inflation Reduction Act and EU Critical Raw Materials Act: the minerals essential to battery manufacturing, renewable deployment, and grid expansion whose supply chains are subject to geopolitical contestation. These include cobalt, lithium, nickel, manganese, graphite, platinum group metals (PGMs), and increasingly copper. The analysis does not address bulk industrial minerals such as iron ore or bauxite except where they intersect with critical mineral supply chains.
This paper distinguishes between two categories of major economy in the critical minerals supply chain. Absorber economies (the United States and European Union) consume processed minerals to manufacture finished goods. They import refined materials and components. Surplus economies (principally China) process raw materials into refined inputs and export the surplus. The absorber needs the mineral; the surplus economy controls the processing. Africa sits upstream of both, supplying raw material to whoever pays.
The commonly cited claim that Africa holds 30 per cent of global mineral reserves requires qualification. Bright Simons of IMANI and ODI has traced this figure to a 2002 African Development Bank paper with no subsequent verification. The actual data is more nuanced: Africa dominates in a handful of specific minerals but is a minor player in most others. Lithium reserves stand at 1.6 per cent of the global total. Rare earths at 2 to 3 per cent. These are marginal positions.
Yet Africa receives barely 10 per cent of global exploration spending, a share that has declined from 16 per cent in 2004. Sub-Saharan Africa is the most cost-effective region globally for mineral exploration. Australia and Canada, with combined landmass one-third Africa’s size, together receive three times the exploration investment. The gap between potential and capital flow is structural, not geological. The leverage that exists is narrower than commonly assumed but strategically significant where it does exist.
The Democratic Republic of Congo produces over 70 per cent of global cobalt. Africa holds 79 per cent of global platinum group metal reserves, concentrated in South Africa’s Bushveld Complex. These geological concentrations create genuine leverage. That leverage faces a closing window of five to seven years before substitutes mature and bargaining power erodes. Platinum group metals and cobalt represent genuine chokepoints. For these minerals, there is no alternative source at scale. The question is whether Africa can convert this narrow window of geological advantage into lasting industrial capacity before substitution renders it moot.
Four analytical frameworks converge on a single verdict. Value chain analysis shows Africa trapped at extraction while value accumulates elsewhere. Porter’s Five Forces confirms leverage exists but diminishes with time as substitutes advance. VRIO analysis identifies organisation as the missing criterion: Africa possesses valuable, rare, and difficult-to-imitate resources but lacks the continental coordination to capture value from them. The Ansoff Matrix directs strategy toward the only viable quadrant: diversification into new products (processed minerals) sold to new markets (absorber economies that can purchase them).
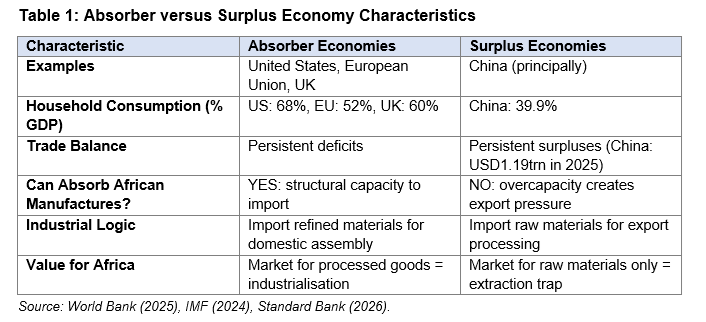
The structural distinction that governs outcomes is between absorber and surplus economies. Absorber economies run persistent trade deficits and consume more than they produce. They can purchase African manufactures. The United States is the paradigm, with household consumption at 68 per cent of GDP. Surplus economies produce more than they consume. China is the paradigm, with household consumption suppressed to 39.9 per cent of GDP and a goods trade surplus exceeding USD1.19 trillion in 2025.
China consumes domestically, including high-end goods. The issue is overcapacity. Chinese manufacturing capacity exceeds what domestic consumption absorbs, creating structural export pressure. Until China demonstrates sustained demand for external manufactures rather than commodities alone, it cannot serve as an absorber market for African industrialisation. Strategic autonomy has narrowed sharply. India faced tariffs of 50 per cent until 2 February 2026, when a trade deal reduced rates to 18 per cent in exchange for abandoning Russian crude imports and committing USD500 billion in American purchases, the price of alignment made explicit. South Africa faces 30 per cent tariffs as a BRICS member.
The United States reads balanced engagement as strategic ambiguity and responds with punishment. Every pathway available to African policymakers has fatal flaws. Strategic autonomy depletes leverage while Chinese lock-ins deepen. Full US alignment excludes contaminated countries where most leverage exists. The Carney Model of middle-power coalition-building requires coordination capacity Africa lacks within the leverage window.
The Coalition of the Eligible is the least bad pathway. It operates on two tracks: Track A for countries and assets with clean access to absorber markets, Track B for countries where US access is effectively closed due to BRICS membership or contamination but where EU and UK access remains available. Both tracks share a common purpose: building the capital, technology, and institutional capacity that eventually enables genuine autonomy.
The Coalition is transitional. Its purpose is to serve as a bridge to domestic depth, not permanent Western alignment. The goal is accumulating the foundation that makes future autonomy viable. Without this bridge, Africa arrives at the post-leverage world with nothing built. This analysis is conditional. It assumes mineral-led industrialisation remains Africa’s strategic objective. Whether that objective is correct (whether agriculture, services, technology, or other sectors offer more viable pathways) is a question this working paper does not attempt to answer.
What follows establishes the least bad path if the mineral route is pursued.
I. The Rupture
On 20 January 2026, Mark Carney addressed the World Economic Forum in Davos with a message that has defined the subsequent discourse: the global trading system is experiencing a rupture, not a transition. The distinction matters. Transitions imply managed adjustment, gradual reorientation, time to position. Ruptures create discontinuity. The rules that governed the previous era no longer apply. New rules have not yet stabilised. For decades, countries like Canada prospered under what Carney called the rules-based international order.
The story was partially false (the strongest would exempt themselves when convenient) but the fiction was useful. It provided a framework for trade, investment, and cooperation that benefited middle powers. That fiction has ended. Great powers can afford to go it alone. They have the market size, the military capacity, and the leverage to dictate terms. Middle powers do not. The Carney prescription follows: when we only negotiate bilaterally with a hegemon, we negotiate from weakness. We accept what is offered.
We compete with each other to be the most accommodating. This is not sovereignty. It is the performance of sovereignty while accepting subordination. The alternative is combination. In a world of great power rivalry, the countries in between have a choice: compete with each other for favour, or combine to create a third path with impact. If you are not at the table, you are on the menu. The evidence of rupture arrived simultaneously across multiple fronts. On 29 January 2026, British Prime Minister Keir Starmer landed in Beijing with sixty business executives, the highest-level UK delegation to China in years.
The UK trade deficit with China has widened sharply. Starmer’s message was pragmatic necessity: like it or not, China matters for the UK. In January 2026 alone, Xi Jinping hosted the leaders of Canada, Ireland, Finland, South Korea, and the United Kingdom. Beijing is weaponising access to its market while Western allies compete for favour. The same week, the European Union finalised terms on its trade agreement with India, eliminating 96.6 per cent of tariffs on EU exports to a market of 1.45 billion people.
The EU-Mercosur agreement, signed in Asunción on 17 January 2026 after twenty-five years of negotiation, now faces a turbulent ratification phase. Just four days after signing, the European Parliament voted to refer parts of the deal to the European Court of Justice for legal review, a process that could delay final ratification by months or years. Five EU member states voted against: Austria, France, Hungary, Ireland, and Poland, largely due to agricultural sector pressure. The European Commission is pushing for provisional application of trade provisions while the legal review proceeds.
Secretary of State Marco Rubio convenes a Critical Minerals Summit in Washington on 4 February 2026, pressing African delegations on supply chain commitments. Each of these developments reflects the same underlying dynamic. The major economies are scrambling to secure supply chains, lock in market access, and position themselves for a trading environment that no longer operates on multilateral consensus. Those who secure position survive. Those who hesitate find themselves on the menu rather than at the table.
The same day Starmer landed in Beijing, on 29 January 2026, Zambian President Hakainde Hichilema addressed the diplomatic corps in Lusaka. His message could not have differed more sharply from Carney’s prescription. We are too small, Hichilema said. Do not drag us into your geopolitics. The contrast is instructive. Carney leads a country of forty million people with 75 per cent export dependence on the United States. His response to American pressure has been to pursue twelve trade deals across four continents in six months, sign an agreement with China on electric vehicles, and tell the Trump administration directly: I meant what I said.
Hichilema leads a country rich in copper, positioned at the heart of the Lobito Corridor, holding leverage that Carney would trade significant resources to possess. His response has been to accept yuan-denominated royalties and mining tax payments, declare neutrality, and request that great powers leave Zambia out of their competition. Canada can afford to pursue strategic diversification because it has something to offer every partner. Zambia has chosen to wait for favourable terms rather than extract value from its position.
One approach builds leverage. The other watches leverage erode. Canada’s experience offers a cautionary template. Within days of Prime Minister Carney’s Davos speech declaring the rules-based order in rupture, the United States responded with tariff threats, rescinded diplomatic invitations, and reportedly engaged Alberta separatists seeking independence. Treasury Secretary Bessent publicly claimed Carney had “walked back” his remarks, a claim Carney denied from Ottawa: “To be absolutely clear, and I said this to the president, I meant what I said in Davos.” The episode illustrates the costs of even rhetorical defiance.
Canada is a G7 member, NATO ally, with integrated North American supply chains. African states lack comparable leverage. If Canada faces immediate retaliation for stating the obvious, the space for African diplomatic ambiguity is narrower still. As geopolitical analyst Velina Tchakarova observed in January 2026: “Middle powers incorporated into the plethora of American security and defence networks don’t have the choice of equidistance between America and China as they’ll be confronted with the reality of picking a side amid the New Cold War.
Or decouple from the US.” Her strategic foresight identifies Africa (particularly the Horn and Sahel) as a zone of growing volatility precisely because it sits outside established alliance structures, making it contested terrain where supply chain securitisation and raw materials access drive alignment pressure. The forced choice is now explicit. The question is not whether to choose. The question is whether to choose deliberately, extracting value for the choice, or by default, receiving nothing.
II. The Trade Reality
The Reversal
In 2000, total trade between China and Africa stood at USD11.67 billion. The relationship was relatively balanced. By 2025, China-Africa trade had reached USD295 billion, with African exports at approximately USD108 billion and imports from China at USD187 billion according to MOFCOM data. China has been Africa’s largest trading partner for sixteen consecutive years. US-Africa trade peaked at USD66 billion in 2008, then collapsed toward 2000 levels. UNCTAD data confirms the structural shift: Africa’s trade dependence on China has become systemic.
The Composition
The volume shift matters less than what moves through these corridors. 89 per cent of Africa’s exports to China come from extractives: crude oil, copper, iron ore, cobalt, and aluminium. 6 per cent is agriculture. 5 per cent is manufacturing. In the opposite direction, 94 per cent of China’s exports to Africa are manufactured goods. Africa exchanges rocks for finished goods. By 2025, Africa’s bilateral goods deficit with China was roughly USD80 billion.
The Surplus
In 2025, China’s goods trade surplus reached USD1.19 trillion. Exports rose 5.5 per cent year-on-year while imports remained flat. Exports to Africa surged 25.8 per cent. Since 2019, Chinese export volumes have risen 40 per cent while import volumes have risen 1 per cent. Standard Bank analysis shows 2025 retail sales growth of 2.7 per cent for the year, with growth slowing into outright decline by December. Household consumption remains stuck around 39.9 per cent of GDP. Real retail sales remain well below their pre-pandemic trend, with a gap of roughly ten trillion yuan of missing consumption.
This is export pressure being pushed outward. Africa is among the fastest-growing destinations for that push.
The Debt Composition
More than 42 per cent of African external debt is owed to private creditors. 23 per cent is owed to bilateral creditors. 34 per cent is owed to multilateral institutions. A 2022 study found that approximately 35 per cent of Africa’s external debt is held by Western banks, asset managers, and oil traders, compared to 15 per cent by Chinese lenders. The China debt trap narrative is overstated in volume terms. The issue with Chinese lending is structure, not volume: tied procurement, yuan denomination risk, opacity in contract terms, and technology hoarding remain problematic regardless of debt stock size.
III. The Surplus Economy Trap
The Absorber Distinction
The structural distinction that governs industrial outcomes is between absorber and surplus economies. Absorber economies run persistent current account deficits. They consume more than they produce. They can purchase African manufactures. The United States is the paradigm: household consumption at 68 per cent of GDP. The European Union stands at 52 per cent, the United Kingdom at roughly 60 per cent. Surplus economies run persistent current account surpluses. They produce more than they consume. They cannot absorb African manufactures because their domestic industries compete for the same export markets. China is the paradigm: household consumption at 39.9 per cent of GDP, record trade surpluses.
Why China Cannot Absorb
Michael Nicoletos’s analysis, published in January 2026, documents what he calls the elephant no one wants to see: China’s economic model is structurally broken. Private consumption at 39.9 per cent of GDP is low by international standards and below China’s own historical average of 49.4 per cent. The structural problems are severe. The property collapse between 2021 and 2024 destroyed between USD7 trillion and USD8 trillion in household wealth. Twenty-five to thirty-four million personal loan defaults occurred in 2024 alone, double the 2019 figure.
Household debt has reached USD11.4 trillion, 60 per cent of GDP. The birth rate hit a record low of 7.92 million in 2025, down 17 per cent year-on-year. Population is projected to fall by 280 million by 2050. The worker-to-retiree ratio is collapsing from four-to-one toward 1.2-to-one by mid-century. Rebalancing would require dismantling the mechanisms that powered China’s rise: ending cheap credit to state-owned enterprises, allowing currency strengthening, redirecting spending from infrastructure to households.
Japan attempted this from 1986 and has not achieved it thirty-eight years later. China’s demographics make the challenge categorically worse. EndGame Macro analysis reinforces this diagnosis. When the GDP deflator stays below zero, the economy can keep moving in real terms while getting poorer in nominal ones. Wages lag. Profits compress. Tax receipts disappoint. Debt quietly gets heavier. Beijing’s dilemma is that another property-led or credit-heavy stimulus would recreate the imbalances that caused the slowdown.
So instead of a reflationary jolt, it chooses the grind: targeted support, administrative guidance, selective bailouts, and a slow attempt to curb overcapacity without destroying employment. Michael Pettis articulates the deeper constraint: a country cannot restructure global capital flows without also restructuring global trade flows, nor can a country change its external imbalances without either changing its internal imbalances or changing the external imbalances of its trade partners. China cannot acquire fewer dollar assets unless either it reduces its trade surplus or it acquires more assets in other countries.
The former would be extremely painful for China, while the latter means either the EU, Japan, or the developing world must run huge trade deficits to accommodate China. The EU and Japan clearly do not want to, and the developing world has limited capacity to fund giant trade deficits. For Africa, the implication is structural. If an African country processes cobalt into battery precursors and seeks to sell the output, China is not a viable market. Chinese battery precursor manufacturers compete for the same customers.
Selling value-added goods to a competitor whose industrial policy is designed to dominate those markets is a structural dead end.
The Middleman Trap
China purchases African raw materials. China processes those materials into intermediate and finished goods. China sells those goods globally. The processing stage, where value compounds through employment, technology development, and industrial learning, happens in China. The framing that Africa and China are partners in development inverts the actual relationship. Africa is an input to the Chinese export machine. The demand for African cobalt, copper, and platinum group metals is derived demand: China wants these materials to feed its processing industries, not to support African industrialisation.
IV. The Lock-In Reality
Chinese Positions
Chinese entities have been systematically securing African mineral assets for two decades. Of 166 Chinese-owned critical mineral mining projects globally, sixty-six are in Africa. 41 per cent of DRC cobalt extraction is Chinese-controlled directly. Chinese policy banks issued USD24.9 billion in Belt and Road Initiative mining loans in the first half of 2025 alone. Recent acquisitions illustrate the pace: Botswana’s Khoemacau copper mine in 2023, Mali’s Goulamina lithium deposit in 2024, Tanzania’s Ngualla rare earth project in 2025.
BYD has secured feedstock from six African lithium mines through offtake agreements extending to 2032. Sicomines in the DRC operates under 68 per cent Chinese ownership with contracts extending through the 2040s, covering ten million tonnes of copper and 600,000 tonnes of cobalt over twenty-five years. These are ownership positions that persist.
Supply Chain Control
The dominance extends beyond extraction. China controls approximately 70 per cent of global critical mineral refining capacity, rising to 90 per cent for graphite and rare earth refining, and 60–70 per cent for lithium and cobalt refining. It produces approximately 70 per cent of rare earth minerals, 93 per cent of high-strength rare earth permanent magnets, and 95 per cent of heavy rare earth processing. It manufactures 90 per cent of the world’s solar panels and is projected to supply 60 per cent of renewable energy capacity by 2030.
Infrastructure Control
Beyond mine ownership, Chinese entities control the infrastructure through which minerals flow. More than one-third of African ports operate under Chinese control or ownership. The TAZARA railway, roads connecting mines to ports, and logistics networks are substantially Chinese-influenced.
The Substitution Timeline
China holds 98 per cent of sodium-ion and lithium iron phosphate battery production. These technologies reduce or eliminate dependence on cobalt, lithium, and nickel. Lithium iron phosphate batteries already hold 40 per cent market share and require zero cobalt. CATL’s sodium-ion facility uses no lithium, cobalt, nickel, or manganese. Beijing is constructing an escape hatch from the very commodities it is locking in across Africa. The leverage African states believe they possess may prove more temporary than assumed.
What Remains Contestable
The existing Chinese positions are largely permanent in the near term. What remains contestable is the pipeline of new projects. Africa is under-explored. Only 10 per cent of global exploration spending occurs on the continent. New discoveries can be structured without Chinese involvement from inception.
Update, February 2026: Glencore entered a non binding memorandum of understanding for Orion CMC to acquire a 40 per cent stake in Glencore’s interests in its Democratic Republic of Congo assets, Mutanda Mining and Kamoto Copper Company. The announcement implies a combined enterprise value of about USD9 billion for these assets including debt. Orion CMC gains rights to appoint non executive directors and to direct the sale of its share of production to nominated buyers, while Glencore continues to manage the assets within the existing US DRC Strategic Partnership Agreement framework. This matters because it demonstrates that contestability now includes established Tier One assets, not only greenfield pipelines, and it shows that Washington is translating supply chain policy into capital deployment and offtake control.
V. Structural Diagnosis
Four analytical frameworks illuminate Africa’s strategic position. Each approaches the question from a different angle. Together they converge on a single verdict: Africa possesses genuine leverage in specific minerals, that leverage is time-limited, and the binding constraint is organisational capacity to capture value before the window closes.
The Value Chain Position
The journey from ore in the ground to a finished product passes through six stages: extraction, primary processing, refining, component manufacturing, final assembly, and consumption. Each stage captures a different share of total value created. Stage 1 is extraction: ore out of ground. Stage 2 is concentration and beneficiation through crushing and flotation. Stage 3 is smelting, using heat to separate metal from ore. Stage 4 is refining to purify material to battery or industrial grade specifications.
Stage 5 is manufacturing of batteries, components, and finished goods. Most African mineral production remains concentrated at extraction and primary processing. Zambia operates copper smelters; South Africa has platinum group metal refineries. But the value chain stages that command premium margins (high-purity refining to battery-grade specifications, precursor chemical production, cell manufacturing) sit overwhelmingly outside the continent. China controls approximately 70 per cent of global critical mineral refining capacity, rising to 90 per cent for graphite and rare earths.
Africa’s value capture remains compressed at the lower end of the chain. China controls the middle stages. Chinese facilities refine cobalt, process lithium, manufacture battery components. The value captured at these stages ranges from ten to 35 per cent of the final product. The United States and Europe want Stage Five: final assembly into finished goods. They want electric vehicles assembled domestically, batteries installed in their factories, the jobs and industrial capacity that come with end-stage manufacturing.
Africa provides the raw input at the beginning and serves as a consumption market at the end. The production stage, where wealth compounds through employment, technology development, and industrial learning, happens elsewhere. The framing that China and Africa are development partners obscures the value chain reality. China purchases African raw materials to feed Chinese refineries. China sells finished goods back to African consumers. The processing stage, where value accumulates, remains external. Africa sells to the middleman, buys back from the middleman, and celebrates.
Skipping the middleman to access final markets directly would require processing capacity that Africa largely does not possess.
Bargaining Position: Porter’s Five Forces
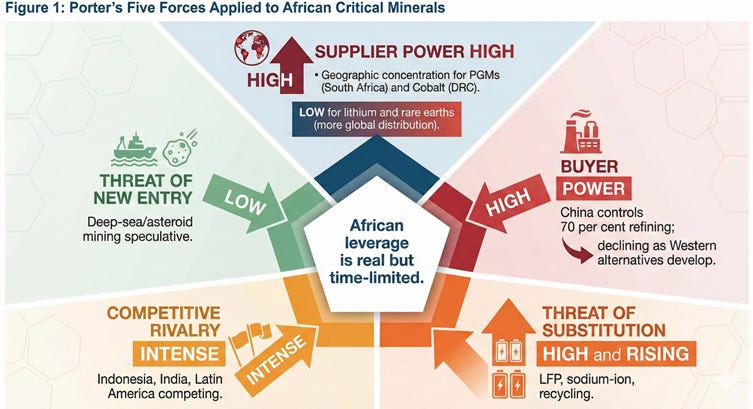
Porter’s Five Forces framework assesses the competitive dynamics that shape industry profitability. Applied to Africa’s critical minerals position, it reveals where leverage exists and where it is constrained.
Supplier Power
This is Africa’s source of leverage. The common claim that Africa holds 30 per cent of global mineral reserves is poorly sourced. Bright Simons of IMANI and ODI has traced this figure to a 2002 African Development Bank paper with no USGS verification. The actual data is more specific and more modest. Platinum group metals: Africa holds 79 per cent of global reserves, concentrated in South Africa’s Bushveld Complex. For PGMs, African supplier power is very high.
Cobalt: Africa holds 55 per cent of reserves and produces 70 per cent of global output, concentrated in the DRC. For cobalt, African supplier power is high but faces substitution risk. Manganese: Africa holds 47 per cent of reserves. Chromium: 62 per cent. These represent moderate supplier power with limited substitution risk. Copper: Africa holds 6 to 9 per cent of reserves but produces 18 per cent of output. DRC ore grades at 2–3 per cent copper (averaging 2.3 per cent) are exceptionally high compared to the 0.5 to 0.7 per cent global average. Production leverage exists, but copper reserves are constrained relative to African electrification and industrialisation needs.
Africa is a marginal player in lithium and rare earths, and these positions do not constitute leverage. The supplier power verdict is specific: Africa has genuine leverage in platinum group metals and cobalt, moderate leverage in manganese and chromium, production leverage in copper, and no meaningful leverage in lithium or rare earths.
Buyer Power
China’s control of 70 per cent of refining capacity (90 per cent for graphite and rare earths) gives it significant buyer power over African extractors. Chinese buyers can play suppliers against each other, demand lower prices, and dictate offtake terms. The United States and European Union are working to reduce this Chinese buyer power through supply chain diversification. American willingness to pay for secure, non-Chinese supply is high and rising. The Lobito Corridor project, backed by over USD550 million from the US International Development Finance Corporation, signals this desperation.
The European Union faces a particular constraint. Neither the US nor EU has an alternative source at scale for platinum group metals or cobalt. The difference: the US is willing to impose tariffs on South Africa anyway. The EU is not. EU-Mercosur secures niobium. EU-India provides manufacturing partnership. But neither Brazil nor India has 79 per cent of global PGMs. Neither has over 70 per cent of global cobalt production. The EU must engage with South Africa and the DRC regardless of BRICS membership or Chinese contamination. This constraint is African leverage.
Threat of Substitution
This is the clock ticking on African leverage. The timeline is more compressed than commonly assumed. Lithium iron phosphate batteries now hold 40 per cent market share and require zero cobalt. The shift from nickel-manganese-cobalt chemistries to LFP is already well advanced. Sodium-ion batteries entered commercial production at scale in 2024. CATL’s sodium-ion technology uses no lithium, cobalt, nickel, or manganese. China controls 98 per cent of sodium-ion production. Battery recycling creates urban mining alternatives to virgin extraction.
Recycling capacity is scaling rapidly in China, Europe, and the United States. The substitution verdict is sobering. The mineral leverage that exists today has an expiry date. The window is five to seven years before substitutes mature and African assets risk becoming stranded. Cobalt faces the highest substitution risk. PGMs face lower substitution risk due to their role in hydrogen fuel cells and industrial catalysis. Copper faces moderate risk as electrification proceeds regardless of battery chemistry.
Competitive Rivalry
The competition is already advanced. Indonesia introduced a raw nickel export ban in 2014 and enforced a full ban from 2020, then attracted large-scale downstream investment into processing and battery supply chains. Indonesia won the nickel race while Africa deliberated. The Indonesian nickel model offers a template the Coalition of the Eligible could adapt. By banning raw ore exports and requiring domestic processing as a condition of access, Indonesia forced capital to follow policy rather than policy following capital.
A coordinated export ban among Coalition members (covering raw critical mineral ore) would be easier to enforce among a smaller group of aligned states than across the fragmented continent. The question is whether Coalition members possess the political will to absorb short-term revenue loss for long-term value capture. The EU-Mercosur agreement secures European access to 82 per cent of global niobium reserves in Brazil. That market is now closed to African competition. Chile and Argentina’s lithium triangle offers alternatives to African lithium.
Latin American copper from Chile and Peru competes directly with Zambian and Congolese output. India may outcompete Africa for processing investment. Production-linked incentive schemes for batteries, electric vehicles, and solar manufacturing make India an attractive destination for Western companies seeking non-Chinese processing capacity. India has scale, infrastructure, English-speaking workforce, and established manufacturing ecosystems that most African countries lack.
India’s experience crystallised on 2 February 2026. After months of negotiation, Prime Minister Modi accepted President Trump’s terms: India would stop buying Russian crude (a strategic relationship dating to Cold War non-alignment), commit USD500 billion to American goods, and reduce Indian barriers ‘to ZERO’. In exchange, the combined 50 per cent tariff (25 per cent reciprocal plus 25 per cent Russia oil penalty) fell to 18 per cent. The episode demonstrates the forced choice in its starkest form. India, with 1.45 billion people and decades of defence partnership, could not preserve strategic flexibility. African states lack India’s leverage.
Threat of New Entry
Deep-sea mining remains speculative. Asteroid mining is decades away. New terrestrial discoveries in Greenland and the Arctic face environmental and infrastructure barriers. The near-term threat of new entry is low.
Porter Verdict
Africa has leverage in specific minerals where geographical concentration creates scarcity. That leverage is narrower than commonly claimed, faces substitution risk, and confronts competitor pressure. The leverage is real but time-limited. The strategic imperative is capturing value within the window, not assuming the window remains open indefinitely.
Competitive Assets: VRIO Analysis
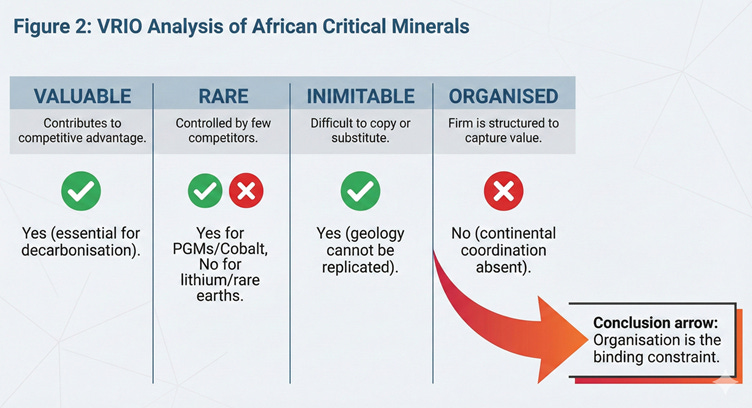
The VRIO framework, developed by Jay Barney in 1991, assesses whether a resource can generate sustained competitive advantage. Four criteria must be met: the resource must be Valuable, Rare, difficult to Imitate, and the Organisation must be structured to capture value from it.
Value
African minerals are essential to the electrification and decarbonisation build-out. Cobalt stabilises lithium-ion battery cathodes. Platinum group metals catalyse hydrogen fuel cells. Copper enables electrification across every sector. Without these materials, decarbonisation mandates stall. The value criterion is unambiguously met.
Rarity
Cobalt deposits are geographically concentrated in the DRC to a degree unmatched by any other critical mineral. Platinum group metals are similarly concentrated in South Africa’s Bushveld Complex. The rarity criterion is met for key minerals. The rarity criterion is not met for lithium or rare earths. Africa’s 1.6 per cent of lithium reserves and 2 to 3 per cent of rare earth reserves do not constitute rarity. Multiple alternative sources exist at scale.
Imitability
Competitors cannot replicate African cobalt or PGM deposits. The geology is fixed. They can develop alternatives, substitutes, or recycling pathways, but they cannot create new Congolese cobalt reserves or new Bushveld PGM deposits. The imitability protection is partial but meaningful for the minerals where Africa has concentration.
Organisation
This is where Africa fails the VRIO test. Valuable, rare, and hard-to-imitate resources exist. The continental organisation to capture value from them does not. Fifty-four fragmented sovereigns negotiate individually against coordinated buyers. The African Continental Free Trade Area exists on paper but lacks enforcement capacity. Rules of origin remain disputed. African states have coordinated positions within multilateral frameworks: the African Group at the WTO, the ACP negotiations with the EU, Common African Positions on climate and debt.
These precedents demonstrate diplomatic capacity. Mineral coordination demands something harder: operational sacrifice with immediate costs and diffuse benefits, where individual countries face constant temptation to defect for short-term gain. The coordination problem is not diplomatic. It is structural. The organisation criterion cannot be met within the leverage window. This is the critical constraint. The strategic window is five to seven years. The Coalition of the Eligible is a partial solution to the organisation gap: asset-level eligibility architecture that builds institutional capacity over time, serving as bridge to eventual organisational capability.
VRIO Verdict
Africa holds resources that meet three of four criteria for sustained competitive advantage. The missing criterion, organisation, is the one that determines whether leverage translates into industrialisation or remains geological potential that others exploit.
Strategic Options: The Ansoff Verdict
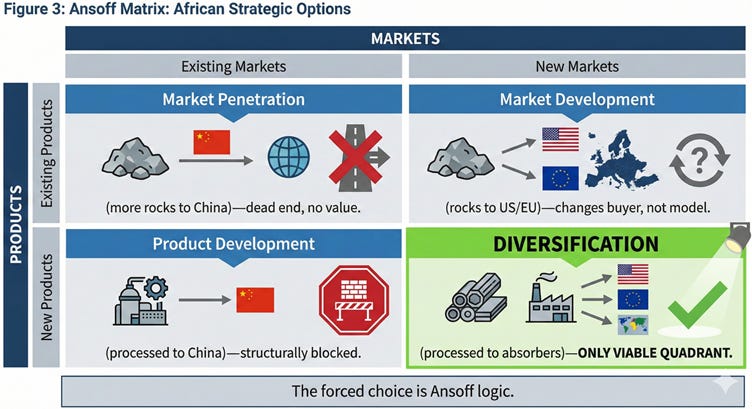
The Ansoff Matrix maps strategic options along two dimensions: products (existing or new) and markets (existing or new). Applied to African mineral strategy, it reveals which quadrants lead to industrialisation and which are dead ends.
Market Penetration: Existing Products, Existing Markets
This is the status quo. Shipping more raw copper and crude oil to China. The strategy generates immediate revenue but deepens exposure to a monopsony buyer while capturing zero additional value. The quadrant reinforces the extraction trap. It is a strategy of volume that changes nothing structural.
Market Development: Existing Products, New Markets
This strategy suggests redirecting raw minerals from China to the United States or Europe. While it diversifies political risk, it fails the industrial test. Selling raw cobalt to Texas instead of Jiangsu is still selling rocks. It changes the buyer but preserves the business model. Africa remains at Stage One of the value chain.
Product Development: New Products, Existing Markets
This involves processing minerals locally but attempting to sell the finished goods to China. The quadrant is structurally blocked. China imports ore to feed its own refineries. China does not import finished battery precursors that would idle its domestic capacity.
Diversification: New Products, New Markets
This is the only viable quadrant. Converting raw assets into intermediate goods (processing) and directing them toward markets that run deficits (absorbers). Selling battery precursors to US and EU supply chains is the only combination where the buyer needs the value-added product and has the structural capacity to pay for it.
Ansoff Verdict
Move to the diversification quadrant or remain trapped. The absorber markets are the new markets. Processing capacity is the new products. The forced choice is not ideological preference for Western partnerships. It is Ansoff logic: the only quadrant where African industrial upgrading can succeed is the one that combines value-added production with access to absorber markets.
The Window
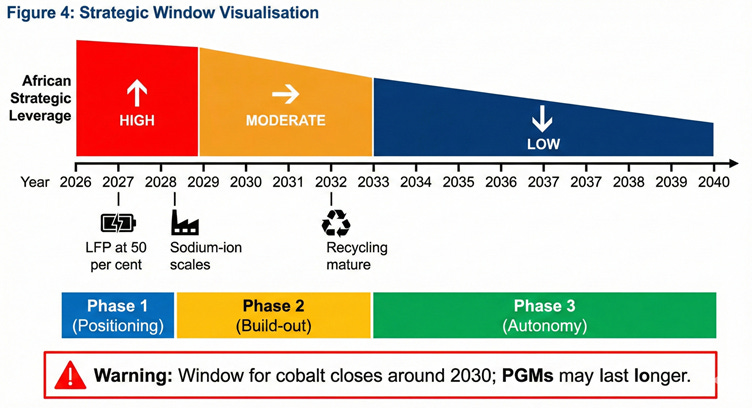
Five factors create a strategic window that will not remain open indefinitely. Substitution is accelerating. Recycling and urban mining reduce virgin extraction demand. The minerals that create African leverage today will be less critical within this window. Investment is locking in. The FEOC compliance architecture gates market access. Section 232 tariff frameworks create negotiation windows.
Investment decisions are being made now. Countries and assets not positioned for this wave will miss it entirely. Competitors are moving. Indonesia secured Chinese processing investment through export bans while Africa debated. Morocco is positioning as a battery hub. India is developing refining capacity. The first-mover advantage accrues to those who act. Coordination takes time. Building the organisational capacity that the VRIO analysis identifies as missing will take years. The window for individual countries and assets to position themselves may close before continental coordination materialises.
Political windows close. Elections in Zambia, Kenya, Nigeria, and South Africa (local government), in 2026 and 2027, create domestic uncertainty. Governments capable of making structural commitments may be replaced by governments that cannot. The alignment decisions that shape the next decade must be made by the current generation of leaders. The window is real but finite. The strategic imperative is immediate positioning, not eventual adjustment.
VI. The Leverage That Actually Exists
The discourse around African mineral leverage requires correction. The commonly repeated claim that Africa holds 30 per cent of global mineral reserves has shaped policy assumptions, investor narratives, and negotiating postures. The claim is poorly sourced and misleading.
The Thirty Per Cent Myth
Bright Simons, honorary vice president at IMANI and visiting senior fellow at ODI Global, has traced the earliest record of this claim to a 2002 African Development Bank paper. The figure has been repeated by the World Bank, UNEP, the Mo Ibrahim Foundation, and countless policy documents since then. Simons has been warning against it for more than a decade. The methodology behind the claim is unclear. It appears to conflate different mineral categories, aggregate reserves that are not strategically equivalent, and lack verification against USGS or geological survey data.
Respectable international organisations still push this narrative despite its analytical weakness. When the actual data is examined, Africa’s position is more specific and more modest than the 30 per cent framing suggests.
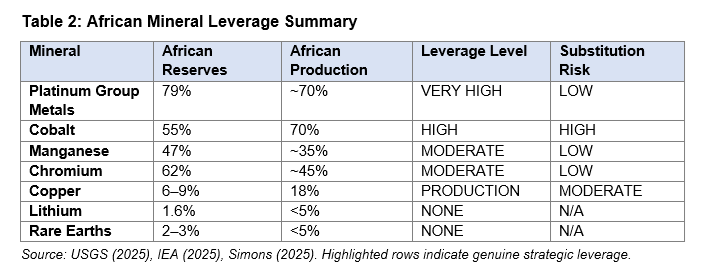
Where Leverage Exists
Platinum group metals: Africa holds 79 per cent of global reserves, with South Africa’s Bushveld Complex containing the vast majority. This is genuine concentration. There is no alternative source at scale. The leverage is real. Platinum group metals serve applications beyond hydrogen fuel cells. Palladium remains critical for catalytic converters in internal combustion vehicles, a market that will decline but not disappear within the leverage window. Rhodium is essential for automotive emissions control with no viable substitute.
Cobalt: Africa holds 55 per cent of reserves and produces 70 per cent of global output. The DRC dominates both reserves and production. The leverage is real but faces substitution risk from LFP and sodium-ion battery chemistries. Manganese: Africa holds 47 per cent of reserves, concentrated in South Africa and Gabon. The leverage is moderate with limited substitution risk. Chromium: Africa holds 62 per cent of reserves, concentrated in South Africa. The leverage is moderate for industrial applications.
Copper: Africa holds 6 to 9 per cent of reserves but produces 18 per cent of global output. The discrepancy reflects exceptionally high ore grades in the DRC, averaging 2–3 per cent copper compared to 0.5 to 0.7 per cent global average. Production leverage exists, but reserves are constrained. If African industrial output doubled, the continent might become a net importer of copper for its own development needs. The nuclear dimension warrants attention. The United States is accelerating small modular reactor deployment domestically and positioning nuclear as dispatchable clean baseload.
Africa’s energy deficit and uranium reserves in Niger, Namibia, and South Africa create potential alignment between American nuclear ambitions and African energy needs, a negotiation dimension not yet explored in current frameworks.
Where Leverage Does Not Exist
Lithium: Africa holds 1.6 per cent of global reserves. Chile, Argentina, and Australia dominate. Africa is a marginal player entering an established market. This is not leverage. Rare earths: Africa holds 2 to 3 per cent of global reserves. Only Madagascar and Nigeria produce significant quantities, together accounting for under 5 per cent of global output. The claim that Africa is rich in rare earth minerals is factually incorrect. The entire rare earth market is projected at approximately USD8 billion by 2032, less than half what Ghana alone earns from gold.
Nickel: Africa holds 5.6 per cent of reserves. Indonesia dominates global production. Africa has no meaningful position.
Strategic Implications
The narrow but real leverage has strategic implications that differ from the broad leverage narrative. Focus matters. African mineral strategy should concentrate on the minerals where genuine leverage exists: platinum group metals, cobalt while the window lasts, manganese, chromium, and copper production. Dispersing effort across minerals where Africa has no meaningful position wastes resources and credibility. Time matters more than previously assumed. Cobalt leverage faces substitution within five to seven years.
PGM leverage may last longer if hydrogen fuel cells scale. Building strategy around a fifteen-year window when the actual window may be half that risks stranded positioning. Competition is real. Africa competes against Latin America, Australia, Indonesia, and India. EU-Mercosur has already secured 82 per cent of European niobium supply. The minerals where Africa lacks concentration are markets where Africa is a price-taker, not a price-maker. Conservation deserves consideration. Simons’ STRIVE framework prioritises minerals for African industrialisation: copper, phosphates, aluminium, manganese, iron ore.
These are bulk-industrial minerals needed for Africa’s own development. The minerals Western supply chains want for electric vehicles may not be the minerals Africa should export. A strategy that ships everything westward may leave Africa importing the very minerals it needs to develop.
VII. The Contamination Problem
The countries where Africa’s mineral leverage is concentrated are the same countries where access to US markets is most compromised. This is the contamination problem, and it fundamentally shapes the viability of any alignment strategy.
Country-Level Contamination
South Africa is a BRICS member and has faced 30 per cent US tariffs since August 2025. The country-level contamination affects all South African assets regardless of their individual ownership structure. 41 per cent of DRC cobalt extraction is directly Chinese-controlled. The Sicomines consortium operates under 68 per cent Chinese ownership with contracts extending through the 2040s.
Chinese entities hold substantial positions across the DRC mining sector. Zambia is a major copper producer with exceptionally high ore grades. In October 2025, Zambia accepted yuan-denominated royalties and mining tax payments. President Hichilema’s public positioning has emphasised non-alignment and neutrality. The posture signals strategic ambiguity that US policy reads as insufficient commitment. Zambia’s positioning has been more complex than simple neutrality. In 2025, Zambia declined to sign a US health cooperation agreement that appeared tied to critical minerals access commitments.
Simultaneously, Zambia moved toward yuan-denominated royalty and tax payments without securing corresponding beneficiation requirements. The pattern suggests tactical manoeuvring rather than strategic clarity: accepting Chinese payment terms while resisting American conditionality, without extracting processing commitments from either side.
The Governance Capture
Chinese commercial influence often extends into governance structures. Board seats, offtake agreements, infrastructure dependencies, and local political relationships create leverage beyond direct ownership percentage figures. A mine may show 30 per cent Chinese ownership on paper while operating under Chinese operational control through management contracts or exclusive purchasing arrangements. The contamination propagates through supply chains.
The red line is effective control.
Asset-Level vs Country-Level Analysis
Contamination analysis must operate at both country and asset levels. South Africa is contaminated at country level through BRICS membership and tariff status. But specific South African assets with clean ownership chains might qualify for Track B positioning through EU markets that face no alternative. The DRC presents mixed contamination. Some assets are directly Chinese-controlled. Others, like the Kamoa-Kakula complex under Canadian and South African ownership through Ivanhoe Mines, may qualify for Track A positioning at asset level despite country-level complications.
Zambia’s contamination is positioning-based rather than ownership-based. Western-owned assets exist. The complication is governmental posture, not mine ownership.
The Eligibility Architecture
The two-track framework responds to contamination realities. Track A serves clean countries and assets. Track B serves contaminated countries and assets where US access is effectively closed but EU access remains available due to European structural constraints. The distinction is not permanent assignment. Countries can shift tracks through policy changes. Assets can shift tracks through ownership restructuring. The framework acknowledges current contamination while creating pathways for repositioning.
February 2026 provides a live example of how asset level eligibility can be engineered inside a contaminated country. Glencore agreed a non binding memorandum of understanding for Orion CMC to acquire a 40 per cent stake in Mutanda Mining and Kamoto Copper Company. Orion CMC obtains non executive board representation and the right to direct the sale of its share of production to nominated buyers. The structure targets effective control and traceable offtake without transferring operatorship. It is Track A design logic inside Track B geography.
VIII. The European Imperative
The European Union faces structural constraints that create African leverage regardless of American punishment. This section examines why the EU must engage with Africa on critical minerals, even where the United States has imposed barriers.
The Concentration Problem
For platinum group metals, there is no alternative to South Africa. Russia has some production but is sanctioned. Secondary sources exist but cannot approach the scale the EU requires for automotive catalysts and hydrogen economy development. For cobalt, there is no alternative to the DRC. The Congo produces 70 per cent of global output. Australia has some cobalt production.
Indonesia is developing nickel laterite sources with cobalt by-products. None approaches Congolese scale. The EU-Mercosur agreement illustrates European methodology. Twenty-five years of patient negotiation to secure access to Brazilian niobium, Argentine lithium, and Latin American agricultural markets. The EU negotiates slowly but eventually secures what it needs. The same patience will be applied to African critical minerals.
The EU Critical Raw Materials Act
The Critical Raw Materials Act establishes benchmarks for European supply chain security. By 2030, the EU must extract 10 per cent of its critical mineral needs domestically, process 40 per cent domestically, and recycle 15 per cent. The remainder must be sourced from secure partners with diversified supply chains. These targets cannot be met without African supply. The EU lacks domestic PGM deposits. European cobalt sources are negligible. The arithmetic forces engagement with South Africa and the DRC regardless of their geopolitical positioning.
The Act creates compliance architecture analogous to American FEOC provisions. Supply chain traceability, sustainability requirements, and governance standards gate market access. But the standards are structured differently, creating space for countries that cannot access American markets.
The European Flexibility
Europe’s approach to contamination differs from America’s. BRICS membership triggers American tariffs but does not automatically exclude countries from European supply chains. The EU maintains engagement with South Africa despite BRICS membership. European pragmatism allows what American punishment forbids. This flexibility is not unlimited. The EU will currently “not purchase” from “sanctioned” Russian sources. Chinese-controlled assets face scrutiny under supply chain security provisions. But the space for African engagement is wider than American markets offer.
UK Positioning
The United Kingdom occupies a middle position. Britain faces tariff exposure from Washington despite the special relationship. The UK trade deficit with China has widened to GBP42 billion. Prime Minister Starmer’s Beijing visit with sixty business executives signals pragmatic hedging rather than full alignment with American punishment approaches. The UK is a smaller absorber market than either the US or EU. But UK critical minerals frameworks exist, and UK flexibility on contamination questions may exceed American rigidity.
For contaminated African assets, UK market access may remain available alongside EU access.
IX. The Monetary Weapon
The forced choice operates in currency as well as trade. Yuan exposure creates vulnerabilities that compound the alignment question.
The Chokehold Mandate
Analysis from Tindale and others has identified a mechanism by which supply chain dominance captures monetary policy. Central banks require confidence in disinflation to cut interest rates. If input costs are subject to external disruption, that confidence is harder to achieve. China’s supply chain tools include administrative latency through licensing queues and inspections, specification control that makes high-purity materials scarce while low-grade materials fill volume, benchmark governance through thin liquidity manipulation, trade finance pressure through shorter terms and higher collateral requirements, and destination-based differentiation that favours preferred partners, defined not only by political alignment but by payment currency, creating incentives for yuan adoption.
The implication is that central banks operate mechanisms designed for closed loops, yet inputs are now externally governed. Chinese supply chain position affects Western monetary conditions through channels that do not require explicit weaponisation.
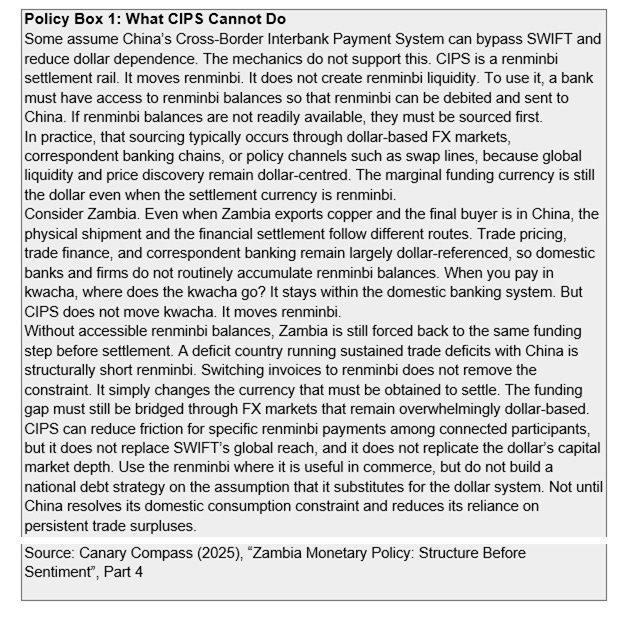
The Yuan Trap
Yuan exposure creates a different vulnerability than dollar exposure. The renminbi is not organically offshore. It does not circulate globally independent of Beijing’s control. Offshore yuan liquidity is deliberately managed. If an African country holding significant yuan-denominated debt experiences a shift in its relationship with China, yuan liquidity can be tightened precisely when refinancing is needed. This does not require formal sanctions or international coalition. It requires only the administrative controls China already maintains as part of capital account management.
The risk is asymmetric and additive. Adopting the yuan does not allow an African state to exit the dollar system. Global energy, food, and 88 per cent of foreign exchange transactions remain dollar-denominated. Yuan adoption forces countries to serve two masters. A liquidity squeeze from either Washington or Beijing threatens solvency. Zambia’s acceptance of yuan-denominated royalties and mining tax payments in October 2025 illustrates the trap. The decision does not liberate Zambia from dollar exposure.
It adds yuan exposure on top. The country now has two potential choke points rather than one. The strategic intent is now explicit. On 1 February 2026, China’s Communist Party journal Qiushi published remarks from President Xi Jinping calling for the renminbi to become “widely used in international trade, investment and foreign exchange markets, and attain reserve currency status.” Xi outlined three institutional pillars: a “powerful central bank,” globally competitive financial institutions, and international financial centres capable of attracting global capital.
The timing (amid dollar weakness, Federal Reserve leadership transition, and escalating trade tensions) signals Beijing’s assessment that the global monetary order is entering a contested phase. Yet structural constraints remain binding. The renminbi accounts for barely 1.93 per cent of global reserves versus the dollar’s 57 per cent. Capital controls prevent full convertibility. And China’s persistent trade surpluses mean it does not export renminbi liquidity through deficit-financed trade absorption. Instead, renminbi liquidity is distributed primarily through administrative and policy channels, including central bank swap lines and Belt and Road financing, rather than through the deep, deficit-driven capital markets that underpin true reserve currency status.
Ambition and capability remain misaligned.
Note: A managed offshore RMB loop can still function as a trade currency within a bloc without China running a current account deficit. If commodity exporters accumulate RMB through oil and metals sales, they can recycle those balances by lending RMB to deficit importers purchasing Chinese goods. Trade can therefore clear in RMB even when China is not a direct party to every transaction.
The constraint is scale and permanence. A circulating trade credit stock is not the same as a reserve asset stack. The moment surplus holders seek a deep, hedgeable store of value and a credible exit that is not contingent on political rollover, the system encounters the same bottleneck: the availability of credible RMB assets, reliable convertibility, and a lender-of-last-resort function that extends offshore under predictable rules.
Dollar Dominance
The dollar’s position remains structurally entrenched despite diversification rhetoric. In energy markets (oil and gas), approximately 90 per cent of global trade remains dollar-denominated, challenged by BRICS initiatives but still the standard. In food markets (grains), dollar dominance is estimated at around 90–95 per cent, near-total. In global reserves, the dollar’s share stands at approximately 57 per cent, slowly declining from about 70 per cent in 2000 but still dominant.
The structural point is that dollar dominance constrains African bargaining. Critical mineral exports priced in dollars flow through dollar-clearing systems subject to US jurisdiction. Diversification into yuan-denominated trade does not escape this constraint; it merely shifts Africa from one great power’s currency hegemony to another’s.
The Miran Treasury Strategy
Analysis from Miran and others suggests the United States is actively building capacity to weaponise financial channels more aggressively. The strategy involves using tariffs to force adjustment and disrupt surplus recycling, dollar weakening to restore US competitiveness, Treasury restructuring to remove the reserve veto by which foreign holders could punish US policy through bond sales, and stablecoins and AI to stabilise the transition. If this strategy proceeds, financial weaponisation follows after insulation is achieved.
The US would have greater freedom of action against partners deemed insufficiently aligned. On 30 January 2026, the US Treasury declared the yuan “substantially undervalued” and called on China to allow it to strengthen “in a timely manner.” This is the opening of a new front. Analysts including Brad Setser estimate the renminbi remains 10–15 per cent undervalued on a trade-weighted basis, though the precise figure depends on methodology. Goldman Sachs analysis in December 2025 estimated undervaluation as high as 25 per cent using their GSDEER and GSFEER models.
Any yuan appreciation is likely to be gradual. China’s export-dependent growth model and weak domestic consumption create structural resistance to sustained currency strengthening. The U.S. Treasury’s designation signals intent but does not compel action, and African policymakers should not assume yuan appreciation will materialise quickly enough to alter current trade dynamics. At present, renminbi financing does offer a relative cost advantage, particularly where policy banks, swap lines, or concessional terms are involved.
At the same time, policymakers should recognise the risk asymmetry. If yuan appreciation were to accelerate unexpectedly, governments that borrowed in yuan to escape dollar dependency would face higher debt service costs as the yuan strengthens against their currencies.
The Federal Reserve leadership transition introduces an additional variable. With Kevin Warsh reported as a leading candidate to succeed Jerome Powell, market expectations have shifted toward potentially lower U.S. interest rates. If dollar funding costs decline while China’s internationalisation efforts push renminbi funding costs higher, today’s cost advantage could narrow or reverse. In that scenario, the marginal cost advantage of dollar financing could widen rather than narrow, reinforcing dollar centrality in African trade finance precisely when some policymakers assume diversification will become easier.
For African countries holding yuan-denominated debt, this creates an additional vulnerability. If the United States forces yuan appreciation as part of trade negotiations with China, African borrowers would face rising debt service costs. What is currently framed as relief from dollar exposure risks becoming a new form of currency trap.
X. The US Policy Architecture
Understanding the forced choice requires understanding the specific policy mechanisms through which the United States gates market access. These are legislative requirements with binding legal force, not diplomatic preferences subject to negotiation.
The Inflation Reduction Act and FEOC
The Inflation Reduction Act of 2022 created a compliance architecture that determines which critical minerals can enter US supply chains. Section 30D Clean Vehicle Credits terminated on 30 September 2025, but the broader Foreign Entity of Concern provisions remain operative and continue to gate market access through the expanded framework. FEOC contamination propagates through the entire value chain. A single Chinese equity stake at any stage contaminates all downstream output. Under the latest FEOC interpretations, ownership is no longer the sole determinant of eligibility.
The red line is effective control. A mine may be wholly owned by an African pension fund, but it will be disqualified from IRA-eligible supply chains if a Chinese firm holds board seats, marketing rights, or significant operational influence. The asymmetry is structural. Chinese capital has a disincentive to build African processing capacity because every African refinery cannibalises existing Chinese facilities. Western capital faces no such constraint. When African governments mandate local beneficiation, Western firms must either build local capacity or lose market share to compliant competitors.
This asymmetry is the structural opportunity. The contrast between Chinese and American approaches is instructive. China’s primary goal is to feed domestic industry; when facing export bans, it negotiates for special exemptions; it prefers raw or semi-processed inputs that feed Chinese refineries. The United States’ primary goal is to secure compliant supply; when facing export bans, it seeks to build local or regional processing hubs to maintain access; and it is open to full precursor chemical production on African soil. This asymmetry creates African leverage that Chinese capital cannot match.
The One Big Beautiful Bill Act
The One Big Beautiful Bill Act, passed as Public Law 119-21 in 2025, expanded the FEOC framework from the original seven tax credits to a comprehensive structure governing critical mineral supply chain eligibility. The legislation formalises what was previously Treasury guidance into binding statutory requirements. The expansion means FEOC compliance now gates access to a broader range of incentives and market access provisions.
Pax Silica: The Mineral Iron Curtain
The Pax Silica initiative, launched by the US State Department on 12 December 2025, formalises what amounts to a mineral iron curtain. The United States, Japan, South Korea, Singapore, Australia, the United Kingdom, and Israel signed the Pax Silica Declaration, establishing a framework for critical minerals cooperation that explicitly excludes China. The Netherlands, UAE, and Qatar joined shortly after. Sectoral engagement remains possible within hard boundaries. Those boundaries are set by supply chain rules, ownership thresholds, and security definitions that absorber economies enforce through legislation.
The IRA, FEOC provisions, Section 232 tariff frameworks, and Pax Silica architecture create selection mechanisms that determine which African assets receive processing investment and which are excluded regardless of diplomatic rhetoric.
Critical Minerals Agreements
FEOC-clean African assets may not qualify for full IRA benefits unless processed in a country with a Critical Minerals Agreement with the United States. The US has signed CMAs with Japan in March 2023 and a Critical Minerals Framework Agreement with Australia in October 2025. No African country has a CMA. This gap represents the coalition’s first collective action opportunity. Bloc-level negotiation for CMAs covering eligible African countries would unlock IRA-qualifying status for compliant assets. Individual countries negotiating separately face weaker bargaining positions and longer timelines.
The coalition’s first test is whether it can achieve what bilateral negotiation cannot.
Trade Not Aid: The SIWG
The Trump administration’s Africa policy is explicitly framed as trade not aid. USAID assistance to Africa has fallen 25 per cent since 2025. Critical minerals were exempted from sweeping new tariffs, one of the few sectors so protected. The exemption signals where American priorities lie. On 28 January 2026, Deputy Secretary of State Christopher Landau and African Union Commission Chairperson Mahmoud Ali Youssouf signed an agreement in Addis Ababa establishing the US-AUC Strategic Infrastructure and Investment Working Group.
The joint statement is explicit: the SIWG will provide a foundation for durable, profitable investments to drive economic goals in place of foreign assistance. The priorities are equally explicit: critical minerals and commodities supply chains, transportation corridors, energy networks, and regulatory harmonisation aligned with PIDA and AfCFTA. The African Growth and Opportunity Act lapsed on 30 September 2025, placing approximately 1.3 million African jobs at risk. The House of Representatives passed a three-year extension on 12 January 2026 by a vote of 340 to 54.
The Senate approved only a one-year extension to 31 December 2026 in its appropriations bill on 30 January 2026. South Africa’s continued participation remains pending White House decision given the 30 per cent tariff already imposed. The uncertainty itself is a negotiating tool. Secretary of State Marco Rubio convenes the Critical Minerals Summit in Washington on 4 February 2026, pressing African delegations on supply chain commitments. The US-DRC Strategic Partnership, signed in December 2025, offers American firms preferential access to Congolese mineral reserves.
The Lobito Corridor, backed by over USD550 million from the US International Development Finance Corporation and USD200 million from the Development Bank of Southern Africa (total USD753 million), represents the physical infrastructure of the alignment strategy.
The Technology Dimension
The strategic logic extends beyond market access and infrastructure. If African states are offering alignment in a generational reordering, the negotiation should encompass technology access (including positioning in the AI supply chain that both powers are racing to control) and debt relief from Western-held obligations. The technology dimension is not peripheral. AI is diffusing as strategic infrastructure, with compute and advanced chips treated as controlled inputs. The United States has formalised tiered approaches to chip access that follow alignment, not price.
Washington actively uses compute access as tech diplomacy, approving advanced chip exports to close partners in the Gulf while constraining adversaries. China plays its own version through platforms, infrastructure, and partnerships that embed its standards and dependencies. Countries attempting strategic ambiguity risk delayed diffusion and second-tier capability access because neither side wants frontier technology to flow, even indirectly, to the other side. Kenya’s experience with Semiconductor Technologies Limited illustrates the volatility of American partnership.
STL received USD1.3 million from the US Trade and Development Agency in 2022 under Biden’s “friend-shoring” strategy, positioning Kenya as a potential node in diversified chip supply chains. With Trump’s return and “America First” imperatives, that partnership quietly evaporated. STL now seeks alternative funding, having secured only GBP300,000 from the UK against a USD350 million vision. The Vietnam contrast is instructive: when US support wavered, Hanoi committed USD500 million in public investment.
Today Vietnam is an emerging semiconductor hub. Kenya’s government has made no comparable commitment. The episode demonstrates that American strategic interest and American strategic commitment are not the same thing. The debt dimension creates leverage that current negotiations have not exploited. The majority of African sovereign debt is held by Western creditors, not China. This creates bargaining power for countries willing to link alignment choices to restructuring conversations. The question is whether African negotiators recognise the hand they hold.
The Conditionality Argument
The debate over Western conditionality is often framed as a clash of values: American moralising versus Chinese respect. This framing is an expensive category error. In financial terms, conditions are risk mitigation mechanisms. The interference that African elites resent, the requirements for contract enforcement, transparency, and independent courts, are precisely the structural features that lower the cost of capital in global markets. The data is unambiguous. African Eurobonds carry average yields of 9.1 per cent on dollar-denominated sovereign bonds, compared to 6.5 per cent in Latin America and 5.3 per cent in Asia for comparably rated issuers.
The Africa premium runs 200 to 400 basis points above similarly rated emerging market peers. 80 per cent of rated African sovereigns are classified as high-risk. Only Botswana and Mauritius maintain investment-grade status. Researchers have quantified that subjective elements in credit ratings, including governance assessments, cost African governments an additional USD24 billion in interest payments and USD46 billion in foregone lending over the life of various bonds. These sums could fund infrastructure, education, and healthcare.
The premium is not imposed by Western conditionality. The premium reflects investor perception of governance risk. When Western lenders demand rule of law, they are effectively requiring the borrower to lower their own risk premium. An economy with enforceable contracts and transparent data attracts capital at 6 per cent. An economy without attracts capital at 12 per cent, or not at all. Chinese financing avoids conditionality lectures but does not lower the cost of capital in global markets. The vendor financing model delivers infrastructure at inflated costs through tied procurement, not improved sovereign creditworthiness.
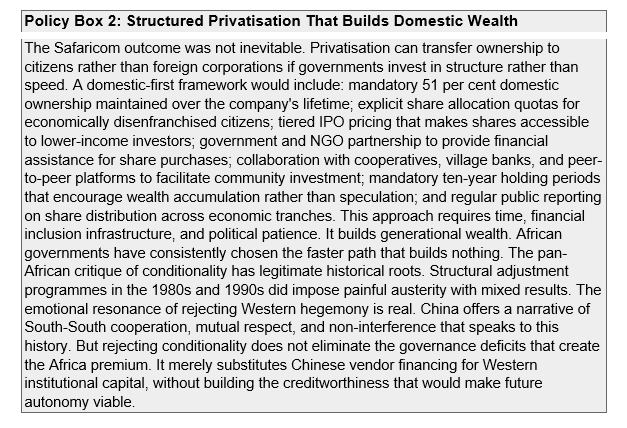
Kenya’s recent experience illustrates the stakes. In 2025, the World Bank and IMF froze loan disbursements after Kenya failed to meet eleven of sixteen agreed conditions. The IMF denied Kenya USD851 million. The conditions included restructuring Kenya Airways, boosting tax revenue, and paying suppliers. These requirements are not colonial interference. They are the prerequisites for fiscal sustainability that determines whether Kenya can access capital markets at all. The Safaricom case illustrates the pattern.
Rather than structuring a sale that would transfer ownership to Kenyan citizens through a more complex citizen-anchored process (which would require more time, financial inclusion mechanisms, and political patience), the government sold to Vodacom because it was faster. Safaricom shifted from local to foreign ownership not because no alternative existed, but because the alternative required effort that African governments have consistently declined to make at scale.
The Strategic Logic
The Trump administration’s approach is transactional and explicit. American investment flows to countries that provide supply chain security. Countries that maintain strategic ambiguity face tariff exposure and reduced access. The administration is not persuading. It is selecting. Washington’s shift from statements to capital deployment accelerated in late 2025. The DFC’s USD553 million Lobito loan in December 2025, the US-DRC Strategic Partnership signed that same month, and the Critical Minerals Summit in February 2026 signal a more active posture.
But the amounts remain modest relative to Chinese accumulated investment, and the conditionality frameworks remain incomplete. When a government that pivots toward the US faces Chinese economic retaliation, the question is whether Washington provides protection or only preference. The Kenya semiconductor case reinforces this point: Biden-era friend-shoring delivered a USD1.3 million grant and promises of partnership. Trump-era America First withdrew the commitment without replacement. Strategic interest evaporated overnight.
This is what statements without protection looks like in practice. As one Atlantic Council observer noted: if the US wants dedicated supply, that has to come with something, whether security support, infrastructure, or both. That is where the real negotiations are. The policy architecture creates the selection mechanism. The question for African policymakers is whether to be selected or excluded.
XI. The Competition Landscape
African mineral strategy operates in a competitive environment. Africa competes against other suppliers for access to absorber markets. Understanding this competition is essential to realistic positioning.
Latin America
Chile and Peru dominate global copper production and reserves. Chile and Argentina’s lithium triangle holds reserves that dwarf African lithium positions. Brazil holds 82 per cent of global niobium reserves, now secured for European supply through the EU-Mercosur agreement signed in January 2026 after twenty-five years of negotiation. Latin American suppliers have advantages Africa lacks: geographic proximity to the US market, established infrastructure, decades of reliable supply history, and political relationships that predate the current supply chain competition.
The Lobito Corridor aims to provide Atlantic routing for African copper, but Chilean copper already flows west without new infrastructure investment.
Australia
Australia exports lithium and rare earths at scale. Australian mining operates under stable rule of law, contract enforcement, and regulatory predictability that many African jurisdictions cannot match. Australia has allied status with the United States through AUKUS, removing any contamination concerns. For Western buyers seeking secure supply, Australia is a safer bet than Africa on governance risk. Australian lithium competes directly with African lithium. Australian rare earths compete with emerging African rare earth production.
Indonesia
Indonesia demonstrates what decisive policy can achieve. The 2014 raw nickel export ban, fully enforced from 2020, forced downstream investment into Indonesian processing capacity. Chinese and Korean battery manufacturers built facilities in Indonesia to access nickel supply. Indonesia now dominates global nickel processing. Indonesia won the nickel race while Africa debated. The Indonesian example is instructive for what Africa might have done. It also closes the nickel market to African competition.
India
India may prove to be Africa’s most significant competitor for processing investment. Production-linked incentive schemes for batteries, electric vehicles, and solar manufacturing create attractive conditions for Western companies seeking non-Chinese processing capacity. India has scale, infrastructure, an English-speaking workforce, established manufacturing ecosystems, and a single sovereign that can make unified policy commitments. The EU-India trade agreement integrates India into Western supply chain architecture.
Western companies choosing where to locate processing facilities face a choice between India and Africa. India offers lower political risk, better infrastructure, established supply chains, and a unified regulatory environment. Africa offers proximity to extraction but fragmented policy environments and infrastructure deficits. India’s positioning as a processing destination may outcompete African processing aspirations even if African extraction leverage exists. The minerals leave Africa regardless.
The question is whether processing happens in Africa, India, or elsewhere.
Morocco
Morocco is playing a masterful hand by leveraging its Free Trade Agreement with the United States and its proximity to Europe. In 2024, Chinese battery giant Gotion High-Tech signed a USD1.3 billion deal to build Africa’s first EV battery gigafactory in Morocco. By manufacturing in Morocco, Chinese firms can potentially mitigate exposure to US FEOC restrictions under the Inflation Reduction Act while feeding Europe’s massive EV demand. Morocco demonstrates what strategic positioning can achieve.
The Competition Verdict
Africa competes in a crowded field. For minerals where Africa lacks concentration, competition is fierce and African positions are weak. Even for minerals where Africa has concentration, competition for processing investment exists. The leverage from extraction does not automatically translate into processing capacity when alternative locations offer superior business environments.
XII. The Pathways Assessed
Five strategic pathways are available to African policymakers. Each has been proposed by credible voices. Each has structural weaknesses. The task is identifying the least bad option, not the good one.
Path One: Strategic Autonomy
The strategic autonomy pathway maintains equidistance between great powers, refusing to align with either side, preserving flexibility to engage with whoever offers better terms. President Hichilema’s framing captures this approach: Zambia is too small to matter in great power competition. The request is to be left alone. The fatal flaw is that leverage depletes with time. Every month of strategic autonomy is a month during which Chinese lock-ins deepen, substitution advances, and bargaining power erodes.
The posture assumes that waiting preserves options. The reality is that waiting forecloses them. Both sides punish strategic autonomy. India faced 50 per cent US tariffs until accepting alignment terms on 2 February 2026: abandon Russian crude, commit USD500 billion in American purchases, reduce Indian barriers to zero. The tariff fell to 18 per cent. Strategic autonomy was not rewarded; capitulation was. The US reads balanced engagement as strategic ambiguity and responds with punishment. China tolerates ambiguity because the status quo favours Chinese lock-ins. Neither side offers better terms for waiting. Strategic autonomy from weakness means accepting punishment from both sides while building nothing.
The posture amounts to surrender presented as wisdom.
Path Two: Full China Alignment
The China alignment pathway accepts Chinese capital, infrastructure, and market access. It integrates African extraction into Chinese supply chains, prioritises Belt and Road financing, and accepts yuan exposure as diversification from dollar dependence. The fatal flaw is structural. China cannot absorb African manufactures. Chinese consumption is 39.9 per cent of GDP. Chinese manufacturing capacity systematically exceeds domestic demand. Chinese industrial policy is designed to dominate global manufacturing, not to import it.
Full China alignment locks Africa into permanent commodity extraction. Technology transfer does not occur because processing capacity in Africa would compete with Chinese refineries. Value accumulates in China. The liability sits with African sovereigns. The middleman captures the margin. The strongest version of the China case notes that Belt and Road delivers infrastructure and that Chinese engagement lacks the conditionality lectures that characterise Western relationships. These points are true. They are also insufficient.
Delivery of hardware is not delivery of capability. Vendor financing means Chinese contractors, Chinese equipment, Chinese supply chains. Africa owns the railway. The industrial learning curve largely stays external.
Path Three: Full US Alignment
The US alignment pathway structures everything for American market access. Maximum FEOC compliance. Full integration into US supply chain architecture. Clear alignment with Washington’s priorities on China competition. The fatal flaw is exclusion. The countries where African leverage is concentrated are contaminated. South Africa is BRICS. The DRC is substantially Chinese-controlled. Zambia has signalled non-alignment. Full US alignment may be unavailable for the assets that matter most. US reliability is also questionable.
AGOA lapsed in September 2025 and remains in legislative limbo. American engagement with Africa has been episodic for decades, spiking when China competition intensifies and fading when domestic priorities dominate. The current administration wants one-year AGOA extensions, not long-term commitments. Rwanda’s 2018 experience illustrates the costs: when Rwanda raised tariffs on imported used clothing to protect its domestic garment industry, the United States withdrew AGOA benefits, costing Rwanda approximately USD1.5 million annually in lost exports.
The US will not provide security guarantees. When a government that pivots toward the US faces Chinese economic retaliation, Washington offers statements, not protection. Full US alignment is too narrow because it excludes contaminated countries, too dependent because it relies on a single market, and too unreliable because American policy instruments shift with administrations, though the structural competition with China persists regardless of electoral outcomes.
Path Four: The Carney Model
The Carney Model builds middle-power coalitions, diversifies across multiple trading partners, and refuses full alignment with any hegemon. Mark Carney’s Canada is pursuing twelve trade deals across four continents in six months, signed an agreement with China on electric vehicles despite American pressure, and told the Trump administration: I meant what I said. Canada has forty million people, a USD2.1 trillion economy, 75 per cent export dependence on the United States, and the world’s third-largest oil reserves.
Canada also has unified sovereignty, experienced trade negotiators, existing industrial capacity, and institutional credibility that makes commitments believable. The fatal flaw for Africa is that the preconditions do not exist. Canada is one sovereign with unified trade policy, experienced negotiators, existing industrial capacity, and institutional capability to execute complex deals simultaneously. Africa is fifty-four sovereigns with competing interests, limited negotiating capacity, and no historical precedent for coordinated external engagement.
The African Continental Free Trade Area lacks enforcement mechanisms. The Secretariat has a few dozen staff. Rules of origin remain disputed. Common external tariffs are not harmonised. No African bloc has ever successfully negotiated a unified position against an external great power. Building AfCFTA coordination capacity takes years. By the time African institutions could execute the Carney Model, the leverage that would make it effective will have eroded. The Carney Doctrine requires coordination that does not yet exist.
Canada’s experience suggests even well-resourced middle powers struggle to sustain independent positioning against determined hegemonic pressure. The Carney Model is the correct destination. Africa should eventually be capable of collective bargaining, diversified partnerships, and genuine autonomy. The pathway to that destination cannot be direct because the organisational prerequisites do not exist within the available timeframe.
Path Five: EU/UK Diversification
The EU/UK diversification pathway accepts that US access may be effectively closed for contaminated countries and builds eligibility for European markets instead. The European Union must engage with Africa on platinum group metals and cobalt because alternatives do not exist at scale. The UK is hedging rather than following American punishment approaches. The fatal flaw is scale. The EU and UK are smaller absorber markets than the United States. European bureaucracy is slow. EU-Mercosur took twenty-five years to negotiate.
European conditionality exists through the Critical Raw Materials Act. But Europe must engage. The EU imperative creates leverage that American punishment cannot eliminate. For contaminated countries, EU/UK diversification is the viable pathway because it is the only pathway where structural buyer constraints create African leverage.
The Verdict
Each pathway examined above fails a necessary condition. The question then becomes: what can actually be built within the constraints? The answer requires a two-track framework. Track A pursues full multi-absorber eligibility for clean countries and assets where US, EU, and UK access is available. Track B pursues EU/UK diversification for contaminated countries and assets where US access is effectively closed but European structural constraints create leverage regardless. This framework captures some value rather than none.
It builds some capacity where conditions permit. It creates some optionality before choices narrow further. It is the least bad pathway in a set of bad options.
XIII. The Security Dimension
Any alignment strategy must address the security question: who protects countries that pivot? The honest answer is that no external power provides meaningful guarantees.
American Limitations
The United States will not extend a security umbrella to African mineral assets. AFRICOM has 6,000 personnel for fifty-four countries. Compare this to 28,500 personnel in South Korea and 50,000 in Japan. Africa is not a security priority for Washington. The US could not protect a drone base in Niger when the political environment shifted. The US will not fight for copper mines in Katanga or platinum refineries in Rustenburg. When an African government that pivots toward American supply chain priorities faces Chinese economic retaliation, Washington will issue statements expressing concern.
Statements do not protect mining ministers from pressure.
Chinese Tools
China has tools for retaliation that do not require military force. Debt leverage allows acceleration of repayment schedules or tightening of refinancing terms. Infrastructure projects can be frozen or delayed. Diplomatic pressure through African Union voting blocs can isolate defectors. Economic retaliation through trade diversion and investment withdrawal imposes costs without confrontation. Wagner, the Russian private military contractor whose operations in the Sahel increasingly align with Chinese strategic resource interests, and its successor networks provide additional tools for influence in security-fragile environments.
These operate below the threshold of conventional military engagement but create pressure that African governments feel.
The Asymmetry
Countries that pivot from Chinese relationships toward Western supply chain integration face retaliation from the side they leave without protection from the side they join. This asymmetry is structural, not temporary. The US benefits from African supply chain alignment but is not willing to pay the security costs of protecting it. China loses from African defection and is willing to impose costs to prevent it. The payoff matrix favours Chinese deterrence over American reassurance.
Risk Distribution
If security guarantees are unavailable, the strategy must be risk distribution rather than risk elimination. Multi-absorber eligibility reduces dependence on any single partner. Maintaining some relationships across the divide preserves options. Avoiding complete identification with either side limits retaliation exposure. The two-track framework serves this purpose. Track A countries maintain access to multiple absorber markets. Track B countries accept that US access is effectively closed but preserve EU and UK relationships.
Neither track requires complete alignment that maximises retaliation risk from the excluded side. This is not risk elimination. African countries that position for Western supply chains will face Chinese pressure. African countries that remain in Chinese supply chains will face American punishment. The framework distributes risk rather than eliminating it. Distribution is the achievable objective when elimination is not available. The two-track framework assumes the absorber bloc and surplus bloc remain distinct.
If the United States succeeds in compelling European and British decoupling from Chinese supply chains (through secondary sanctions, compliance requirements, or alliance pressure) the distinction hardens. Track B countries would face not merely reduced Western premium but active exclusion from an integrated Western-aligned market. The framework’s durability depends on whether Washington can enforce bloc discipline beyond American borders.
XIV. The Two-Track Framework
The Coalition of the Eligible operates on two tracks, differentiated by market access availability. Both tracks serve the same purpose: capturing value during the leverage window to build the foundation for eventual autonomy.
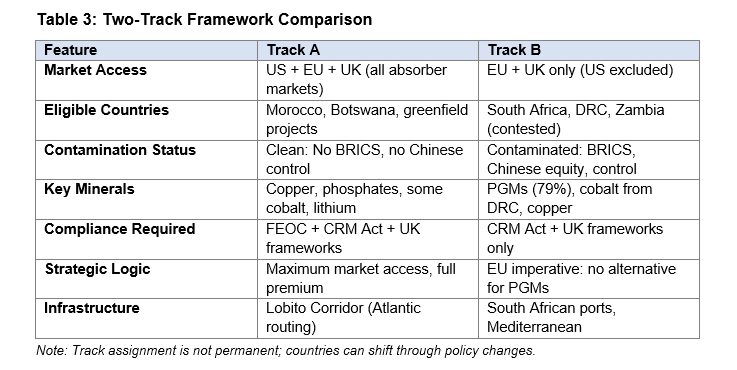
Track A: Full Multi-Absorber Eligibility
Track A serves countries and assets with clean access to all absorber markets. These include Morocco, with phosphate reserves and potential as a processing hub. They include greenfield projects anywhere that are structured without Chinese involvement from inception. They include Western-owned assets even in complicated countries where asset-level eligibility can be achieved despite country-level complications. Track A strategy builds FEOC compliance for US market access, Critical Raw Materials Act compliance for EU market access, and UK critical minerals framework compliance for British market access.
Maximum market access across all absorbers. Full processing investment where energy infrastructure permits. Westward logistics routing through the Lobito Corridor and Atlantic ports.
Track B: EU/UK Diversification
Track B serves countries and assets where US access is effectively closed due to contamination. South Africa, with BRICS membership and 30 per cent US tariffs, falls into Track B. Clean assets in the DRC and Zambia, where country-level positioning creates US complications despite asset-level eligibility, may require Track B positioning. Track B strategy builds EU Critical Raw Materials Act compliance and UK critical minerals framework compliance while accepting that US market access is unavailable.
The strategy leverages the EU imperative: Europe must engage on platinum group metals and cobalt because alternatives do not exist at scale. Track B is not second-best. It is alternative-pathway. For minerals where African concentration is highest, EU structural constraints create leverage regardless of American punishment. Track B assets access smaller but still substantial absorber markets.
Filter One: Mineral Scope
Both tracks prioritise minerals where genuine leverage exists. Tier One minerals have strong leverage with limited substitution risk. Platinum group metals, with 79 per cent African reserves and no substitutes for hydrogen catalysis and industrial applications, qualify. Copper production, with high ore grades and electrification demand regardless of battery chemistry, qualifies. Tier Two minerals have moderate leverage. Cobalt, with around 55 per cent of reserves and over 70 per cent of production but facing LFP and sodium-ion substitution, qualifies with time limits acknowledged.
Manganese and chromium, with moderate African concentration, qualify. Tier Three minerals lack meaningful African leverage. Lithium at 1.6 per cent of global reserves and rare earths at 2 to 3 per cent should not be strategic priorities. Resources devoted to these minerals could be better allocated elsewhere.
Filter Two: Energy Readiness
Processing is energy-intensive. Copper smelting requires 3,500 kilowatt-hours per tonne. Aluminium refining requires 14,000 kilowatt-hours per tonne. Processing without reliable power remains aspiration rather than strategy. The real distinction is not fossil versus green, but firm power versus variable energy. Firm power is power you can call on when you need it, for as long as you need it. Variable energy shows up when conditions allow. They serve different functions in an economy, and variable energy cannot replace firm power at scale without major system-level trade-offs.
China demonstrates this: in 2024, China invested over USD625 billion in clean energy and dominates global solar manufacturing, yet 86 per cent of its primary energy remains fossil-based. Record renewable deployment and sustained fossil dependence coexist structurally. Tier One energy readiness means processing is viable now. Morocco has grid infrastructure that includes both firm power from existing generation and expanding renewable capacity layered on top as additive energy. South Africa has grid challenges but existing processing capacity anchored by coal-fired baseload.
These countries can host processing expansion. Tier Two energy readiness means processing is viable with identified power solutions on a five-year horizon. Specific projects with dedicated power arrangements can proceed even in countries with general energy deficits. Tier Three energy readiness means extraction only. Countries with unreliable power cannot host processing facilities regardless of other advantages. They participate through extraction that feeds processing hubs elsewhere.
Filter Three: Infrastructure Routing
FEOC-compliant minerals that route through Chinese-controlled ports are not actually Western supply chain. Physical logistics determine market access regardless of ownership structure. Tier One logistics priority goes to Lobito Corridor adjacent assets. Angola, the DRC, and Zambia have Atlantic access through the corridor currently under development with US and EU backing. These assets can physically reach Western markets through non-Chinese infrastructure. Tier Two logistics covers Atlantic and Mediterranean accessible assets.
Morocco and Namibia have direct Atlantic shipping. Ghana has port infrastructure. These assets can route westward without dependence on Chinese-controlled logistics. Tier Three logistics serves Indian Ocean dependent assets. Tanzania and Mozambique’s existing rail and port infrastructure runs eastward: Dar es Salaam and Beira serve Indian Ocean trade routes. Westward routing to the Atlantic (connecting to Lobito Corridor) would require new rail infrastructure through the DRC or Zambia, a capital-intensive proposition that explains why these countries currently fall outside Track A corridor positioning despite significant mineral endowments.
Until such infrastructure exists, these assets face logistical constraints that limit Western supply chain integration. Corridor analysis focuses on primary extraction-to-port routes for current critical mineral production. East African logistics in Kenya, Somalia, and Eritrea serve different commodity flows. North African positioning in Egypt and Tunisia connects more directly to European markets via Mediterranean routes and falls outside the sub-Saharan focus of this assessment. Kenya’s potential role would emerge if Mrima Hill rare earth production materialises, requiring reassessment of eastern corridor infrastructure.
Filter Four: Third Capital Sources
Beyond Western development finance institutions and carefully structured Chinese arrangements, Middle Eastern capital provides a third source that reduces binary dependency. DP World offers alternative port operations to Chinese COSCO. UAE already operates ports across Africa. Sovereign wealth funds from the UAE and Saudi Arabia offer different terms than either Chinese Belt and Road financing or Western DFI conditionality. Direct equity investment with less political interference serves countries seeking capital without alignment complications.
Gulf capital presents a different risk. The UAE has committed USD110 billion to African projects and seeks positioning as an alternative to both Chinese and Western investment. But processing in Dubai or Abu Dhabi replicates the Chinese model: raw material exits, value capture occurs offshore, Africa remains input supplier. The Mopani copper acquisition in Zambia and UAE port investments across the Horn illustrate the pattern. Gulf capital should be welcomed, but tied to local beneficiation requirements, not permitted to build another captured supply chain.
The question is not whether capital arrives. The question is whether value stays. If UAE investment funds processing facilities in the Gulf, Africa loses value capture as completely as it does to Chinese processing. The demand must be explicit: UAE capital for African processing, on African soil, with African equity participation. Anything less is a different flag on the same extraction. Middle Eastern capital does not replace absorber market strategy. Gulf states do not consume at US or EU scale. But Middle Eastern investment supplements the capital stack and reduces dependence on the US-China binary.
The DRC-Zambia Template
The DRC-Zambia relationship illustrates a potential AfCFTA pathway. DRC extracts copper it cannot process domestically; Zambian smelters provide regional processing capacity. This cross-border value chain (extraction in one country, processing in a neighbour) offers a template for African economic integration that does not require every country to build complete value chains. The question is whether AfCFTA’s implementation can formalise and expand such arrangements before external competitors capture the processing stage.
XV. Country Assessments
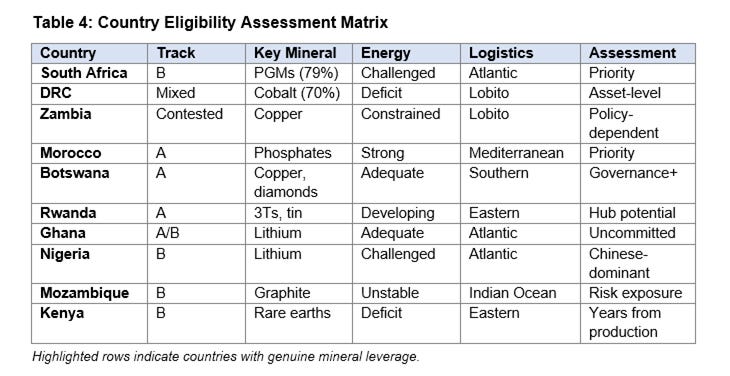
South Africa
Track assignment: Track B
Africa holds 79 per cent of global platinum group metal reserves, concentrated in South Africa’s Bushveld Complex, which is irreplaceable at scale. For PGMs, South African leverage is unmatched. South Africa is a BRICS member and faces 30 per cent US tariffs. Track A is unavailable at country level. Track B is the only pathway. The EU imperative applies directly. Europe needs PGMs for hydrogen economy and industrial applications. Europe has no alternative source. South Africa can demand better terms from EU buyers than from US buyers who have punished BRICS membership.
Energy constraints exist. Eskom’s grid challenges are well documented. Processing expansion requires power solutions. Existing processing capacity can be maintained and incrementally expanded.
Assessment: Track B priority. Build EU and UK eligibility. Accept US market access is effectively closed. Leverage EU imperative for better terms. Focus on existing processing capacity maintenance with incremental expansion where power permits.
Democratic Republic of Congo
Track assignment: Mixed, asset-level differentiation required
The DRC produces over 70 per cent of global cobalt. The leverage is genuine but time-limited as LFP and sodium-ion substitution advances. 41 per cent of DRC cobalt extraction is Chinese-controlled. Sicomines operates under 68 per cent Chinese ownership through the 2040s. These assets are Track B at best, possibly excluded from eligibility frameworks entirely. Western-owned assets exist. Ivanhoe Mines operates Kamoa-Kakula under Canadian and South African ownership.
These assets can pursue Track A eligibility at asset level despite country-level complications. The Lobito Corridor provides westward logistics for eligible DRC assets. Atlantic routing through Angola allows physical supply chain integration with Western markets.
Recent actions suggest the United States will support Track A carve outs when the asset can be structured for eligibility. In February 2026, Orion CMC agreed, on a non binding basis, to acquire a 40 per cent stake in Glencore’s interests in Mutanda Mining and Kamoto Copper Company, with rights linked to board representation and offtake direction. Read it as proof of concept: Washington will pay for eligible supply, and it will use capital to shape control outcomes in the DRC.
Assessment: Asset-level differentiation. Track A for Western-owned assets with Lobito routing. Track B for assets with contamination complications. Strategic focus on new greenfield developments structured without Chinese involvement.
Zambia
Track assignment: Contested, policy-dependent
Zambia produces copper with exceptionally high ore grades. Zambia’s 2025 copper production reached approximately 823,475 metric tonnes, an 8 per cent increase but short of the government’s 1 million tonne target. The KoBold Metals discovery, backed by Bill Gates and other investors, is projected to become one of the world’s largest high-grade copper deposits, potentially reshaping Zambia’s production trajectory within the leverage window. Yuan royalty and mining tax acceptance in October 2025 and President Hichilema’s non-alignment posture create contamination risk.
US may read these signals as insufficient commitment. First Quantum and Barrick operate major projects under Canadian ownership. Asset-level eligibility for Track A may be achievable despite country-level complications. Energy constraints bind. Kariba and Kafue hydropower face climate vulnerability.
Assessment: Contested territory. Current posture trends toward Track B. Policy change toward explicit Western supply chain commitment could recover Track A access. Asset-level strategy through Western-owned operations. Processing constrained by energy until solutions identified.
Morocco
Track assignment: Track A
Morocco holds significant phosphate reserves and has positioned as a potential processing hub. EU proximity, Mediterranean shipping access, and relatively developed infrastructure create advantages. Morocco has no BRICS membership or significant Chinese contamination. Track A is fully available. Energy infrastructure is more developed than most African countries. The grid includes firm power from existing generation with renewable capacity expanding as additive energy. Grid connectivity to European networks exists.
Assessment: Track A priority. Full multi-absorber eligibility. Processing hub potential for minerals that cannot be processed in energy-constrained countries. First-mover advantage in North African battery supply chain positioning.
Botswana
Track assignment: Track A with asset complications
Botswana has copper deposits and strong governance reputation. Rule of law and contract enforcement exceed regional norms. Khoemacau copper mine was acquired by Chinese interests in 2023. This specific asset is contaminated. Other assets and new developments can pursue Track A.
Assessment: Track A for non-contaminated assets and new developments. Governance advantage makes Botswana attractive for Western investment. Focus on greenfield opportunities structured without Chinese involvement.
Zimbabwe
Track assignment: Track B or excluded
Zimbabwe has lithium deposits, but African lithium at 1.6 per cent of global reserves does not constitute leverage. Heavy Chinese presence in Zimbabwean lithium projects compounds contamination. Zimbabwe’s lithium export ban demonstrates intent but faces execution risk. Without concurrent investment in domestic processing capacity and power infrastructure, the ban creates a production pause rather than a value chain shift. The strategy is time-sensitive: if processing capacity does not materialise within the leverage window, Zimbabwe risks losing market position to competitors who moved faster.
Sanctions history creates additional complications. US market access faces barriers beyond mineral-specific FEOC provisions.
Assessment: Low priority. Lithium lacks African leverage. Contamination is severe. Other countries offer better risk-adjusted opportunities.
Rwanda
Track assignment: Track A
Rwanda has operational refineries for tin, tantalum, tungsten, and gold. European partnership through the EIB, US DFC funding for lithium processing, and the Three Ts sector operate without major Chinese equity exposure. Rwanda supplies 31 per cent of US tin imports. Rwanda’s 2018 experience with AGOA illustrates US willingness to use trade access as leverage: when Rwanda raised tariffs on imported used clothing to protect domestic manufacturing, the US withdrew AGOA benefits.
The lesson is that US access comes with conditions.
Assessment: Track A priority. Processing capacity already exists. Governance reputation supports Western investment. Regional hub potential for East African minerals requiring FEOC-compliant processing.
Senegal
Track assignment: Track A with sectoral limitations
Senegal maintains West African governance leadership and serves as a francophone financial services hub. Political stability and institutional quality exceed regional norms. Senegal has phosphate reserves but phosphate is not an IRA-listed mineral for EV tax credits. Senegal’s coalition value is services and regional coordination capacity rather than mineral extraction.
Assessment: Track A for governance and services. Financial services hub for West African mineral processing finance. Policy coordination role rather than extraction leverage.
Kenya
Track assignment: Track B (Contested)
Kenya possesses significant undeveloped critical mineral deposits, most notably at Mrima Hill in Kwale County, where rare earth reserves are valued at USD62 billion according to 2013 Cortec Mining assessments, among the richest deposits outside China. The site contains neodymium, praseodymium, cerium, and dysprosium critical for permanent magnets, alongside 680 million kilograms of niobium. Base Titanium’s Kwale Mineral Sands Project has operated since 2013, producing titanium minerals primarily exported to China.
The strategic competition is intensifying. US officials visited Mrima Hill in mid-2025; Chinese nationals have been documented surveying the area; and in December 2025, Australia’s RareX and Iluka Resources formed a consortium to bid for mining rights. President Ruto’s administration has reformed mining sector licensing and aims to raise mining’s GDP contribution from 0.8 per cent to 10 per cent by 2030. However, Kenya faces structural constraints. The Mrima Hill licence was revoked in 2014 and remains in regulatory limbo.
The site is double-gazetted as both forest reserve and cultural monument. No feasibility studies or environmental assessments have advanced to development stage. Kenya’s Strategic Plan for Mining (2023–2027) emphasises lithium, graphite, and titanium but barely mentions rare earths.
Nigeria
Track assignment: Track B (Chinese-Dominant)
Nigeria represents the clearest case of Track B positioning in lithium. Chinese investment dominates: over 80 per cent of Nigeria’s lithium processing capacity is Chinese-financed, with Jiuling Lithium Mining Company and Canmax Technologies backing USD1.3 billion in facilities. Four processing plants are operational or under construction: a USD600 million plant near Kaduna, a USD200 million facility near Abuja, and two additional plants in Nasarawa state.
Minister of Solid Minerals Development Dele Alake has enforced domestic processing requirements: “Any company wishing to invest in Nigeria’s solid minerals industry must now add value locally.” Chinese companies have complied, with BYD establishing EV partnerships and Chinese firms discussing local electric vehicle manufacturing. Yet Nigeria’s lithium sector faces material governance challenges. Artisanal mining dominates extraction, creating traceability problems along supply chains. The Kangimi processing plant, inaugurated in 2024 with promises of 1,500 jobs, employed only 17 local youths by March 2025, primarily as security guards.
Lithium ore trades informally via social media platforms, complicating regulatory oversight.
Assessment: Nigeria cannot qualify for Track A under current FEOC definitions. Chinese ownership of processing capacity, absence of traceability systems, and informal artisanal supply chains disqualify Nigerian material from IRA tax credits. Track B positioning offers domestic value capture through Chinese partnership but forecloses Western market premium access.
Ghana
Track assignment: Track A/B (Uncommitted)
Ghana occupies a distinctive position: a mature mining jurisdiction with strong governance credentials but undeveloped critical mineral capacity. The country is Africa’s largest gold producer and ranks fourth globally in manganese, yet its critical minerals strategy remains emergent. The Ewoyaa lithium project (Ghana’s first critical mineral mining lease) was granted to Atlantic Lithium (Australia) in October 2023 for 15 years. The lease awaits parliamentary ratification.
Piedmont Lithium (US) holds a stake in Atlantic Lithium, positioning Ewoyaa as potentially Track A-compliant. Production of 300,000 tonnes of spodumene concentrate annually is targeted from 2025, subject to parliamentary approval. Ghana’s 2023 Green Minerals Policy requires domestic processing before export and mandates feasibility studies for chemical plant establishment. The government’s Growth and Sustainability Levy (2023) imposes a 3 per cent levy on mining gross production, raised from 1 per cent in the 2025 budget.
These measures signal intent to capture domestic value but raise investor cost concerns.
Assessment: Ghana’s uncommitted position provides strategic optionality. If parliamentary ratification proceeds with Atlantic Lithium’s Western-backed ownership structure intact, Ewoyaa could become one of few Track A-eligible African lithium projects. Delay or renegotiation with Chinese bidders would shift classification to Track B.
Mozambique
Track assignment: Track B (Graphite-Critical)
Mozambique has emerged as the critical test case for Western graphite diversification, and a cautionary example of “new-risking rather than de-risking.” The country hosts substantial graphite reserves essential for battery anodes, with Syrah Resources’ Balama mine in Cabo Delgado province representing the world’s largest graphite operation outside China. US development finance invested heavily: the DFC provided nearly USD250 million in loans to Syrah for both the Mozambican mine and a Louisiana processing facility.
Yet in late 2024, civil unrest following disputed elections forced Balama’s closure, triggering force majeure and loan default. The mine remains under operational uncertainty as of early 2026. On 30 January 2026, President Chapo opened DH Mining’s 200,000 tonne/year graphite processing plant in Niassa Province, a USD200 million Chinese investment. Chapo declared Mozambique “no longer a supplier of raw materials, but a producer, processor and exporter of materials.” The development illustrates the Track B bargain: processing capacity arrives, but under Chinese ownership and within Chinese supply chains.
The question is whether Mozambique captured meaningful value or merely shifted the location of Chinese-controlled processing. Other operators in Mozambique include Syrah Resources (Australian), AMG (Dutch), and Triton Minerals (Australian) in Cabo Delgado.
Assessment: Mozambique demonstrates that Western supply-chain investment carries its own vulnerabilities. Political instability, security risks in Cabo Delgado, and infrastructure constraints complicate Track A positioning. Chinese processing on African soil through DH Mining provides an alternative model, but one where value capture remains within Chinese supply chains. Track B is the realistic classification.
XVI. The Transitional Framing
The Coalition of the Eligible is not an end state. It is a bridge strategy designed to build the foundation that eventually enables genuine autonomy.
What the Bridge Builds
Capital accumulates through processing investment. Western supply chain participation brings investment flows that pure extraction does not. Processing facilities require capital expenditure. Technology transfer accompanies investment. Revenue streams from processed materials exceed revenue from raw extraction. Processing is the immediate objective because it represents the largest value capture gap. But processing is not the terminal goal. The full ambition is domestic manufacturing capacity (batteries, components, finished goods) that transforms resource wealth into industrial capability.
Processing is the necessary intermediate step that current African positioning has not yet secured. Technology transfers through compliance architecture. FEOC and Critical Raw Materials Act compliance require traceability systems, governance standards, and operational capabilities that build institutional capacity. Meeting compliance requirements forces capability development. Market relationships develop through sustained commercial engagement. Countries that supply Western markets for a decade have commercial relationships that pure commodity suppliers lack.
Relationships create options. Options create leverage. Institutional experience accumulates through operating within compliance frameworks. Governments that navigate FEOC requirements develop regulatory capacity. Civil servants who manage Critical Raw Materials Act compliance gain expertise. Institutional capability compounds over time.
What the Bridge Enables
The destination is domestic depth. African processing capacity owned by African entities. African value chains that do not depend on external processors. African market coordination through a functional AfCFTA. African capital mobilised for African development through instruments like diaspora bonds tied to development outcomes. This destination cannot be reached directly. The organisational capacity does not exist. AfCFTA cannot coordinate fifty-four sovereigns against great powers. Diaspora capital is orders of magnitude too small.
Energy infrastructure is insufficient for processing at scale. The bridge builds what is missing. Capital from processing investment funds infrastructure development. Technology from compliance requirements enables eventual African-owned processing. Market relationships create commercial foundation for diversification. Institutional experience prepares governments for more complex coordination.
The Timeline
The leverage window is five to seven years before substitution significantly erodes bargaining power. The bridge must be built during this window. Phase one, from 2026 to 2028, focuses on compliance and positioning. FEOC and Critical Raw Materials Act eligibility audits. Priority asset identification across all four filters. Energy solutions for priority processing sites. Lobito Corridor operationalisation. Phase two, from 2028 to 2032, focuses on processing build-out. First processing facilities operational.
Westward logistics infrastructure scaling. AfCFTA common external tariff on Chinese manufactures where feasible. Diaspora capital mobilisation instruments launched. Phase three, from 2032 to 2040, focuses on transition toward the destination. Processing capacity sufficient for collective bargaining. Multiple absorber relationships established. AfCFTA as unified negotiating bloc. Domestic depth sufficient for genuine autonomy. Without the bridge, Africa arrives at the post-leverage world with nothing built.
The minerals will have been extracted. The substitutes will have matured. The bargaining power will have evaporated. The opportunity will have passed.
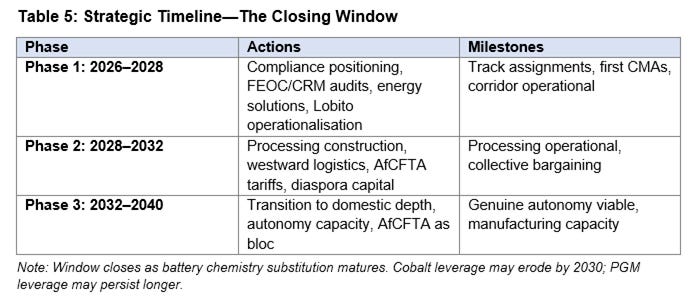
XVII. Why Policy Must Change
Current postures across key African countries are failure modes. They achieve neither strategic autonomy nor deliberate alignment. They preserve the appearance of options while watching leverage erode.
The South African Posture
BRICS membership and non-alignment rhetoric have resulted in 30 per cent US tariffs with no offsetting gains. South Africa processes PGMs domestically because of apartheid-era industrial policy, not because of Chinese partnership. The BRICS posture has cost market access without delivering alternative benefits. South Africa’s experience within BRICS offers a warning. Since joining the bloc, South Africa’s industrial position has deteriorated rather than strengthened. The steel sector illustrates the pattern.
Chinese imports triggered plant closures across Gauteng and KwaZulu-Natal. ArcelorMittal South Africa shuttered long-steel operations in 2025. South African steel now costs USD850–1,200 per ton to produce; Chinese steel arrives at USD552. A Chinese-built plant in Zimbabwe (now Africa’s largest) exports directly into the South African market, undercutting domestic producers. The trade structure has ossified. South Africa’s exports to China shifted from 15 per cent vehicles pre-BRICS to 0.4 per cent today, replaced by ores and minerals that now comprise 64 per cent of exports.
Chinese manufactured imports have, in the words of the Institute for Security Studies, “crowded out” South African industries with “devastating effects on SMEs.” BRICS membership did not deliver industrial development. It accelerated deindustrialisation. The question South African policymakers must answer is what, precisely, the relationship has provided beyond rhetorical solidarity and a seat at summits. The posture preserves nothing. The stance has triggered punishment without constituting strategic autonomy, and China cannot serve as an absorber market for South African value-added production.
The result is symbolic solidarity that costs real market access.
The Zambian Posture
President Hichilema’s non-alignment framing and yuan royalty and mining tax acceptance signal strategic ambiguity that the United States reads as insufficient commitment. The posture does not protect Zambia from either side. It does not extract concessions. It watches leverage erode while declaring neutrality. Zambia has copper reserves that every power wants. The Lobito Corridor runs through Zambian territory. The positioning could not be better for extracting value. The posture forfeits that positioning for the comfort of appearing uninvolved.
The DRC Posture
The Sicomines structure makes the DRC a junior partner in the extraction of its own minerals. 68 per cent Chinese ownership through the 2040s locks in value transfer for decades. New projects continue to be structured with Chinese involvement despite alternatives being available. The posture is not strategic calculation. It is path dependence. Chinese capital arrived first. Chinese capital continues to arrive. The structural implications are not evaluated against alternatives.
The Argument for Change
The current postures do not protect anyone. Strategic autonomy is being punished. Chinese lock-ins are deepening. Leverage is depleting. Every month of current posture is a month of foregone positioning. Policy change requires accepting short-term adjustment costs for long-term structural positioning. Consumer prices may rise if Chinese manufactures face tariffs. Chinese financing may slow if relationships shift. Diplomatic complications may arise. The alternative is watching the window close while preserving the illusion of options.
The alternative is arriving at the post-leverage world having built nothing. The alternative is remaining a commodity supplier to whoever shows up with immediate terms. The question for policymakers is not whether change is comfortable. The question is whether the current trajectory leads anywhere worth going. The evidence suggests it does not.
XVIII. Conclusion
The analysis confirms a difficult truth: no pathway escapes fundamental constraints. Full US alignment excludes contaminated countries and relies on an unreliable partner. The Carney Model requires coordination capacity Africa lacks within the available timeframe. EU/UK diversification is smaller scale than desired. The Coalition of the Eligible is recommended because it is least bad, not because it is good.
It captures some value before leverage evaporates. Processing investment during the five-to-seven-year window builds capacity that pure extraction does not. Some value exceeds no value. It builds some processing capacity where energy permits. Morocco and South Africa can host facilities. The Lobito Corridor enables DRC and Zambian integration. Some capacity exceeds no capacity. Risk distribution exceeds risk concentration.
It serves as bridge to domestic depth. The capital, technology, market relationships, and institutional capacity accumulated during the strategic window create the foundation for eventual autonomy. The Carney Model becomes possible when the organisational prerequisites exist. Building those prerequisites requires the bridge. This working paper is the first in a series. It establishes the least bad path for mineral-led industrialisation within the current geoeconomic rupture. The prior question (whether mineral-led industrialisation is the right objective at all) remains open.
That question will be examined in subsequent work. The forced choice is not between Washington and Beijing. It is between remaining a commodity supplier to whichever great power offers immediate terms, or building the capacity to eventually negotiate from strength. Option one is the default. It is what happens if Africa does nothing. Chinese lock-ins deepen. Substitutes mature. The window closes. Africa arrives at the 2030s with nothing built. Option two requires action. Imperfect action. Multi-absorber eligibility with acknowledged limitations.
Two-track framework for contaminated and clean countries. UAE capital to reduce binary dependency. Energy solutions as hard filters. Explicit transitional framing. The destination is domestic depth: African processing, African value chains, African market coordination, African capital for African development. That destination is correct. The pathway to that destination cannot be direct because the organisational prerequisites do not exist. The Coalition of the Eligible is the bridge. Without the bridge, the destination is unreachable.
Africa will arrive at the post-leverage world having built nothing, dependent on whoever offers terms, with no bargaining power to extract value. The forced choice is whether to build the bridge.
References
Adegoke, Y. (2026) ‘Trump courts African minerals giants as China rivalry escalates’, Semafor, 28 January.
AfDB (2024) African Economic Outlook 2024. Abidjan: African Development Bank.
Africa Center for Strategic Studies (2025) ‘China’s Critical Minerals Strategy in Africa’, December.
African Business (2026) ‘African Growth and Opportunity Act extension passes US House’, 14 January.
Afrikan Identity (2025) ‘The UAE’s Growing Influence in Afrika’, Medium, 15 February.
Al Jazeera (2026) ‘China’s Xi Jinping, UK’s Keir Starmer agree to deepen economic ties’, 29 January.
Al Jazeera (2026) ‘EU states’ nod on Mercosur trade deal ends 25 year wait’, 9 January.
Aninver Development Partners (2025) ‘Credit Ratings in Africa: Driving Investment and Infrastructure Growth’, April.
Ansoff, H.I. (1957) ‘Strategies for Diversification’, Harvard Business Review, 35(5), pp. 113 to 124.
Atlantic Council (2025) ‘Experts react: What Trump’s National Security Strategy means for US foreign policy’, December.
Atlantic Council (2025) ‘At Trump’s recent summit, the US talked trade. But West Africa wants security first’, 10 November.
Barney, J. (1991) ‘Firm Resources and Sustained Competitive Advantage’, Journal of Management, 17(1), pp. 99 to 120.
BIS (2025) Global Liquidity Indicators, Q4 2024. Basel: Bank for International Settlements.
Bloomberg (2025) ‘China’s Yuan Is 25 per cent Undervalued on Trade Basis, Goldman Says’, 10 December.
Bloomberg (2026) ‘China Grapples With Longest Deflation Streak in Decades’, January.
BloombergNEF (2024) Energy Transition Investment Trends 2024. New York: Bloomberg Finance.
Boston University Global Development Policy Center (2024) China Africa Economic Bulletin, 2024 Edition. Boston: Boston University.
Brautigam, D. (2020) ‘A Critical Look at Chinese Debt Trap Diplomacy: The Rise of a Meme’, Area Development and Policy, 5(1), pp. 1 to 14.
Business Insider Africa (2026) ‘US, African Union Launch Strategic Infrastructure Working Group’, 28 January.
Canary Compass (2025) ‘From Grievance to Design: Why Africa Must Own the Math Behind its Risk Premium’.
Canary Compass (2025) ‘Zambia Monetary Policy: Structure Before Sentiment’, Parts 1 to 4.
CARI (2024) China Africa Trade Data. Washington, DC: China Africa Research Initiative, Johns Hopkins SAIS.
Carney, M. (2026) Address to the World Economic Forum, Davos, 20 January.
CATL (2024) CATL Announces World’s Largest Sodium Ion Battery Production Facility. Press release, July. Ningde: Contemporary Amperex Technology.
CGD (2025) ‘US Tariff Tyranny and Africa: An Update’, Center for Global Development, July.
Chang, H.J. (2002) Kicking Away the Ladder: Development Strategy in Historical Perspective. London: Anthem Press.
Chatham House (2026) ‘If Trump wants 2026 to be a year of critical minerals collaboration, he must stop imperialist rhetoric on Greenland’, January.
CNBC (2026) ‘Airbus, AstraZeneca and HSBC executives join UK’s Starmer on high stakes China trip’, 28 January.
CNBC Africa (2026) ‘Mozambique opens Chinese owned graphite processing plant’, 30 January.
Council of the European Union (2026) ‘EU Mercosur: Council greenlights signature of the comprehensive partnership and trade agreement’, 9 January.
Council on Foreign Relations (2026) ‘Behind Trump’s Peace Efforts: A Strategic Focus on Critical Minerals’, 29 January.
CRS (2025) ‘Critical Minerals and the Inflation Reduction Act’, Congressional Research Service Report R47681, January.
CSIS (2026) ‘New Executive Order Ties US Critical Minerals Security to Global Partnerships’, January.
DFC (2024) Lobito Corridor Investment Announcement. Washington, DC: US International Development Finance Corporation.
DFC (2025) ‘DFC joins USD1.8 billion Orion Critical Mineral Consortium to secure critical mineral supply chains and bolster US economic growth and security’, 23 October.
DMO Nigeria (2017) FGN USD 300 Million Diaspora Bond. Abuja: Debt Management Office of Nigeria.
EndGame Macro (2026) ‘China’s Consumption Trap: Structural Analysis’, X, January.
European Commission (2023) The European Green Deal Industrial Plan. Brussels: European Commission.
FAO (2023) The State of Food and Agriculture 2023. Rome: Food and Agriculture Organization of the United Nations.
Finance in Africa (2025) ‘Africa’s Sovereign Credit Ratings 2025: How Moody’s, S and P, Fitch are Repricing Risk’, December.
Financial Times (2026) ‘Alberta separatists and US officials’, 29 January.
Financial Times (2026) ‘US government backed fund agrees to buy stake in Glencore’s DR Congo mines’, 3 February.
FOCAC (2025) Forum on China Africa Cooperation 2024 to 2025 Action Plan. Beijing: FOCAC Secretariat.
Fortune (2026) ‘Carney says he really is planning a Canada split with the US along with 12 new trade deals’, 28 January.
Fox News (2026) ‘Treasury Secretary Bessent on Carney remarks’, 27 January.
FPRI (2024) ‘China’s Challenge to the International Economic Order’, Foreign Policy Research Institute, January.
FPRI (2025) ‘The New US National Security Strategy: A Transactional Document that Marginalizes Africa’, Foreign Policy Research Institute, December.
Gillmore, G. (2025) Africa Macro Strategy: Currency Co Movement and the Renminbi. Johannesburg: Standard Bank Group.
Glencore (2026) ‘Orion Critical Mineral Consortium to acquire a 40 per cent stake in Glencore’s DRC assets’, 3 February.
Goldman Sachs (2025) ‘Yuan Valuation Analysis: GSDEER and GSFEER Models’, Research note by Teresa Alves, 9 December.
Hichilema, H. (2026) Presidential Annual Greetings for members of the Diplomatic Corps, Lusaka, 29 January.
IEA (2024) Global Critical Minerals Outlook 2024. Paris: International Energy Agency.
IEA (2025) Global Critical Minerals Outlook 2025. Paris: International Energy Agency.
IMF (2024) Zambia: Staff Report for the 2024 Article IV Consultation. Washington, DC: International Monetary Fund.
Institute for Security Studies (2025) ‘Chinese manufactured imports and South African industry’, Analysis.
International Monetary Fund (2025) ‘IMF Conditionality Factsheet’, updated April.
IPI Global Observatory (2025) ‘Why African Countries Pay Billions More to Borrow’, November.
IRS (2025) ‘Notice 2025 10: Guidance on Clean Vehicle Credits’, Internal Revenue Service, January.
ISS Africa Futures (2025) ‘Indebted and underfunded’, Institute for Security Studies, 28 April.
Miran, S. (2024) ‘A User’s Guide to Restructuring the Global Trading System’, Hudson Bay Capital, November.
Mkandawire, T. (2014) ‘The Spread of Economic Doctrines and Policymaking in Postcolonial Africa’, African Studies Review, 57(1), pp. 171 to 198.
MOFCOM (2025) China Africa Trade Statistics 2025. Beijing: Ministry of Commerce of the People’s Republic of China.
Nantulya, P. (2025) ‘China’s Critical Minerals Strategy in Africa’, Africa Center for Strategic Studies, December.
Nicoletos, M. (2026) ‘The Elephant No One Wants to See: China’s Structural Economic Crisis’, 25 January.
NPR (2026) ‘What’s next for US Canada relations after Mark Carney’s pointed speech at Davos?’, 25 January.
OBBBA (2025) One Big Beautiful Bill Act. Public Law 119 21. Washington, DC: United States Congress.
OECD (2025) Africa Capital Markets Report 2025.
Overseas Development Institute (2022) ‘Africa’s External Debt: Creditor Composition Analysis’.
PBS News (2025) ‘Trump hosts Congo and Rwanda leaders to sign deal on peace, critical minerals for US’, 4 December.
PBS News (2026) ‘Carney says he told Trump: I meant what I said in his Davos speech on trade policy’, 28 January.
Pettis, M. (2025) ‘The Relationship Between Chinese Debt and China’s Trade Surplus’, Carnegie Endowment for International Peace, February.
Pettis, M. (2026) ‘Trade Wars Are Class Wars’, Carnegie Endowment commentary, January.
Pettis, M. (2026) Thread on China de dollarisation constraints, X, 2 February.
Porter, M.E. (1979) ‘How Competitive Forces Shape Strategy’, Harvard Business Review, 57(2), pp. 137 to 145.
Qiushi (2026) ‘Xi Jinping on renminbi reserve currency status’, Communist Party journal, 1 February.
Rabobank Research (2025) ‘US Grand Macro Strategy: The Trump Plan’, 10 September.
Rabobank Research (2026) ‘President Trumpachev or Gorump?’, 22 January.
Ratha, D., De, S. and Plaza, S. (2016) Migration and Remittances Factbook 2016. 3rd edn. Washington, DC: World Bank.
Responsible Statecraft (2025) ‘6 stories that defined Trump’s approach to Africa in 2025’, December.
Reuters (2024) ‘US conditions Zambia health aid on critical minerals access’, 12 December.
Reuters (2025) ‘US tariffs on India reach 50 per cent’, August.
Reuters (2026) ‘China trade surplus reaches record USD1.19 trillion’, January.
Reuters (2026) ‘Glencore in talks to sell 40 per cent stake in DRC mines to US backed consortium’, 3 February.
Rodrik, D. (2016) ‘Premature Deindustrialisation’, Journal of Economic Growth, 21(1), pp. 1 to 33.
Setser, B. (2025) ‘China’s Record Surplus and the Global Manufacturing Glut’, Follow the Money Blog. New York: Council on Foreign Relations.
Simons, B. (2025) ‘Africa’s Critical Minerals Leverage: Separating Myth from Reality’, IMANI Centre for Policy and Education and AGORA, November.
Standard Bank (2026) Inside China: China Consumption Conundrum. Johannesburg: Standard Bank Group Economic Research.
Stimson Center (2025) ‘Trump’s Critical Minerals Search in Africa Won’t Tip the Scales Against China’, 24 November.
Tchakarova, V. (2025) ‘Geoeconomic Statecraft: The EU’s Third Pillar Strategy’, FACE Policy Analysis.
Tchakarova, V. (2026) ‘The EU India Free Trade Agreement as a Geoeconomic Inflection Point’, January.
Tchakarova, V. (2026) Thread on middle powers and New Cold War dynamics, X, 31 January.
The Africa Report (2026) ‘Congress moves to renew AGOA for one year as Trump demands a say’, 26 January.
The African Brands (2024) ‘UAE Becomes Africa’s Largest Investor, Committing USD110 Billion to New Projects’, 27 December.
The Continent (2026) ‘Kenya’s first chipmaker caught in superpower crossfire’, 31 January.
The East African (2026) ‘Somalia protests expose UAE’s port power game in Horn of Africa’, 17 January.
The Exchange Africa (2026) ‘US Africa Relations: Critical Minerals Top Trump 2.0 Goal’, January.
The Hill (2026) ‘US to host critical minerals summit as Donald Trump eyes Greenland resources’, January.
Tindale, C. (2025) ‘The Sovereign Copper Spread as a System’, X, January.
Tindale, C. (2026) ‘The Chokepoint Mandate’, X, 28 January.
Tricontinental Institute for Social Research (2025) ‘Africa’s Faustian Bargain with the International Monetary Fund’, October.
UN DESA (2024) World Population Prospects 2024. New York: United Nations Department of Economic and Social Affairs.
UNCTAD (2023) World Investment Report 2023: Investing in Sustainable Energy for All. Geneva: United Nations Conference on Trade and Development.
UNCTAD (2024) World of Debt 2024. Geneva: United Nations Conference on Trade and Development.
UNCTAD (2024a) Economic Development in Africa Report 2024. Geneva: United Nations Conference on Trade and Development.
UNCTAD (2025) World Investment Report 2025: Investment and Sustainable Development.
United Nations Economic Commission for Africa (2025) ‘Experts Highlight Need to Enhance Transparency in Sovereign Credit Rating Methodologies’, May.
US Congress (2000) African Growth and Opportunity Act. Public Law 106 200. Washington, DC: United States Congress.
US Congress (2022) Inflation Reduction Act of 2022. Public Law 117 169. Washington, DC: United States Congress.
US Congress (2026) House Vote on AGOA Extension, 12 January; Senate Appropriations, 30 January.
US Department of State (2025) ‘Pax Silica Summit’, Office of the Under Secretary for Economic Affairs, 12 December.
US Department of State (2026) ‘US AUC Strategic Infrastructure and Investment Working Group Joint Statement’, 28 January.
US Department of the Treasury (2025) ‘Foreign Entity of Concern Guidance: Implementation of Section 30D Clean Vehicle Credits’.
US Treasury (2026) Statement on yuan undervaluation, 30 January.
USGS (2025) Mineral Commodity Summaries 2025. Reston, VA: United States Geological Survey.
USTR (2018) ‘President Trump Modifies Duty Free Treatment Under AGOA for Rwanda’, Press release, 30 July. Washington, DC: Office of the United States Trade Representative.
USTR (2025) 2025 Trade Policy Agenda and 2024 Annual Report. Washington, DC: Office of the United States Trade Representative.
White House (2025) National Security Strategy of the United States of America. Washington, DC: The White House, November.
White House (2025) Pax Silica Initiative: Securing Critical Mineral Supply Chains, 12 December.
White House (2025) Further Modifying the Reciprocal Tariff Rates, Executive Order 14326, 31 July.
Woodhouse, S. (2026) ‘Trump to Lower India Tariffs as Modi Pledges No Russian Oil Buys’, Bloomberg, 2 February.
World Bank (2025) International Debt Statistics 2025. Washington, DC: World Bank.
World Economic Forum (2026) Davos 2026: Special address by Mark Carney, PM of Canada, 20 January.
Disclaimer
This article does not constitute legal, financial, or investment advice. The author shares views for perspective and discussion only. Do not rely on them as a substitute for professional advice tailored to your specific circumstances. Always consult a qualified legal, financial, investment, or other professional adviser before making decisions based on this content. The analysis reflects proprietary research undertaken by Canary Compass and the author.
Canary Compass and the author accept no liability for actions taken or not taken based on the information in this article.
About the Author
Dean N. Onyambu is the Founder and Chief Editor of Canary Compass. His insights draw on experience across trading, fund leadership, governance, and economic policy.
The Canary Compass Channel is available on @CanaryCompassWhatsApp for economic and financial market updates on the go.
Canary Compass is also available on Facebook: @CanaryCompassFacebook.
For more insights from Dean, you can follow him on LinkedIn @DeanNOnyambu, X @InfinitelyDean, or Facebook @DeanNathanielOnyambu
Exceptional analysis on the absorber-surplus economy distinction. The point about China's structural inability to absorb African manufactures due to 39.9% household consumption really cuts through alot of the partnership rhetoric. The five to seven year leverage window before substitution (LFP batteries, sodium-ion) is sobering and I haven't seen that timeline articulated this clearly elsewhere.