
The Forecast Is Not the Evidence
Bank of Zambia Monetary Policy, February 2026: A Working Paper | 60-75-minute read

Image: AI-generated conceptual illustration, "The distance between the forecast and the evidence
SECTION 0: Executive Summary
On 11 February 2026, the Bank of Zambia’s Monetary Policy Committee reduced the policy rate by 75 basis points to 13.5 per cent. This paper examines whether the evidence available at the time of the decision supported that magnitude. The finding is that the direction of easing was defensible. The magnitude was not.
The evidence is drawn from published auction results, ZamStats price bulletins, six IMF programme reviews, Ministry of Finance debt service schedules, the 2026 National Budget, and the Bank of Zambia’s own data releases.
The structural context. The T-bill market operates under a pre-existing corridor trap at the short end. The condition was created during the 2023-2025 hiking cycle, when the BoZ raised the policy rate from 9.50 to 14.50 per cent but T-bill yields covered less than half that distance. The corridor floor overtook short-dated T-bill yields, making them unattractive relative to overnight deposits. Pension funds, who hold 49.5 per cent of outstanding Treasury bills, face a parallel disincentive: bonds paying 14.50 to 17.59 per cent dominate T-bills at every tenor (Ministry of Finance, Quarterly Debt Statistical Bulletin, Q4 2025). The 91-day T-bill yield sat below the overnight deposit floor before the February cut, and would have done so under any magnitude. The 75 basis point cut extended this condition from the short end into the medium tenors: the 273-day now sits at the policy rate, and the 364-day, as of the March 2026 auction, offers zero premium above the policy rate. The yield curve from overnight to one year is effectively flat. The entire T-bill curve is inside the trap.
Three consequences of the magnitude. First, the February decision reduced the room available to the May MPC. The corridor trap at the short end predates the February decision: it was created during the hiking cycle when the policy rate outpaced T-bill yields, and it would exist under any magnitude, including zero. What the 75 basis point cut did is extend the trap from the short end into the medium tenors (the 273-day and 364-day now offer zero premium above the policy rate) and leave the May MPC with less distance to work with. The operational consequence is direct: Treasury needs T-bill auctions to subscribe in order to manage the ZMW106 billion domestic borrowing programme. When three of four tenors fail to cover because yields offer insufficient compensation relative to overnight, the government cannot refinance its T-bill book at current yields. The corridor must come down for T-bill yields to offer a meaningful spread over overnight. The plumbing now requires a cut regardless of where inflation sits (2026 National Budget, paragraph 153: the Minister of Finance attributes the domestic debt servicing pressure to the 2015-2021 issuance cycle, with instruments “now maturing hence the big jump in the domestic debt servicing cost, particularly in 2026”). Had the MPC cut 25 basis points to 14.0 per cent, the May meeting would have had two to three months of confirmed within-band data and could have calibrated with evidence in hand. At 14.0 per cent, the 364-day would still have offered spread above the policy rate, preserving the last functioning T-bill tenor for the May MPC to work with. At 13.5 per cent, the 364-day, the last T-bill tenor that attracted meaningful demand, now sits at the policy rate with zero premium. The short end has operated below the corridor floor since the hiking cycle. The corridor must come down for the 364-day to offer compensation again. Second, a front-loading constraint: the government borrowed heavily in the first eight weeks of 2026, consuming 64.9 per cent of its annual domestic borrowing allowance. Treasury issued ZMW30.8 billion in face value across January and February against ZMW16.8 billion in maturities. Issuance must now slow. Smaller auctions compress yields through scarcity, not policy transmission. Third, a governance precedent. The decision was taken without a published forecast error record, without transmission evidence from the preceding cut, at the first monthly reading near the target band ceiling, in an electoral year where the IMF’s final programme assessment explicitly counselled prudence. If that is the evidentiary standard for the largest rate move in years, the standard for the next decision is lower.
The exchange rate dependency. The improved inflation projection, revised down 70 basis points from 7.6 to 6.9 per cent, is attributed by the Bank of Zambia itself to the lagged effects of the exchange rate appreciation. The kwacha appreciated 14.2 per cent between the November and February meetings. That appreciation reflects copper prices, mining sector FX supply, capital flows, and the Currency Directives. The BoZ issued the Currency Directives, and its FX operations (including the sale of mining tax USD receipts into the market) influence the exchange rate. The BoZ has a documented pattern of intervening aggressively in the FX market, as the IMF has flagged across multiple programme reviews, including selling USD in excess of programme allowances. But the ability to sustain any given level is constrained by reserves, and the level at 18.9 is a market outcome that depends on conditions outside monetary policy. The MPC statement attributed the improved projection to the exchange rate appreciation but did not specify what happens to the monetary policy stance if the assumption changes. That is a conditionality gap. At the 2026 budget exchange rate of approximately 20, the current rate of 18.9 compresses FX-linked revenues by approximately 5.5 per cent, a bounded shortfall of ZMW4.5 to 5.5 billion. The fiscal sensitivity is real but conditional on copper and the kwacha path.
The maximum defensible magnitude was 25 basis points, matching the November move. The case for 25 rested on three evidential legs, none of which were met for a larger move: no transmission evidence from the November cut, a single reading near the band ceiling (not inside it), and a CPI instrument whose weights have not been updated in 23 years. Seventy-five basis points was premature and disproportionate.
After 81 months above the target band, with GDP growth projected at 5.8 per cent and no published evidence of a negative output gap, the households who lost 31 to 39 per cent of purchasing power since 2019 needed the rate to settle inside the band long enough for price levels to stabilise. The economy was not in distress. There was no urgency.
A note on terms used throughout. “Transmission” refers to the mechanism by which a change in the policy rate reaches market interest rates and, through them, spending and investment decisions. “Corridor” refers to the Bank of Zambia’s interest rate corridor: the range between the overnight lending facility rate (ceiling) and the overnight deposit facility rate (floor) within which the interbank rate is intended to trade. “Corridor trap” is this paper’s term for the condition in which Treasury bill yields fall at or below the corridor floor, removing the incentive for banks to move capital from overnight deposits into short-dated government securities. “NDF ceiling” refers to the Net Domestic Financing ceiling set in the 2026 budget, which caps the government’s borrowing from domestic sources. “Carry trade” refers to the practice of borrowing in a low-yielding currency (typically US dollars) and investing in a higher-yielding currency (kwacha bonds) to capture the interest rate differential; the trade is profitable if the exchange rate holds but produces losses if the kwacha depreciates. “Pass-through” refers to the speed and magnitude with which exchange rate movements translate into consumer prices. “Sovereign-bank nexus” describes the relationship in which commercial banks hold large amounts of government debt, linking the health of the banking sector to the fiscal position and crowding out lending to the private sector. “Front-loading” refers to the concentration of government borrowing early in the fiscal year, which consumes borrowing headroom and constrains issuance later in the year.
SECTION 1: The Decision and the Question
On 11 February 2026, the Bank of Zambia’s Monetary Policy Committee reduced the Monetary Policy Rate by 75 basis points to 13.5 per cent. In November 2025, the MPC had reduced the rate by 25 basis points to 14.25 per cent, describing the move as cautious and measured. The February decision tripled the magnitude of easing. The MPC’s stated basis was a decline in headline inflation from 11.2 per cent in December 2025 to 9.4 per cent in January 2026, a revised projection placing the 2026 average at 6.9 per cent, and a judgement that the cut represented an appropriate monetary policy stance.
This paper examines whether the evidence available to the MPC on 9 to 10 February 2026 supported the magnitude of that decision.
This paper proposes a specific test for whether a rate cut has been transmitted: Treasury bill yields should move in the direction of the change, with subscription rates at or above 100 per cent, within two auction cycles. The logic is straightforward: if the policy rate signal reaches the domestic market, market rates follow and demand for government securities does not collapse. Two auction cycles (approximately four to six weeks) is a reasonable window for the domestic market to reprice. The November cut failed that test. The February cut failed it again. In Zambia’s financial architecture, the primary transmission channel, private sector credit, is weak to the point of non-function. Broad money at 29 per cent of GDP is too shallow to carry the rate signal into lending behaviour. Commercial banks hold government securities equivalent to 51 per cent of local currency deposits. True kwacha-originated private credit stands at approximately 7.4 per cent of GDP. The IMF, across its Third and Fifth Reviews, described the operational framework as actively hindering transmission. The remaining channels (sovereign yields, exchange rate expectations, and forward guidance) do function, but none required 75 basis points to operate. The bond market compressed on capital flows, not the rate quantum. The carry trade responded to the yield level, not the increment. The forward guidance could have been delivered at 25 basis points with explicit conditionality.
The strongest counter-argument is that the magnitude itself carried a signalling effect: by cutting 75 basis points, the BoZ communicated conviction in the disinflation path, and that conviction attracted capital. The evidence points against this. Uganda’s 10-year yield compressed 225 basis points in six weeks without a 75 basis point policy move. Ghana’s 91-day T-bill fell to 30-year lows. South Africa’s 10-year touched decade lows. The continental compression is driven by a global repricing of African sovereign risk, credit rating trajectories, and carry trade arithmetic, not by the quantum of any individual central bank’s rate decision. The directional signal matters. The magnitude does not change the capital flow dynamics that produced the result.
The paper proceeds as follows. Section 2 sets out the MPC’s stated case and the concurrent data. Sections 3 and 4 examine what the return to the inflation target band means at the price level, and whether the instrument measuring that return can be trusted. Section 5 sets out the IMF’s independent assessment across six programme reviews. Section 6 examines the exchange rate channel through which the improved projection was generated and what it costs. Section 7 presents the February auction evidence. Section 8 documents the information environment. Section 9 places Zambia’s yields in continental context. Section 10 proposes three governance moves. The close renders the finding.
SECTION 2: The MPC’s Stated Case and the Concurrent Data
The Bank of Zambia offered three reasons for the February cut. Headline inflation declined from 11.2 per cent in December 2025 to 9.4 per cent in January 2026. Projections showed faster convergence to the 6 to 8 per cent target band, with the 2026 average revised down 70 basis points to 6.9 per cent. The MPC described the cut as an appropriate monetary policy stance.
The November 2025 cut provides the baseline. On that occasion, the MPC reduced the rate 25 basis points to 14.25 per cent. The language was deliberate: “mindful,” “measured adjustment,” “elevated expectations.” Within weeks, three-month Treasury bill rates rose 50 basis points. Six-month rates rose 45 basis points. The first post-cut auction undersubscribed at 66.1 per cent. Two-year bond yields rose 50 basis points. The market did not follow the rate signal. The February decision tripled that signal in a system whose capacity to carry it had not changed. The MPC’s February statement dropped the cautious language of November entirely.
Between the November and February meetings, several concurrent data points were available alongside the improved inflation trajectory.
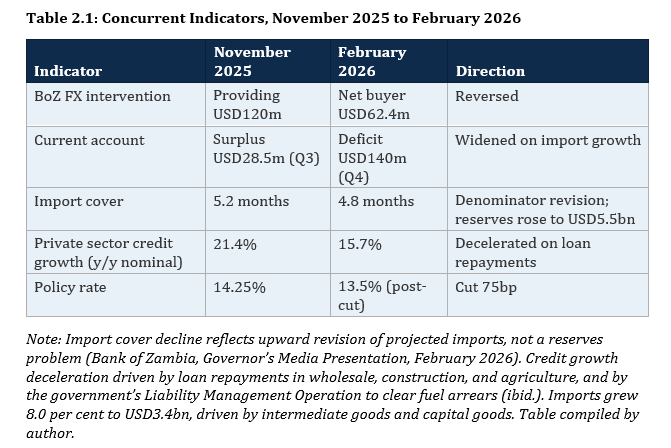
The concurrent data did not indicate economic distress. GDP growth was projected at 5.8 per cent. Imports grew on capital goods demand. Reserves rose. Credit growth at 15.7 per cent year-on-year nominal remained above nominal GDP growth; the deceleration reflected balance sheet housekeeping, not weakening demand. The FX intervention reversal and the current account swing are external position signals, not domestic demand signals. The economy was not in distress. There was no urgency requiring a tripling of the easing pace.
The case for the cut
The strongest version of the MPC’s argument deserves to be stated plainly. Inflation had fallen 7.1 percentage points from its 2023 peak. The kwacha had appreciated substantially. The IMF had completed a sixth consecutive successful programme review. Zambia had exited selective default. Credit rating agencies had assigned positive outlooks. The argument that the easing cycle should accelerate was not irrational. The forward-looking objection, that central banks are supposed to act on forecasts rather than trailing data, is valid in principle.
The evidentiary burden for doing so, however, rises in proportion to three conditions. First, when the transmission mechanism is documented as non-functional: a forecast-based cut into a broken transmission system is a bet that cannot be collected through the channel the cut is supposed to operate. Second, when the preceding cut produced no observable evidence of transmission: the November 25 basis point cut was the first test, and it failed. Third, when the instrument measuring the variable the forecast targets carries known structural limitations: the 53.5 per cent food weight flatters the disinflation trajectory by approximately 0.35 percentage points (Section 4).
The distinction between direction and magnitude maps to an unequal risk. A 25 basis point cut that proves too cautious delays stimulus by one MPC cycle: three months of slower easing in an economy growing at 5.8 per cent. A 75 basis point cut that proves too aggressive extends the pre-existing corridor trap into the medium tenors, uses the space the May MPC would need to respond to new data, and sets a precedent that weakens the evidentiary standard for the next decision. Even in a system where broad transmission is broken, the rate cut reaches the narrow segment that does have access to bank credit. Those borrowers receive economic relief in proportion to the magnitude, generate demand, and that demand works against the disinflation the cut was intended to support. A larger cut amplifies this effect through the narrow channel that functions. The cost of being too cautious is a delay. The cost of being too aggressive is a structural distortion that compounds. When the transmission mechanism is broken, the forecast instrument is biased, and the preceding cut produced no evidence, the risk favours caution on magnitude even when the direction is clear.
The purchasing power standard
GDP growth was projected at 5.8 per cent for 2026 against no published evidence of a negative output gap. Four in five Zambian workers operate in the informal sector with no access to bank credit at any price. For those households, the rate cut does not arrive. The economically disenfranchised, the majority of the population, do not hedge, do not shift portfolios, do not refinance. They carry the full weight of the price level.
After 81 months above the target band, the households who lost 31 to 39 per cent of purchasing power since 2019 needed the rate to hold inside the band long enough for price stabilisation to begin. One monthly reading at the boundary of the band is arrival. It is not recovery. The appropriate standard was to allow inflation to settle inside the 6 to 8 per cent range for at least two to three consecutive confirmed monthly readings before increasing the magnitude of easing beyond the 25 basis points already delivered in November. That would have placed the earliest window for a larger cut at May 2026, if March and April data confirmed sustained within-band readings and the November cut had produced observable transmission evidence.
The MPC cut at the moment of arrival, before recovery had begun, before the band had been held, before the price level had provided any meaningful relief. Prices rising more slowly is not the same as prices coming down. The rate returned to the band. The level remained.
SECTION 3: The Price Level
The last time inflation sat inside the Bank of Zambia’s 6 to 8 per cent target band, a 25-kilogramme bag of breakfast mealie meal cost K104.74. That was April 2019. Today, with inflation back inside that band at 7.5 per cent, the same bag costs K302.21. The rate has returned. The price level has not.
Central banks do not target price levels. They target rates of change. An inflation targeting framework, by design, accepts the level and celebrates the rate. This section does not argue that the Bank of Zambia caused the price level gap. Supply shocks, a pandemic, a sovereign default, and a currency crisis would have moved prices regardless. The section argues that the depth of the cumulative price shock since 2019 means the social buffer is exhausted. After 81 months above the target band, any monetary policy move that subsequently proves premature damages the credibility of the framework at the moment it needs to be rebuilt. The constraint operates through expectations, not sympathy. When households have experienced seven years of prices outrunning their income, the tolerance for error is the distance between where the price level sits and where the public believes the central bank can hold it. That distance is the widest it has been since the framework was adopted.
April 2019: the anchor
April 2019 is the correct starting point: the last month the headline rate sat inside the 6 to 8 per cent target band before the departure that lasted until February 2026. The comparison uses eight commodities drawn from ZamStats national average price tables for April 2019 (Table 9, Monthly Bulletin Vol 193) and February 2026 (Table 7, Volume 275). Selection criteria: identical product description and unit of measure across both bulletins; items representing the primary expenditure categories for low-to-middle income urban households; items whose price movements are not dominated by regulatory intervention. Cement is included because in Zambia’s urban and peri-urban economy, informal construction and home improvement represent a genuine and recurring household capital expenditure. The eight items are not a random sample of the 440-item basket. They are selected for welfare significance: the goods that households cannot substitute away from.
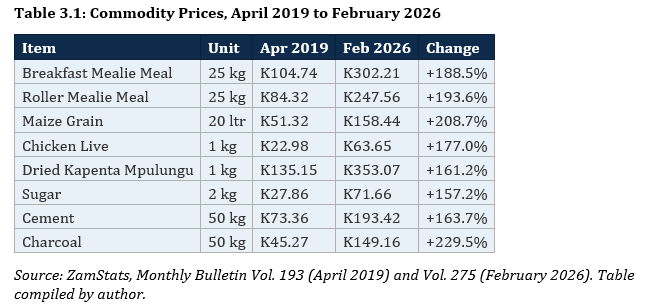
Charcoal, the primary cooking fuel for lower-income urban households, has more than tripled. Maize grain has more than tripled. The least damaged item is sugar, at 157 per cent. These are the floor of household survival.
What the target band would have produced
The period from April 2019 to February 2026 is 6 years and 10 months. This is a ceiling exercise, not a forecast. The counterfactual shows the maximum that the Bank of Zambia’s own framework permits: the price level at the target band ceiling, compounded from the last date the rate was inside that band. Everything above that ceiling is, by the Bank’s own stated standard, excess. Compounding each item at 6 per cent (the floor), 7 per cent (midpoint), and 8 per cent (the ceiling) produces the counterfactual.
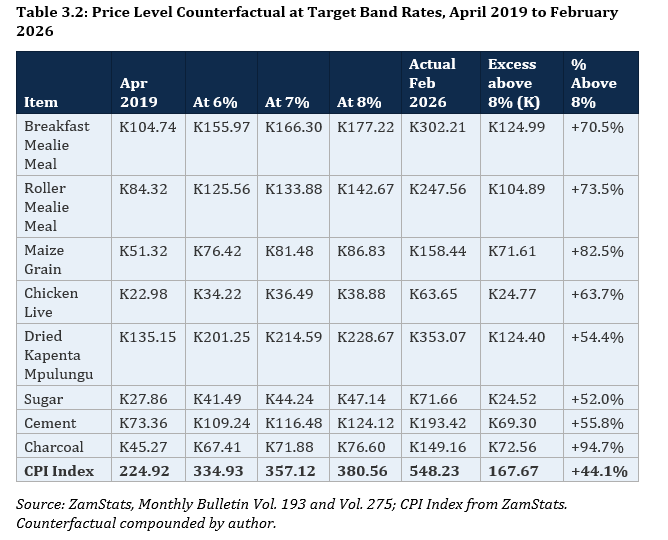
Every item exceeds the 8 per cent ceiling path. The CPI index sits 44.1 per cent above the most generous interpretation of the Bank of Zambia’s own framework. At the midpoint, 53.5 per cent. At the floor, 63.7 per cent. There is no version of the 6 to 8 per cent target band that produces K302 mealie meal or K158 maize grain.
The February 2026 ZamStats bulletin records negative year-on-year price changes on several staples: breakfast mealie meal fell 16.16 per cent, roller mealie meal fell 19.38 per cent, maize grain fell 30.74 per cent. These are real declines in the rate of change. They are irrelevant to the level. A bag of mealie meal at K302 in February 2026, down 16 per cent from K360, cost K104 in April 2019. The rate returned to the band in February 2026. The instrument that measures it has not been recalibrated since 2009.
SECTION 4: The Instrument the Central Bank Trusts
The Bank of Zambia’s inflation projections rest on a Consumer Price Index whose basket was last updated in 2009. The expenditure weights reflect consumption patterns observed in the 2002/03 Living Conditions Monitoring Survey. They have not changed since.
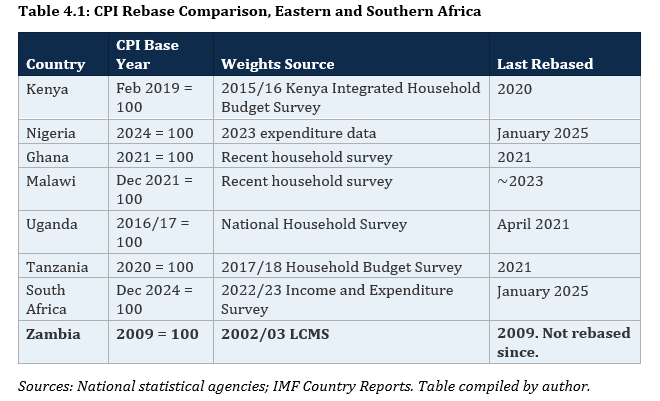
International guidance is unambiguous. The IMF CPI Manual (2020, Chapter 9) states weights should be updated at least every five years. The ILO resolution (17th ICLS, 2003) goes further: in periods of high inflation, updates should be more frequent. Five years is the minimum. Zambia’s weights are 23 years old. Every comparator country in eastern and southern Africa has rebased within the last five years.
The country the basket measures
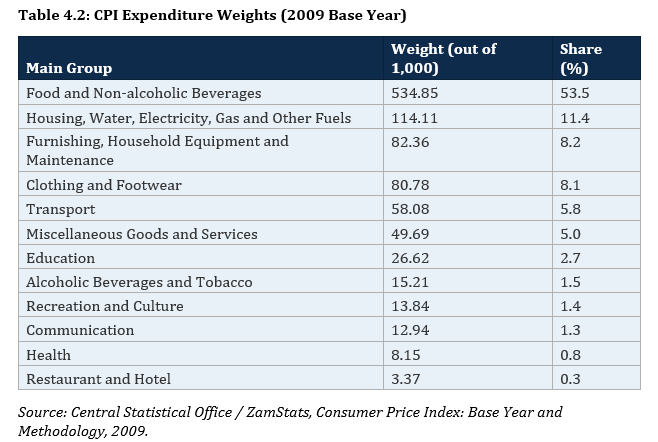
These weights describe a country where more than half of household expenditure goes to food, where communication costs barely register, where health expenditure is negligible, and where eating outside the home commands three tenths of one per cent. That country was Zambia in 2002/03. It is not Zambia in 2026.
Zambia’s urban population has risen from 34.7 per cent in 2000 to 44.7 per cent in 2022 (Census 2022). The 2022 LCMS confirms the national food expenditure share has fallen to approximately 46.7 per cent. The basket assigns 53.5 per cent: a gap of 6.8 percentage points. Mobile phone ownership has reached 92.9 per cent. Communication carries 1.3 per cent. Only 33.9 per cent of households have grid electricity; 57.6 per cent rely on charcoal. Housing carries 11.4 per cent; South Africa assigns 24.1 per cent. The informal economy accounts for 76.3 per cent of employment (LCMS 2022). These workers commute, buy prepared food, use mobile money, and pay for transport daily. Transport carries 5.8 per cent; restaurants carry 0.3 per cent.
What happened when other countries corrected the same distortion
Five African countries have rebased their CPI in the past four years. Where food was driving inflation and the old basket overweighted food, the rebase lowered the headline. Nigeria is the clearest case: the food weight fell from 51.8 per cent to 40.1 per cent and the reported rate dropped from 34.80 per cent to 24.48 per cent, a 10.32 percentage point reduction on revised weights alone. Kenya fell 1.5 percentage points. Ghana fell 1.6 percentage points.
Where food was not the dominant driver, the rebase raised the headline. Uganda’s increased by 0.4 percentage points. South Africa’s by 0.2 percentage points.
Where Zambia sits in the cycle
At the peak of the inflationary episode in March 2025, food was inflating at 22.3 per cent and the 53.5 per cent weight amplified that pressure. Zambia matched the Nigeria pattern: a rebase at that moment would have lowered the headline.
The MPC cut in February 2026, not at the peak. By February, the inflationary structure had shifted. Food inflation had fallen to 8.2 per cent, barely 0.7 percentage points above the 7.5 per cent headline. The categories inflating above headline (housing at 8.8 per cent, weight 11.4 per cent; health at 9.6 per cent, weight 0.8 per cent; restaurants at 9.5 per cent, weight 0.3 per cent; and miscellaneous goods at 9.4 per cent, weight 5.0 per cent) are precisely the categories the structural evidence confirms are underweighted. Their combined weight is 17.5 per cent. In South Africa’s rebased basket, the equivalent categories carry approximately 45 per cent.
Zambia in February 2026 matches the Uganda and South Africa pattern. The international evidence indicates the headline would move upward in a rebase, not downward.
A bounded sensitivity analysis quantifies the trajectory effect. Using Q1 2025 quarterly average inflation (overall 16.7 per cent, food 19.6 per cent, non-food 12.7 per cent; Bank of Zambia, Governor’s Media Presentation, November 2025) as the peak and February 2026 (food 8.2 per cent, non-food 6.5 per cent; ZamStats Vol. 275) as the endpoint, the old basket measures headline disinflation of approximately 9.0 percentage points. Under a rebased 46.7 per cent food weight, the measured disinflation is approximately 8.6 percentage points. The overstatement is approximately 0.35 percentage points. Food contributed 68 per cent of the total measured disinflation at old weights, because food was both the fastest-decelerating category and the largest weight. The direction of the bias is structural and holds under all plausible reweight scenarios. The magnitude, 0.35 percentage points, is approximately half of the 70 basis point improvement in the BoZ’s own forecast revision from 7.6 to 6.9 per cent. The instrument flatters the trajectory the MPC relied upon.
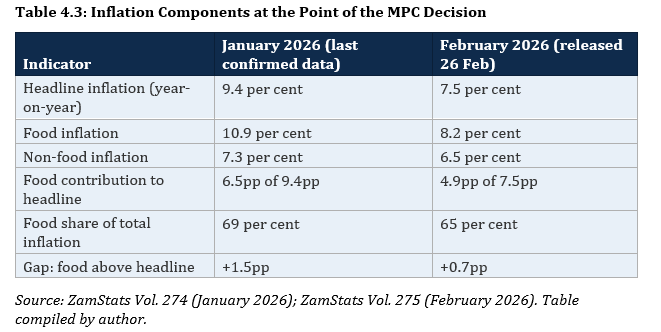
The January data showed food-driven persistence, not broad disinflation. Food inflation stood at 10.9 per cent, 1.5 percentage points above headline, contributing 69 per cent of all measured inflation in a basket that already overweights food. The moderation between January and February was real and significant, but the February data was published on 26 February, two weeks after the decision. The MPC calibrated its largest rate move in years to the January reading.
The known bias is in one direction. The unknown bias may reinforce it. The full 12-category expenditure breakdown required to construct updated weights does not exist in any publicly available document. The magnitude of the full rebase effect remains unknowable because the 2022 LCMS expenditure data has not been published in disaggregated form. ZamStats has confirmed that a Household Budget Survey will produce new weights for the forthcoming rebase. The capacity constraints at ZamStats are real and documented. They explain the delay in rebasing. They do not explain why the expenditure data collected in the 2022 LCMS has not been published in disaggregated form. The MPC calibrated the largest move in years to an instrument with an unquantified error bound. That is a governance finding, not a statistical complaint.
SECTION 5: What the IMF Saw
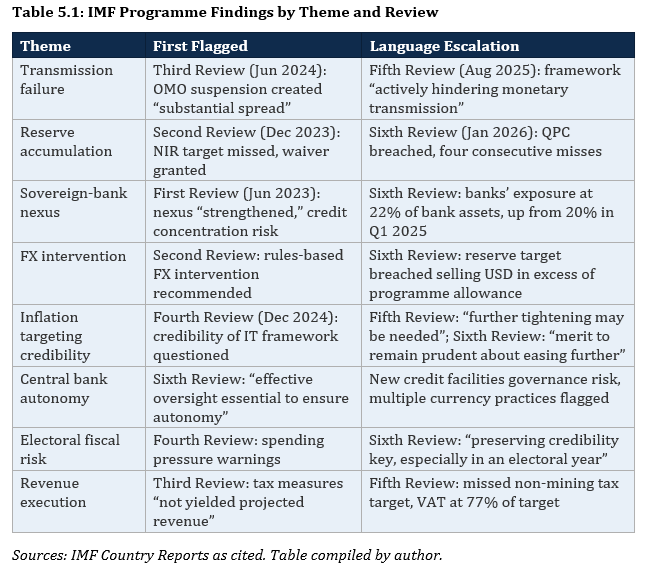
Between June 2023 and February 2026, the IMF conducted six programme reviews of Zambia under the Extended Credit Facility. The record constitutes an independent institutional assessment across the same period this paper examines. Report references: First Review (Country Report No. 23/260), Second Review (No. 24/009), Third Review (No. 24/171), Fourth Review (No. 24/373), Fifth Review (No. 25/194), Sixth Review (No. 2026/021). All available at imf.org.
The sovereign-bank nexus deserves specific attention. By the Sixth Review, banks’ exposure to government debt had risen to 22 per cent of banking sector assets. Measured against local currency deposits, commercial banks held government securities equivalent to 51 per cent as at end-September 2025, with true kwacha-originated private credit at approximately 7.4 per cent of GDP. The IMF’s Finance and Development (March 2026) documents the same dynamic across the continent: the sovereign-bank nexus in African low-income countries grew 4.8 percentage points between 2019 and 2024, the fastest of any group globally (Sy and Laws, “The New Face of African Debt”).
The easing warning was published on 31 January 2026, nine days before the MPC convened. IMF Acting Chair Nigel Clarke called for “careful monetary policy calibration” (Press Release No. 26/024, 27 January 2026). The staff-level agreement had noted that “the real policy rate is expected to increase in the coming months as inflation decelerates, hinting toward a tighter monetary policy stance” (Press Release No. 25/431, 18 December 2025). The BoZ responded by tripling the magnitude of the cut.
The IMF’s track record is mixed but the pattern is specific. The Fund’s structural diagnoses (transmission failure, reserve problems, sovereign-bank nexus, FX intervention practices) have been consistent and accurate across six reviews. Its timing forecasts have been wrong: it placed target-band convergence in 2027 when convergence arrived in early 2026. The February decision relied on the timing the IMF missed and ignored the structural warnings the IMF got right.
The same six reviews also record material progress. Zambia restructured approximately 94 per cent of its USD13.3 billion external debt, exiting Selective Default. S&P upgraded the sovereign rating. All three rating agencies assigned positive outlooks. The Sixth Review was the sixth consecutive to reach Board completion. Structural benchmark compliance, however, fell from 66 per cent to 42 per cent as the election approached. No successor programme had been announced and no numeric fiscal anchor had been published.
SECTION 6: The Exchange Rate and the Inflation Projection
The Bank of Zambia’s February MPC statement projects average inflation of 6.9 per cent for 2026, an improvement from the November projection of 7.6 per cent. The Governor’s presentation attributes the improved outlook to “the impact of the lagged effects of the recent appreciation of the exchange rate and expected favourable agricultural output” (Bank of Zambia, Governor’s Media Presentation, 11 February 2026). The exchange rate is the dominant input.
Between the November and February meetings, the kwacha appreciated from approximately 22 to 18.9 against the US dollar. That 14.2 per cent move generated the 70 basis point forecast revision. Zambia’s pass-through from exchange rate to consumer prices is high and immediate, as Structure Before Sentiment Part 1 documented. The kwacha’s level is not a target the Bank of Zambia announces, but the BoZ is not a passive observer. It issued the Currency Directives, it sells mining tax USD receipts into the market, and it has a documented pattern of intervening aggressively in the FX market, including selling USD in excess of programme allowances, as the IMF has flagged across multiple reviews. The ability to sustain any given level is constrained by reserves. The exchange rate at 18.9 is a market outcome that the BoZ’s actions influence but do not determine.
The Currency Directives matter. The revised Currency Directives, effective 26 December 2025, require domestic transactions to be settled in kwacha, with defined exemptions. They create genuine structural demand for the kwacha that previous appreciation cycles lacked. The directives are working. They provide a floor that is structural, not sentiment-driven. This paper supported the Currency Directives in Part 1 and continues to do so.
The fiscal sensitivity. A stronger kwacha compresses kwacha-denominated revenues across FX-linked lines: import VAT, customs duties, excise, mineral royalties, and USD-denominated grants. Import-linked taxes, royalties, and USD-denominated grants together constitute an estimated 40 to 48 per cent of budgeted domestic revenue, derived from the 2026 budget (2026 National Budget, Revenue Estimates). The FX-linked share is calculated from import VAT (estimated at 88 per cent of budgeted VAT, based on the FY25 ratio), customs duty, mineral royalties, export duties, a 30 to 50 per cent FX-linked share of excise duties, and USD-denominated grants.
The 2026 budget was constructed at an implied exchange rate of approximately 20 (derived from the ZMW3,832.4 million programme loan allocation against the USD190 million IMF ECF disbursement, 2026 National Budget, Resource Envelope). At 18.9, the kwacha is approximately 5.5 per cent stronger than the budget assumption.
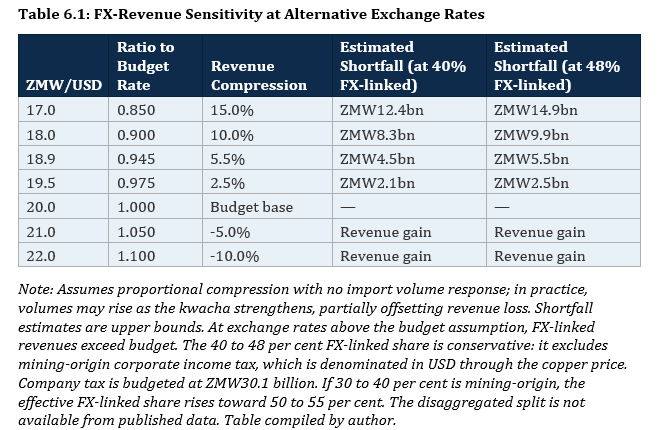
At 18.9, the estimated revenue shortfall on FX-linked lines ranges from ZMW4.5 billion to ZMW5.5 billion. This is bounded, not existential. If copper overperforms and the kwacha holds, higher USD-denominated production values may offset the exchange rate compression on royalties. If the kwacha strengthens further toward 18.0, the shortfall widens to ZMW8.3 to 9.9 billion. If it weakens toward the budget rate, the compression disappears.
The mineral royalty line illustrates the mechanism at the most transparent single revenue item. Mineral royalties, at ZMW18.2 billion, represent 8.8 per cent of the ZMW206.5 billion domestic revenue budget. At the current exchange rate of 18.9, all else equal, royalty collections compress to approximately ZMW17.2 billion, a shortfall of ZMW1.0 billion. Production growth of approximately 5.8 per cent at current copper prices would close the gap. At an exchange rate of 18.0, required production growth rises to approximately 11.1 per cent. If copper retreats toward consensus averages of USD11,000 to 12,000 per tonne in the second half, the required production growth increases further.
What the MPC statement did not address. The February MPC statement attributed the improved inflation projection to the exchange rate appreciation but did not specify what happens to the monetary policy stance if the exchange rate assumption underlying the forecast changes. That is a conditionality gap. The BoZ influences the exchange rate through its FX operations and the Currency Directives, but the level depends on copper prices, mining sector supply, and capital flows that monetary policy alone cannot sustain. If the exchange rate moves, the projection moves with it.
SECTION 7: The February Evidence
Three auctions across the decision
February brought three auctions that bracket the MPC decision. The Treasury bill auction on 5 February settled the day the MPC began deliberating. The bond auction on 13 February was the first post-cut issuance. The Treasury bill auction on 19 February was the second post-cut test. Together, they provide the cleanest observable test: identical instruments, identical issuer, pre- and post-cut pricing.
Treasury bills: where the domestic market speaks
The Treasury bill market is where domestic institutions price sovereign risk without non-resident influence. On 22 January, total bids at cost reached ZMW3.68 billion against ZMW2.20 billion offered. By 5 February, bids at cost had already fallen to ZMW2.91 billion. The market was weakening before the cut. By 19 February, eight days after the cut, bids at cost collapsed to ZMW1.86 billion against ZMW2.20 billion. Three of four tenors failed to cover: the 91-day drew ZMW139 million against ZMW440 million. The demand trend and the pricing conflict are distinct problems: demand was softening independently on liquidity conditions, and the corridor trap at the short end predates the cut. What the 75 basis point magnitude did is extend the pricing constraint from the short end into the medium tenors.
Bonds: capital flows, not policy transmission
The bond auction on 13 February appeared to tell a different story. Bids reached ZMW21.34 billion against ZMW4.20 billion offered. Yields compressed 40 to 120 basis points across the curve. Of the ZMW9.88 billion allocated, approximately ZMW6.8 billion went to non-resident investors: 69 per cent. Domestic institutions were minority participants in their own sovereign bond auction.
The 5-year received ZMW4.88 billion in bids but was allocated only ZMW42 million. Capital was directed into the 15-year, where ZMW8.82 billion in bids competed for ZMW560 million on offer. This is maturity management at scale: the sovereign needs long-duration paper to avoid recreating the refinancing wall, and only offshore capital bids at the long end in volume.
The liquidity sequence
On 6 February, interbank liquidity stood at ZMW5.16 billion. Some of that cash was likely offshore conversions parking in kwacha ahead of the bond settlement on 16 February. Seven days later, the bond auction absorbed ZMW9.88 billion in face value. The system drained. Six days after that, the 19 February Treasury bill auction could not attract bids equal to the amount offered. The sequence is instructive: transient liquidity from offshore conversions drove bond yield compression; the bond settlement drained that liquidity; the Treasury bill market, emptied of cash, undersubscribed. Liquidity conditions matter more than the rate signal. The February data does not contradict the November finding. It confirms it from the opposite direction.
The corridor trap
The arithmetic explains why banks stayed away from Treasury bills. The MPC rate sits at 13.5 per cent. The corridor runs 12.5 to 14.5 per cent. Now consider the cut-off yields the government accepted on 19 February:
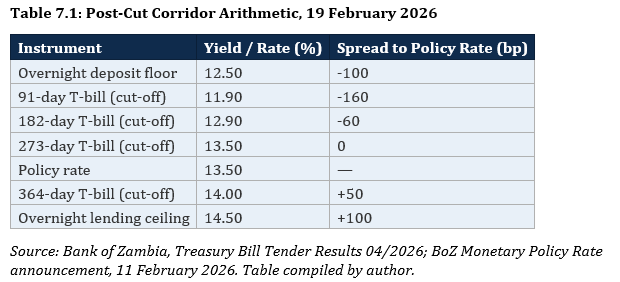
The 91-day sits 160 basis points below the policy rate and 60 below the overnight floor. A bank treasury desk weighing the 91-day at 11.90 per cent against overnight at 12.50 per cent faces negative carry for three months of locked capital. Banks that bid at yields inside the corridor on the 91-day (12.0 to 13.0 per cent) were rejected. The government capped the yield below the overnight floor. Neither side moved. The auction undersubscribed.
Treasury bills also serve as high-quality liquid assets (HQLA) under prudential requirements, generating compliance-driven demand independent of yield. That demand showed up: ZMW135 million on the 91-day. It was not sufficient to cover the auction. At yields below the overnight corridor floor, the carry is negative against the bank’s own funding cost. The HQLA incentive and the yield disincentive pulled in opposite directions. The auction result shows which force was stronger.
A note on responsibility. The corridor trap at the short end is a pre-existing condition. The central bank sets the policy rate and corridor bounds. The issuer sets cut-off yields. The 91-day clearing at 11.9 per cent reflects a cut-off yield the issuer accepted inside a corridor the central bank set. The 91-day trap would exist under any magnitude of cut, including zero. What the 75 basis point cut did is extend the trap from the 91-day into the 273-day and 364-day tenors. A 25 basis point cut would have left the corridor wide enough for the medium tenors to function.
The yield history
The distance between T-bill yields and the policy rate is not a product of the February decision. Historical auction data shows the 91-day traded at 9.50 per cent in mid-2023 when the policy rate was also 9.50 per cent. As the BoZ hiked through 2024 to 14.50 per cent, the 91-day followed but covered less than half the distance, reaching 11.90 per cent by February 2026. The gap was created from above during the hiking cycle as the policy rate outpaced T-bill yields. The easing cycle is now closing it from above, making the compression visible and acute. The 364-day T-bill converged to the policy rate by June 2025, five months before either cut, as part of an independent yield trend. The medium-tenor compression the paper identifies is partly a continuation of that trend, accelerated by the 75 basis point magnitude.
Pension funds hold 49.5 per cent of outstanding Treasury bills; commercial banks hold 44.6 per cent (Ministry of Finance, Quarterly Debt Statistical Bulletin, Q4 2025). Non-residents hold zero. When the T-bill auction undersubscribes, it reflects two investor classes pulling back for different reasons. Banks face negative carry against overnight on the short tenors. Pension funds face an opportunity cost against bonds paying 14.50 to 17.59 per cent. Both dynamics lead to the same outcome: the T-bill market cannot subscribe at yields below the corridor floor. Commercial banks hold 19.9 per cent of government bonds, concentrated in maturities of five years and shorter; beyond five years, the holders are pension funds (23.5 per cent of bonds) and non-resident investors (31.9 per cent of bonds).
Banks fulfil the 26 per cent statutory reserve requirement primarily through government bond and T-bill holdings, which simultaneously serve yield, prudential liquidity, and reserve compliance. The system is saturated in sovereign paper rather than flush in deployable cash: free current account balances average K2 to 6 billion against a banking system with over K100 billion in deposits. On 19 February, the day the T-bill auction undersubscribed, positive current account balances stood at K2.62 billion, down from K14.01 billion on 13 February when offshore conversions had flooded in ahead of bond settlement. Subscription rates at any given auction reflect the cash position of the banking system on that date, not the monetary policy stance (Structure Before Sentiment, Part 4, Section 10).
The stock of domestic debt contracted through government securities stood at K253,727 million (USD11,446 million) as at end-December 2025 (Ministry of Finance, Quarterly Debt Statistical Bulletin, Q4 2025). The Minister of Finance attributes the domestic debt servicing pressure to the 2015-2021 issuance cycle: “These instruments are now maturing hence the big jump in the domestic debt servicing cost, particularly in 2026” (2026 National Budget Address, paragraph 153). The market issuance requirement for 2026 is ZMW106.07 billion, with a further ZMW48.01 billion in interest expense funded from revenues (Section 7, auction data). Each maturity event returns kwacha to the banking system. New issuance reabsorbs it. The cycle is continuous. Bond auctions settle monthly between fortnightly T-bill auctions, creating a predictable cash cycle in which bond settlements tighten free cash ahead of the subsequent T-bill auction. This is a design feature of the auction calendar, not a February event. The question of whether the mid-corridor framework remains appropriate for Zambia’s liquidity environment is beyond this paper’s scope but warrants dedicated analysis (Structure Before Sentiment, Part 3).
The flat curve
The yield curve from overnight to one year is now effectively flat. The 364-day T-bill, at 13.50 per cent as of the March 2026 auction, offers 100 basis points above the overnight floor for twelve months of locked capital: approximately 8 basis points per month of additional compensation. In February, the same tenor offered 150 basis points, or 12.5 basis points per month. The compensation for duration is shrinking at each auction. The strong bidding interest at the 364-day in March (2.44 times subscription) reflects front-loaded demand from institutions capturing the last available spread before the next cut compresses it further, not durable appetite for the tenor. When that spread narrows to the point where the 364-day no longer compensates for the lock-up, the last functioning T-bill tenor stops working. At that point, no T-bill maturity offers a meaningful premium over overnight, and the government’s ability to fund its rolling T-bill requirement through the domestic market depends entirely on a further cut to the policy rate to push the corridor down.
The dominant mechanism to release the trap is to cut the policy rate further, pushing the corridor down until T-bill yields offer a meaningful spread over overnight. The 91-day has operated below the corridor floor since the hiking cycle and will do so under any rate level. The funding pressure is specific to the current state: the 364-day, the last tenor that attracted meaningful demand, now sits at the policy rate with zero premium. The corridor must come down for it to offer compensation again. The May MPC faces a choice in which the corridor arithmetic, not the inflation evidence, may drive the rate decision. That is the structural consequence of the magnitude: the 75 basis points pushed the medium tenors into the trap, and the funding requirement, not the data, now compels the next cut.
What the 75 basis point cut did is extend the trap from the 91-day, where it would exist under any scenario, into the 273-day and 364-day tenors. A 25 basis point cut would have left the corridor wide enough for the medium tenors to function. The magnitude widened the dysfunction. It did not create the underlying pressure.
There is a simpler reading. In a falling-rate environment, investors rotate into duration to capture repricing gains. Capital moves from the short end to the long end. The bond oversubscription and T-bill undersubscription are two sides of the same portfolio decision. That reading explains the long end. It does not explain the short end. If investors expect yields to fall, the rational response is to lock in current yields before the next cut compresses them further. The falling-rate thesis predicts oversubscription at the short end, not undersubscription. More importantly, it does not explain why banks bid at yields inside the corridor on the 91-day (12.0 to 13.0 per cent) and the government rejected them. That is a pricing conflict between issuer and market, not a portfolio preference. The corridor created the conflict. The auction result measured it.
The front-loading constraint
By 13 February, Treasury had issued ZMW28.98 billion in face value against ZMW14.46 billion in maturities. Net above maturities: approximately ZMW14.5 billion. Against an NDF ceiling of ZMW21.62 billion, 64.9 per cent of annual headroom is consumed in six weeks.
Auctions must shrink. Smaller auctions with residual demand compress yields through scarcity, not through any policy mechanism. Falling yields over March to May may appear to vindicate the 75 basis points. The mechanism will be supply-side.
The auction data
The annual market issuance requirement is ZMW106.07 billion: ZMW73.19 billion in bond maturities at cost, ZMW11.25 billion in Q4 2025 Treasury bills maturing in 2026, and ZMW21.62 billion in net domestic financing. Interest expense of ZMW48.01 billion is funded from revenues, not issuance. January absorbed ZMW12.65 billion. February’s three auctions update that position.
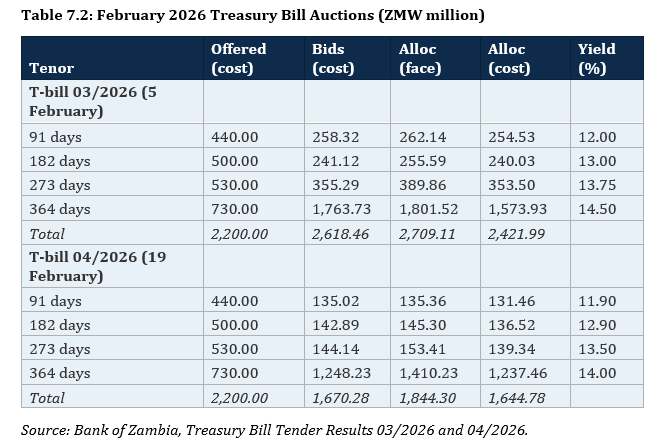
T-bill 03/2026, before the MPC met, subscribed at 1.19 times. T-bill 04/2026, after the cut, subscribed at 0.76 times. Demand halved across the decision. The 364-day absorbed the bulk of both auctions: ZMW1,574 million at cost in the pre-cut auction, ZMW1,237 million in the post-cut auction. Short-tenor demand was negligible at both dates, but the post-cut collapse was concentrated precisely where the corridor trap operates.
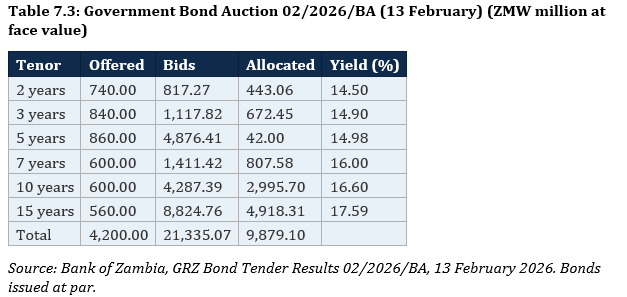
Subscription: 5.08 times. According to Reuters, no significant bond principal maturities fell in February. The entire ZMW9,879 million allocation was net new money, expanding the outstanding stock of domestic government bonds. In January, ZMW6,800 million in bonds matured, producing net new bond money of ZMW2,503 million. Cumulative bond net new money through end-February: ZMW12,382 million.
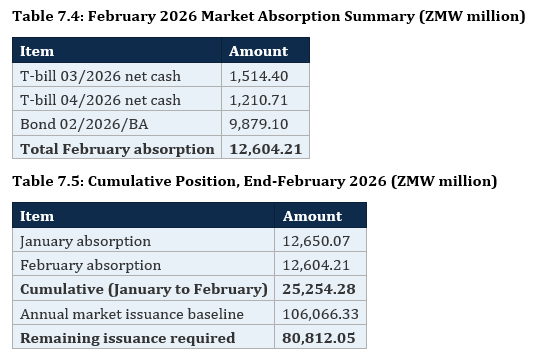
Twenty-four per cent of the annual issuance requirement absorbed in two months. The required monthly average across the remaining ten months falls to ZMW8,081 million. The required average allocation rate against remaining offered amounts at Q1 rates: 89.4 per cent.
Offshore participation and the refinancing wall
Non-resident investors took approximately 49 per cent of the January bond allocation and 69 per cent of February’s. Combined offshore absorption across two auctions: approximately ZMW11,375 million. Against the 23 per cent non-resident cap (ZMW24,395 million), two auctions have consumed 46.6 per cent.
Total non-resident cash outflows in 2026 total ZMW23.52 billion, or USD1.18 billion at an exchange rate of 20 (Ministry of Finance Q3 2025 Debt Service Schedule). The remaining non-resident refinancing requirement is approximately ZMW12,145 million. Ten bond auctions remain.
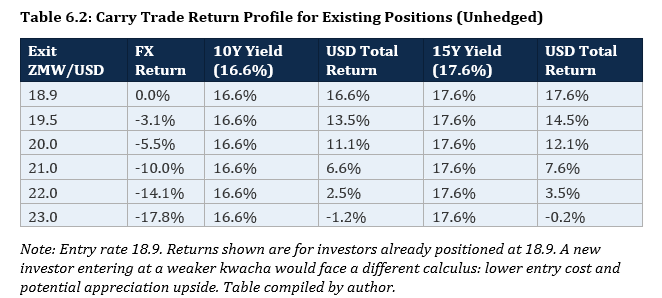
The composition of the January and February offshore participation matters. Some was new entry: investors converting US dollars to capture the carry trade, drawn by double-digit nominal yields and a kwacha that had appreciated 14.2 per cent. Some was front-loaded rollover: non-residents whose maturities fall due in June or December who moved early, fearing yields would compress and entry points worsen. New entry adds to the stock of offshore exposure and increases the refinancing requirement in future years. Front-loaded rollover reduces the remaining 2026 rollover risk but pulls demand forward from future auctions. The distinction is not visible in the auction results. It is visible in the participation data the Bank of Zambia holds.
The binding constraints
Three constraints now operate simultaneously.
The NDF ceiling is binding. ZMW7,578 million remains of annual headroom. At Q1 offered amounts with full allocation and light maturities of ZMW3,000 to 4,000 million per month, net issuance would run approximately ZMW5,100 million per month. Three months at that pace would exceed the remaining headroom. Treasury must reduce issuance.
The corridor trap constrains the T-bill market. T-bill 04/2026 raised ZMW1,844 million in face value against approximately ZMW2,197 million in maturing bills. The government could not fully refinance its T-bill maturities after the bond auction drained the system. The corridor inversion did not just suppress demand. It produced a net cash outflow on the T-bill book after 13 February.
The offshore cap constrains the bond market from the opposite direction. If non-resident participation continues at February’s 69 per cent, remaining cap headroom exhausts within three to four auctions. If it moderates to January’s 49 per cent, the cap accommodates the remaining ten.
These three constraints interact. The NDF ceiling forces smaller auctions. Smaller auctions with residual demand compress yields through scarcity. Compressed yields weaken the carry trade. A weaker carry trade thins offshore appetite precisely when the remaining ZMW12,145 million in non-resident rollovers must be absorbed. When heavy June maturities arrive, Treasury needs the market at scale again. But by then, yields may have compressed through supply restriction to levels that thin the carry trade and weaken offshore appetite.
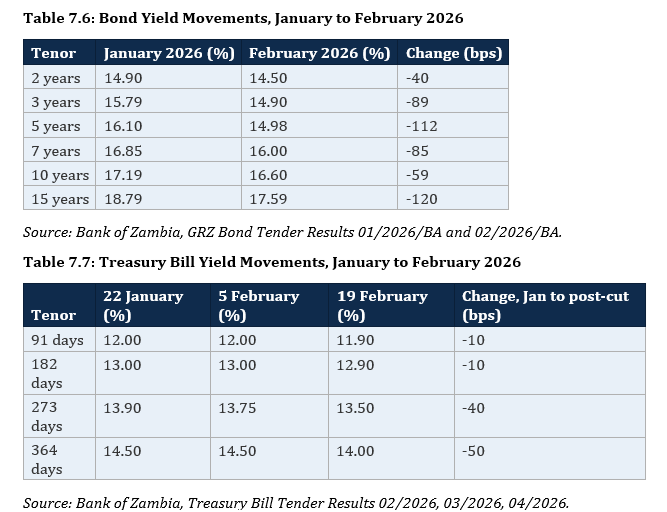
Yields compressed 40 to 120 basis points on the bond curve. T-bill yields moved 10 to 50 basis points on a 75 basis point cut. The bond compression was driven by offshore capital. The T-bill compression was driven by reduced supply in an undersubscribed auction. The policy rate sat in the middle. It moved neither market through transmission.
Post-decision update: March 2026
T-bill 05/2026, held on 5 March, is the third post-decision auction. Total bids at cost reached ZMW2,921 million against ZMW2,200 million offered, producing an overall subscription of 1.33 times. The headline crossed 100 per cent for the first time since the cut. The composition tells the fuller story: the 182-day subscribed at 40 per cent (ZMW198 million against ZMW500 million), worse than the February post-cut auction. The 91-day subscribed at 96 per cent. The 364-day absorbed the excess, with ZMW1,778 million in bids at cost against ZMW730 million offered. The 364-day yield compressed a further 50 basis points to 13.50 per cent, now exactly at the policy rate. Zero premium for 12 months of locked capital. Across three consecutive post-decision auctions, the corridor trap has climbed the entire T-bill curve.
SECTION 8: The Information Environment
Every data point cited in this paper carries a release date. The distinction between what the MPC had and what arrived later matters because a finding that relies on post-decision data is vulnerable to the charge of hindsight.
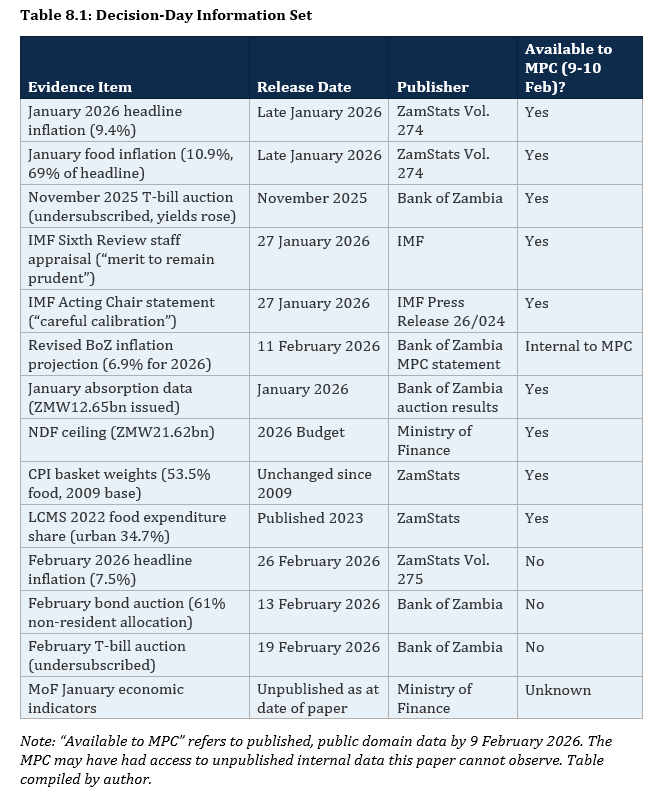
The MPC had the January inflation reading, the IMF’s caution, the November transmission failure, the CPI weight structure, the NDF ceiling, and the January issuance data. It did not have the February inflation reading, the February auction results, or the Ministry of Finance revenue data.
The Ministry of Finance January 2026 monthly economic indicators remained unpublished as of the date of this paper. These would cover the first full month under the revised Currency Directives, the first month of kwacha trading below 20, and the first month in which the fiscal compression described in Section 6 would appear. Their absence means the fiscal picture the BoZ cut into is only partially visible from the public record.
The chain of dependencies makes the absence consequential. The improved inflation projection depends on the exchange rate holding near 18.9. The sustainability of that exchange rate depends in part on fiscal confidence. Fiscal confidence depends on revenue execution data. Revenue execution data for the first month under the new exchange rate regime is absent from the public domain. A market operating without a successor IMF programme, without numeric fiscal anchors, and without monthly revenue data is pricing sovereign risk on incomplete information.
The MPC may have had access to internal Ministry data. But the principle of accountable monetary policy is that decisions should be justifiable on published evidence. The public cannot verify what it cannot see.
SECTION 9: The Yield Question
The question is not whether Zambia’s yields are competitive. They are. The question is what drives them and what the market is pricing that the policy rate is not.
On 13 February, offshore investors bid approximately ZMW21.3 billion into a single bond auction. Of the ZMW9.88 billion allocated, approximately ZMW6.8 billion came from non-residents. Six days later, the T-bill auction undersubscribed. No offshore participation. These two auctions, separated by six days, are the cleanest test of what moves Zambian yields. The bond market moved because offshore capital entered a shallow pool. The T-bill market did not move because the corridor trap, the yield arithmetic, and the liquidity position of the banking system on that date prevent domestic institutions from following the rate signal.
The real yield landscape
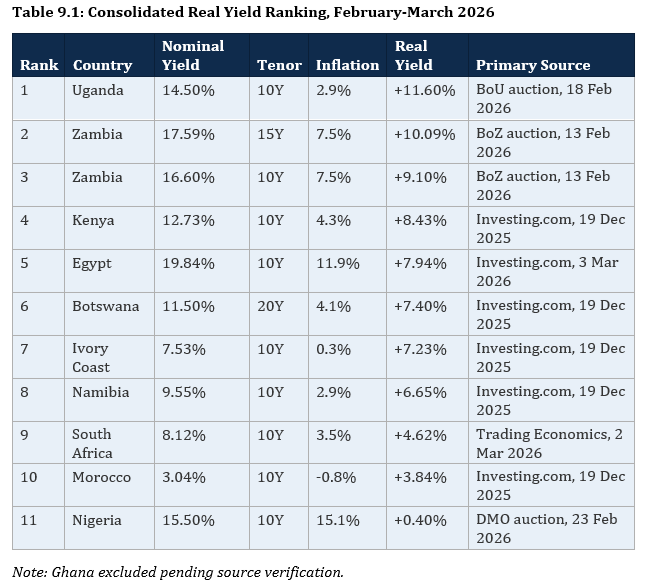
Zambia’s real yield of +9.10 per cent on the 10-year and +10.09 per cent on the 15-year rank among the most attractive sovereign exposures on the continent. The disinflation from 16.6 per cent in mid-2023 to 7.5 per cent today, combined with yield compression driven by capital inflows, has materially improved Zambia’s competitive position.
The continental compression
The compression is not unique to Zambia.
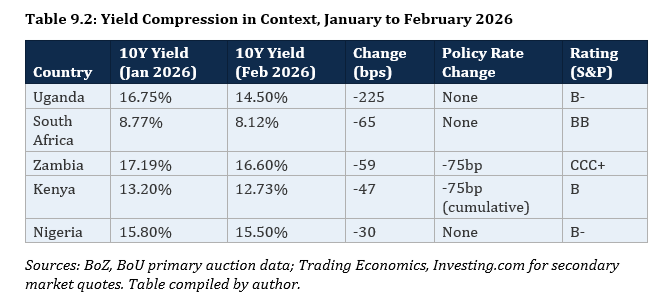
Uganda compressed 225 basis points without a 75 basis point policy move. South Africa compressed 65 basis points with no policy change. Nigeria compressed 30 basis points with no rate change. Zambia’s 59 basis points is within the range of its peers. The compression is continental, driven by a global repricing of African sovereign risk (Sy and Laws, IMF Finance and Development, March 2026), not by the quantum of any individual central bank’s rate decision.
Credit ratings and the currency risk premium
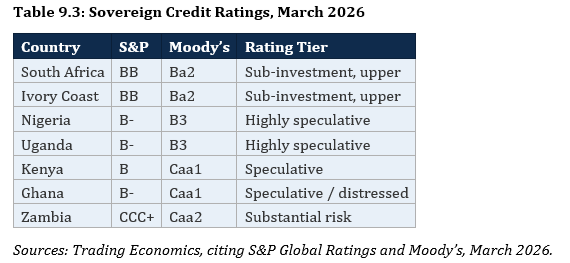
USD Eurobond yields are drawn from primary issuance: Kenya priced a dual-tranche Eurobond on 19 February 2026 at 7.875 per cent (7-year) and 8.70 per cent (12-year). Nigeria’s FGN 7.875 per cent February 2032 yielded 6.72 per cent and the 10.375 per cent December 2034 yielded 7.29 per cent (DMO, citing Bloomberg, 26 February 2026). Ivory Coast raised USD1.3 billion in 14-year notes at 7.125 per cent (Reuters, 19 February 2026). South Africa trades at approximately 5.5 to 6.0 per cent at the 10-year equivalent.
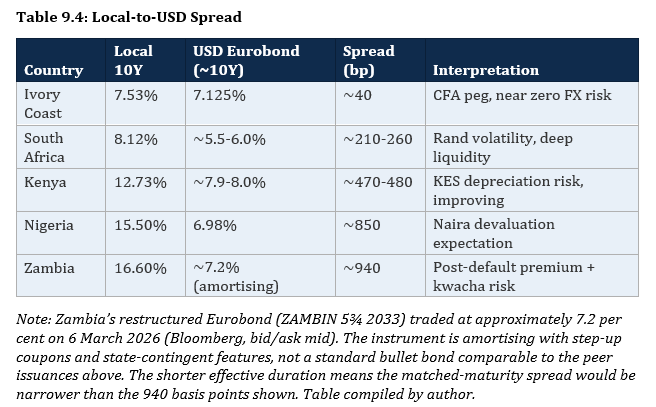
Zambia’s spread of approximately 940 basis points is the widest in the peer group. Kenya, one to two notches above at B/Caa1, carries 470 to 480 basis points. Nigeria, at B-/B3, carries approximately 850 basis points. The sensitivity to spread compression is arithmetic. As the rating migrates and the spread narrows, the implied local 10-year yield falls:
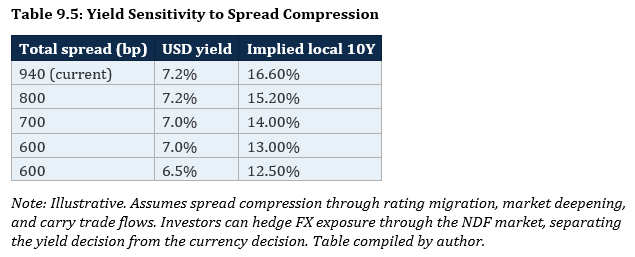
At a spread of 600 to 700 basis points, the 10-year converges toward 13 to 14 per cent. At 800 basis points, it settles near 15 per cent. The February auction cleared at 16.60 per cent: 200 to 350 basis points of compression room remains. The 15-year, at 17.59 per cent, retains 150 to 250 basis points against a peer-implied range of 15 to 16 per cent. The compression between January and February is the market beginning this repricing in real time.
What the comparison reveals
Zambia’s real yields are attractive and improving. The compression is rational: a sovereign that has restructured 94 per cent of its external debt and attracted positive outlooks from all three rating agencies should trade tighter. The continental context validates the trend. The bond market and the T-bill market are telling different stories: bonds oversubscribed 5 times on 13 February while T-bills undersubscribed at 84.6 per cent on 19 February. Kenya, which has cut 425 basis points across 10 consecutive meetings with T-bill auctions routinely above 200 per cent coverage, illustrates the difference. That difference is market depth: Kenya’s M3-to-GDP at approximately 40 to 45 per cent versus Zambia’s 29 per cent.
A central bank that cannot price the short end of its own domestic curve through the policy rate should be cautious about claiming credit for what happens at the long end through capital flows. The market will compress Zambia’s spread as the credit rating improves, as the disinflation proves durable, and as the kwacha holds. That compression belongs to the country’s trajectory. It does not belong to 75 basis points.
SECTION 10: Three Moves
The IMF called for projection transparency, fiscal data discipline, and operational framework reform across multiple reviews. Those recommendations remain unimplemented in material respects.
First, projection accountability. The Bank of Zambia should publish its forecast error record: every inflation projection since the adoption of the inflation targeting framework, placed against the outturn. The format exists in peer central banks. The BoZ should publish by the May 2026 MPC and update at every subsequent meeting. If the record shows systematic accuracy, the market should follow the rate signal. If it shows systematic over-optimism, the market is rational to price liquidity rather than the policy rate.
Second, fiscal transparency. The Ministry of Finance should publish revenue outturn data within three weeks of month-end, starting with the January 2026 indicators. The measurable threshold: monthly economic indicators available in the public domain by the 21st of the following month. This is operationally achievable: the data exists within the Treasury systems, and every IMF programme review demonstrates the Ministry can produce these figures when required. In a year with no external programme anchor and the heaviest domestic financing requirement in the country’s history, the market cannot price what it cannot see. Silence prices as a risk premium.
Third, proportionality discipline. Rate decisions should be calibrated to two conditions: confirmed transmission evidence in the domestic T-bill market and sustained within-band inflation across at least two to three consecutive readings. The specific test: post-MPC T-bill auctions should show yields moving in the direction of the change, with subscription rates at or above 100 per cent, within two auction cycles. The MPC should not increase the magnitude of easing beyond the previous move unless transmission evidence from that move has been observed. The November 25 basis point cut produced no such evidence. The February 75 basis point move was therefore disproportionate. This is not a call for permanent incrementalism. It is a principle that magnitude should escalate only when the preceding signal has been confirmed.
SECTION 11: What the Evidence Shows
The question this paper posed was whether the evidence available to the MPC on 9 to 10 February 2026 supported a 75 basis point reduction in the policy rate.
On the direction. Defensible. Inflation had declined materially. The kwacha had appreciated on a structural intervention this paper supported. The IMF projected continued disinflation. A rate cut in February 2026 was not irrational.
On the magnitude. Not supported by the evidence. The transmission record shows that neither the November nor the February cut moved domestic T-bill yields through policy transmission; across three post-decision auctions, the pattern has deepened. The measurement environment shows the CPI instrument flatters the disinflation trajectory by approximately 0.35 percentage points, accounting for roughly half of the 70 basis point forecast revision. The improved projection depends on the exchange rate, which the MPC statement did not condition upon.
On the alternative. A 25 basis point cut, matching the November magnitude, was the maximum the evidence supported. The bond compression would have occurred regardless: offshore capital drove 69 per cent of the allocation and was responding to carry trade arithmetic, not the difference between 25 and 75 basis points.
The corridor arithmetic shows the difference. At 14.0 per cent, the policy rate corridor runs 13.0 to 15.0 per cent. The 91-day trap is a liquidity problem under either scenario. The difference appears at the medium tenors. At 75 basis points, the 273-day yield (13.5 per cent) sits exactly at the policy rate: zero premium for nine months of locked capital. At 25 basis points, a 273-day yield around 13.8 per cent offers a meaningful spread above the 13.0 per cent corridor floor. The 364-day, at approximately 14.3 per cent, offers 30 basis points above the policy rate. The medium curve remains functional. At 75 basis points, even the 273-day offers no compensation for duration risk. The trap extends across the entire Treasury bill curve.
At 14.0 per cent, the May MPC would have had two to three months of confirmed within-band data and could have accelerated with evidence in hand. At 13.5 per cent, the corridor trap extends across the full T-bill curve, leaving the May MPC less room to act. The structural pressure to cut to release the trap exists at any rate level, but the 75 basis point magnitude narrowed the space within which the May MPC can respond to data rather than to the trap. The February decision did not preserve the May MPC’s room to act on evidence. It used it.
The front-loading constraint would have been identical under either scenario: it is a function of the NDF ceiling and the issuance profile, not the rate level. The exchange rate dependency would have been identical: the forecast rests on the kwacha regardless of the policy rate. What the 25 basis point alternative would have changed is the corridor arithmetic (preserving the medium tenors), the governance precedent, and the room available to the May MPC. Those are the consequences of the magnitude.
On the governance precedent. The February decision set a standard. A 75 basis point cut calibrated to a forecast rather than confirmed evidence, delivered into a transmission mechanism the IMF documented as actively hindering monetary policy, measured by an instrument whose weights have not been updated in 23 years, in an electoral year where structural benchmark compliance had fallen from 66 per cent to 42 per cent, and two weeks after the IMF counselled prudence. If that is the evidentiary standard for the largest rate move in years, the standard for the next decision is lower.
The structural pressure to cut to release the corridor trap exists regardless of the February decision. It is a product of the yield arithmetic created during the hiking cycle and the auction calendar’s cash dynamics. What the 75 basis point magnitude did is extend the trap across more tenors, flatten the yield curve from overnight to one year, and narrow the May MPC’s room to respond to data rather than to the corridor. The governance precedent removes the institutional basis for resisting that pressure. The first is a structural condition the paper documents. The second is a warning. Both matter.
On the purchasing power standard. After 81 months above the target band, with GDP growth projected at 5.8 per cent and no published evidence of a negative output gap, the economy was not in distress. The households who carried seven years of price level damage needed the rate to settle inside the band long enough for stabilisation to begin. The MPC cut at the moment of arrival, before recovery had begun, before the band had been held. Even a 25 basis point cut rested on a single reading near the band ceiling. A more prudent window was August 2026, after a full quarter of confirmed within-band data.
The February decision may not have been motivated by anything other than the MPC’s genuine assessment of the inflation outlook. The evidence assembled in this paper does not make a claim about motivation and cannot test it. What the evidence shows is that the decision was not proportionate to what the data supported, and that the institutional environment in which it was taken pointed toward caution on every dimension the paper has examined.
What would change this assessment. This paper’s finding is falsifiable. Three pieces of evidence would weaken or overturn it. First, if T-bill auctions show broad-based subscription above 100 per cent across all tenors (not concentrated in the 364-day) with yields moving in the direction of the cut, the transmission finding is wrong. The March 2026 auction crossed 100 per cent on the headline but the 182-day subscribed at 40 per cent; the pattern has not yet falsified the finding. Second, if the Ministry of Finance publishes revenue outturn showing FX-linked revenues held up despite the appreciation, the exchange rate dependency finding is weaker. The FY2025 outturn, published after this paper’s analysis was completed, provides a partial test: total revenue and grants reached K187.4 billion against a budget of K185.5 billion. Income taxes overperformed at 124.8 per cent of budget, driven by mining corporate tax. However, VAT collected K37.1 billion against a K48.7 billion target (76.2 per cent), with import VAT at 90.6 per cent and domestic VAT at 34.4 per cent. Mineral royalties collected K16.0 billion against K17.2 billion (93.0 per cent). The FX-linked lines underperformed as the paper’s Section 6 analysis predicts; copper profitability compensated through the income tax channel. The fiscal finding is partially confirmed, partially offset. Third, if ZamStats publishes rebased CPI data and the trajectory effect is negligible, the measurement finding loses force. The confidence levels are not uniform: the transmission failure is highest confidence (three auctions, consistent pattern). The CPI trajectory effect is moderate confidence (approximately 0.35 percentage points, directionally certain). The exchange rate dependency is structural and certain; only the fiscal magnitude is conditional on copper and the kwacha path. The governance precedent is an institutional judgement, not a quantitative finding. The lending channel remains fully disconnected: commercial bank average lending rates stood at 28.0 per cent in December 2025 (Ministry of Finance, Monthly Economic Indicators, December 2025), unchanged in substance from 29.0 per cent at the start of the hiking cycle.
The answer the data returns is that a 75 basis point cut into a broken transmission system, at the first monthly reading near the target band ceiling, calibrated to a projection dependent on an exchange rate the central bank influences but cannot guarantee, and measured by an instrument not updated in 23 years, was not proportionate to what the evidence supported at the time of the decision. The direction was defensible. The magnitude was not.
References
Bank of Zambia (2025). Monetary Policy Rate announcement, 18 November 2025. Lusaka.
Bank of Zambia (2026a). Monetary Policy Rate announcement, 11 February 2026. Lusaka.
Bank of Zambia (2026b). GRZ Bond Tender Results 01/2026/BA, January 2026. Lusaka.
Bank of Zambia (2026c). GRZ Bond Tender Results 02/2026/BA, 13 February 2026. Lusaka.
Bank of Zambia (2026d). Treasury Bill Tender Results 02/2026, 03/2026, 04/2026, 05/2026. Lusaka.
Bank of Zambia (2025). Governor’s Presentation to the Media: Monetary Policy Committee Statement for the Third Quarter of 2025, 12 November 2025. Lusaka.
Bank of Zambia (2026e). Governor’s Presentation to the Media: Monetary Policy Committee Statement for the Fourth Quarter of 2025, 11 February 2026. Lusaka.
Bank of Uganda (2026). Government Securities Auction Results, 18 February 2026. Kampala.
Central Statistical Office / ZamStats (2009). Consumer Price Index: Base Year and Methodology. Lusaka.
Central Statistical Office / ZamStats (2023). 2022 Living Conditions Monitoring Survey Report. Lusaka.
Central Statistical Office / ZamStats (2025). Monthly Bulletin, Vol. 193 (April 2019 reference data). Lusaka.
Central Statistical Office / ZamStats (2026a). The Monthly, Vol. 274, January 2026. Lusaka.
Central Statistical Office / ZamStats (2026b). The Monthly, Vol. 275, February 2026. Lusaka.
ECA, UNDP and APRM (2025). Joint Statement on Zambia Debt Restructuring, 6 December 2025.
ILO (2003). Resolution concerning consumer price indices. 17th International Conference of Labour Statisticians. Geneva.
IMF (2020). Consumer Price Index Manual: Concepts and Methods. Washington, DC.
IMF (2023). Zambia: First Review Under the Extended Credit Facility. Country Report No. 23/260. Washington, DC.
IMF (2023). Zambia: Second Review Under the Extended Credit Facility. Country Report No. 24/009. Washington, DC.
IMF (2024a). Zambia: Third Review Under the Extended Credit Facility. Country Report No. 24/171. Washington, DC.
IMF (2024b). Zambia: Fourth Review Under the Extended Credit Facility. Country Report No. 24/373. Washington, DC.
IMF (2025a). Zambia: Fifth Review Under the Extended Credit Facility. Country Report No. 25/194. Washington, DC.
IMF (2025b). Press Release No. 25/431, 18 December 2025. Washington, DC.
IMF (2026a). Zambia: Sixth Review Under the Extended Credit Facility. Country Report No. 2026/021. Washington, DC.
IMF (2026b). Press Release No. 26/024, 27 January 2026. Washington, DC.
Ministry of Finance, Zambia (2025). 2026 National Budget Address, delivered to the National Assembly, 26 September 2025. Lusaka.
Ministry of Finance, Zambia (2025). 2026 National Budget. Lusaka.
Ministry of Finance, Zambia (2025). Quarterly Debt Service Schedule, Q3 2025. Lusaka.
Ministry of Finance, Zambia (2025). Quarterly Debt Statistical Bulletin, Q4 2025. Lusaka.
Ministry of Finance, Zambia (2026). Monthly Economic Indicators Report, December 2025. Lusaka.
Bank of Zambia (2025). Quarterly Debt Statistical Bulletin, Q4 2025. Lusaka.
Bank of Zambia (2026f). Commercial Bank Liquidity Data, July 2023 to February 2026. Lusaka.
Bank of Zambia (2026g). Treasury Bills and GRZ Bonds Rates, July 2023 to February 2026. Lusaka.
Bank of Zambia (2026h). Interest Rate Data (Policy Rate, Lending Rates, Interbank Rates), July 2023 to February 2026. Lusaka.
Nigeria Debt Management Office (2026). Eurobond Closing Prices, 26 February 2026. Abuja.
Bloomberg (2026). ZAMBIN 5¾ 06/30/2033 REGS Corp, bid/ask prices, 6 March 2026.
Onyambu, D. N. (2025). ‘Structure Before Sentiment, Part 1: Zambia’s Monetary Policy Transmission Failure.’ Canary Compass, November 2025.
Onyambu, D. N. (2025). ‘Structure Before Sentiment, Part 3: Foundations for Transmission.’ Canary Compass, December 2025.
Onyambu, D. N. (2025). ‘Structure Before Sentiment, Part 4: The World Will Not Wait.’ Canary Compass, December 2025.
Onyambu, D. N. (2026a). ‘Copper Output and the 2026 Royalty Arithmetic.’ Canary Compass, January 2026.
Onyambu, D. N. (2026b). ‘Zambia 2026 Domestic Market Absorption.’ Canary Compass, February 2026.
S&P Global Ratings (2026). African Sovereign Ratings Summary, February 2026.
Sy, A. and Laws, A. (2026). ‘The New Face of African Debt.’ Finance and Development, March 2026. Washington, DC: International Monetary Fund.
Zambia Statistics Agency (2023). 2022 Census of Population and Housing: National Analytical Report. Lusaka.
Disclaimer
This article does not constitute legal, financial, or investment advice. The author shares views for perspective and discussion only. Do not rely on them as a substitute for professional advice tailored to your specific circumstances. Always consult a qualified legal, financial, investment, or other professional adviser before making decisions based on this content. The analysis reflects proprietary research undertaken by Canary Compass and the author.
Canary Compass and the author accept no liability for actions taken or not taken based on the information in this article.
The views expressed in this article represent the author’s independent professional analysis and do not constitute an endorsement of any individual, institution, or position. Canary Compass and the author accept no responsibility for how this content is interpreted, excerpted, or recontextualised by third parties not involved in its production and publication. Reproducing any portion of this work in isolation, or in combination with other material, in a manner that misrepresents the author’s original meaning constitutes a distortion of the published record.
The author may hold positions in financial instruments, currencies, or assets discussed or referenced in this publication. Such positions do not constitute a recommendation to buy or sell.
All views, projections, and forecasts reflect the author’s assessment at the time of writing. Data sourced from third parties is believed to be reliable but has not been independently verified. Past performance does not indicate future results.
All content published by Canary Compass is the intellectual property of the author. Reproduction, adaptation, or redistribution, in whole or in part, requires written permission.
About the Author
Dean N. Onyambu is the Founder and Chief Editor of Canary Compass, a financial research publication focused on African monetary architecture and financial sovereignty. He brings 18 years of experience across trading, fund leadership, and economic policy, with senior roles at Standard Bank, First Capital Bank, and Opportunik Global Fund.
Read and subscribe at www.canarycompass.com.
The Canary Compass Channel is available on @CanaryCompassWhatsApp for economic and financial market updates on the go.
Canary Compass is also available on Facebook: @CanaryCompassFacebook.
For more insights from Dean, you can follow him on LinkedIn @DeanNOnyambu, X @InfinitelyDean, or Facebook @DeanNathanielOnyambu