
Zambia 2026 Domestic Market Absorption: The Arithmetic Through End-January
Separating refinancing from deficit funding, accounting for within-year churn, and assessing what remains

Source: Bank of Zambia
1. Framework: How to Calculate Gross Domestic Market Absorption
When people ask how much government needs to raise from the domestic market in a given year, they often mix up refinancing with deficit funding. The clean approach separates the two, then recombines them into a single cash absorption number.
Start with the cash that must be paid to investors on existing domestic securities. Zambia’s Ministry of Finance breaks redemptions into maturities at cost and discounts for discounted instruments. Maturities at cost reflect the principal the government received when it sold the security. The discount is the implicit interest: the difference between cost and face value. At maturity, the government pays face value, which equals maturities at cost plus discount. For bonds, coupon payments represent explicit interest.
The funding sources differ. Maturities at cost must be refinanced through market issuance. Discount and coupon payments are interest expense, funded from revenues under standard fiscal practice. Under this practice, interest expense is funded from revenues rather than new borrowing. The 2026 budget allocates ZMW52bn from the revenue envelope to service domestic debt interest, consistent with this principle.
Net new borrowing from the domestic market represents the additional cash government plans to raise to fund the fiscal deficit, over and above refinancing existing obligations.
Gross domestic market cash absorption therefore equals debt service cash plus net domestic financing. This is the minimum cash the domestic market must absorb based on the starting position and the budget.
This baseline is not fixed. Treasury bills complicate things because they are issued and mature within the year and are issued at discount. As more 3-month, 6-month, and 9-month bills are auctioned during the year, additional maturities and discount redemptions are created within the year. Gross cash churn increases even if net borrowing does not change. Realised market absorption can therefore exceed the initial estimate. It can also fall short if government overperforms on external financing, revenue collection, or expenditure control.
2. Building the 2026 Baseline
The baseline comprises debt service on existing securities and budgeted net domestic financing.
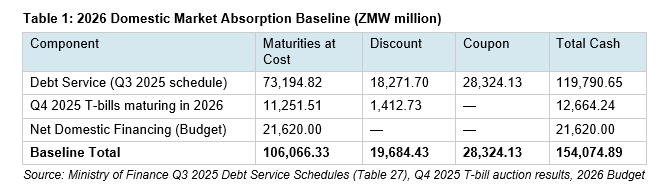
Maturities at cost as at end-December 2025 totalled ZMW84.45bn. Targeted new domestic financing for 2026 is ZMW21.62bn. Interest expense (discount plus coupon) totalled ZMW48.01bn. Total gross domestic financing required is therefore ZMW154.07bn.
These are raised from different sources. The ZMW106bn (maturities at cost and net domestic financing) comes from security issuances through auctions. The ZMW48bn comes from revenues. This ties directly into the ZMW52bn budgeted for domestic debt interest. The additional ZMW4bn provides a buffer for within-year Treasury bill discount costs created by 2026 issuance.
The Q4 2025 Treasury bills maturing in 2026 added ZMW11.25bn to maturities at cost and ZMW1.41bn in discount:

The targeted market issuance in 2026 is ZMW106.07bn. The ZMW48bn is funded from revenues. Within-year discounts are covered by the additional ZMW4bn budgeted above the baseline interest expense.
3. Within-Year Churn Mechanics
Treasury bills with tenors of 3 months, 6 months, and 9 months issued during 2026 create maturities that also fall within 2026. This within-year churn increases gross cash absorption even if net borrowing does not change.
Treasury bills are discount instruments. When an auction raises ZMW3bn at face value, the amount raised at cost is lower because of the discount. If ZMW1.5bn of that face value is allocated to short-tenor bills maturing within the year, that ZMW1.5bn creates new maturities that must be added back to the baseline. The net cash contribution equals gross cash raised at cost minus within-year maturities at face value.
4. January 2026 Auction Performance
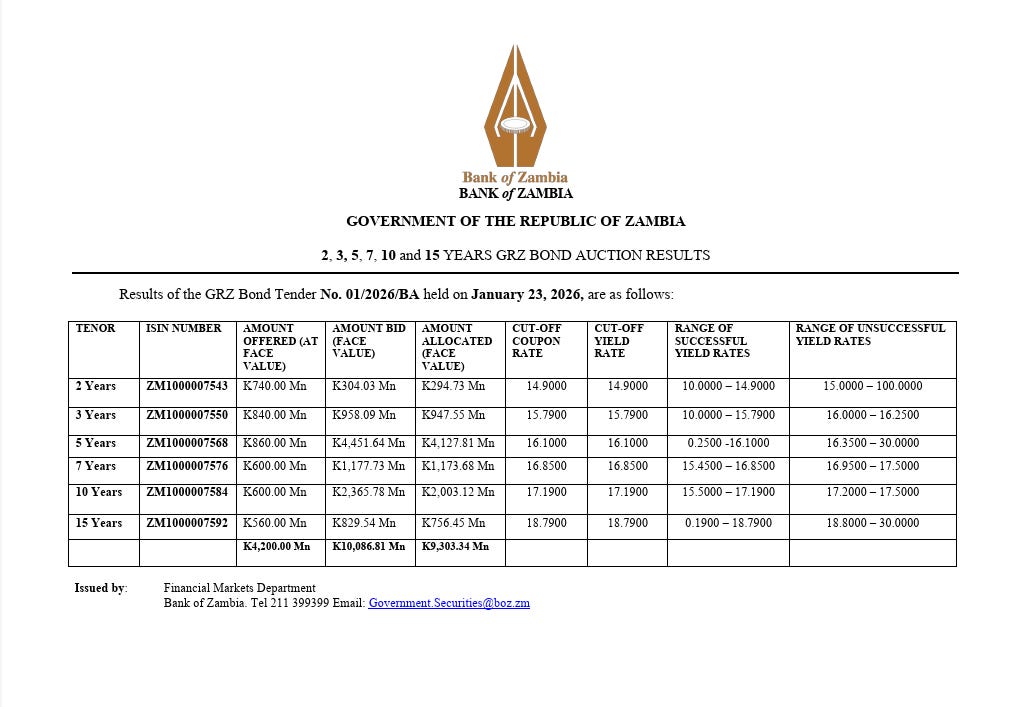
January 2026 saw three primary market auctions: two Treasury bill auctions and one government bond auction. Demand was strong across all tenors.
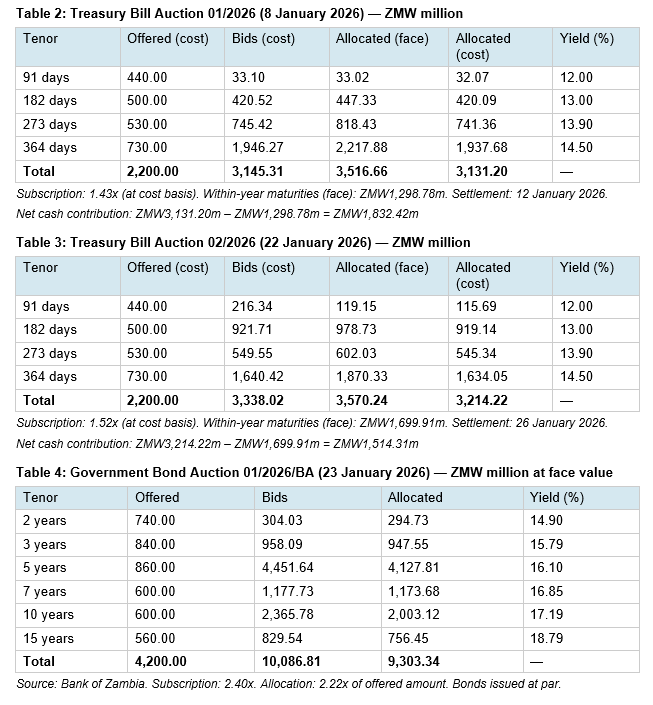
The bond auction demonstrated exceptional demand. Bids totalled ZMW10.09bn against an offer of ZMW4.20bn. Treasury allocated ZMW9.30bn, absorbing available liquidity.
5. January Liquidity and Maturities
The strong subscription ratios require context. January saw concentrated maturities that released cash back to investors.
Banks’ aggregate current account balance stood at ZMW7.30bn at end-December 2025. Between end-December and 9 January, only ZMW606m in securities matured. By 9 January, after these initial maturities and fiscal disbursements, the balance rose to ZMW11.73bn. The first Treasury bill auction on 8 January settled on 12 January, absorbing ZMW3.13bn. By the bond auction on 23 January, balances had fallen to ZMW3.99bn. The first T-bill settlement explains part of this decline. The remainder reflects open market operations and possible central bank foreign exchange sales.
January maturities total ZMW11.64bn: ZMW6.80bn in bonds and ZMW4.85bn in Treasury bills. Of this, ZMW3.93bn had already been paid out (matured) by mid-month. The remaining ZMW7.71bn pays out on Monday 26 January, when both T-bills (ZMW 3.21bn) and bonds (ZMW9.30bn) settle.
The bond auction raised ZMW9.30bn against bond maturities of ZMW6.80bn. Net new money for bonds was ZMW2.51bn. This was a strong result. The composition of offshore versus domestic bids will be informative once available.
6. End-January Position
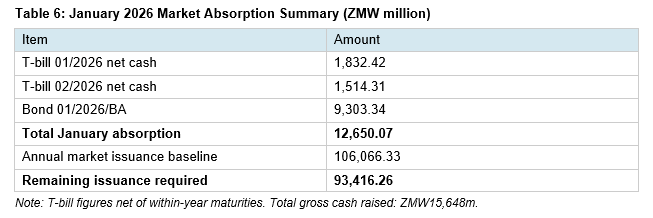
January absorbed ZMW12.65bn against a ZMW106.07bn full-year issuance requirement, or 11.9 per cent. Approximately ZMW93.42bn remains for the next eleven months, averaging ZMW8.49bn per month.
The issuance calendar runs 26 Treasury bill auctions and 12 bond auctions annually. Q1 2026 advertised amounts are ZMW2.20bn per Treasury bill auction and ZMW4.20bn per bond auction. If these hold for the full year, total offered amounts would reach ZMW107.60bn, implying an average required allocation of 98.6 per cent.
After January, 24 Treasury bill auctions and 11 bond auctions remain, offering approximately ZMW99.0bn. The required average allocation has fallen to 94.4 per cent. Government raised ZMW12.65bn against ZMW8.60bn offered. This is front-loading.
Raising ZMW4.0bn above the offered amount signals Treasury’s intent to secure financing while conditions remain favourable.
According to the maturity profile on the Reuters dealing platform, January had concentrated bond maturities of ZMW6.80bn. Net new money for bonds was ZMW2.51bn. February has minimal bond maturities. March has none. The next significant bond maturities fall in June and December 2026. The question is whether February and March bond auctions, without comparable maturing cash to recycle, will generate similar demand. If the pace of net new money cannot be maintained in months with lighter maturities, switch auctions scheduled for Q2 may still be necessary to manage the refinancing profile.
The refinancing wall remains. At the start of the year, non-resident cash outflows in 2026 totalled ZMW23.52bn, or USD1.18bn at an exchange rate of 20. Even if offshore investors took half the January bond auction, around USD230m, the remaining refinancing requirement would stand at approximately USD947m.
7. The IMF Anchor Question
The Extended Credit Facility concluded at end-January 2026 following the sixth and final review. The Ministry of Finance confirmed its intention to engage the IMF on a successor programme but provided no timeline or structure.
An IMF programme imposes quantitative performance criteria that cannot be unilaterally revised. Deviations require formal engagement, waivers, and disclosure. Domestic budget ceilings can be amended via supplementary appropriations. These are different constraint mechanisms, and markets price them accordingly.
Elections are scheduled for August 2026. In many countries, negotiating and securing Board approval for a new IMF arrangement is harder close to elections because policy commitments become politically constrained. Zambia can still engage at staff level, but a successor programme is more likely after the election unless conditions deteriorate materially.
The government has not provided numeric anchors in the absence of an external programme. The market must rely on monthly macroeconomic indicators to gauge revenue and expenditure performance. These are issued with a lag. The January auction was strong. Whether market sentiment sustains will depend on subsequent auction performance and the monthly fiscal data releases that follow.
8. Non-Resident Context
In January 2026, the Bank of Zambia raised the non-resident ownership cap on government securities from 5 per cent to 23 per cent. The reasoning is straightforward.
The refinancing wall in 2026 has large offshore holdings. A 5 per cent cap is unrealistic given what is maturing for non-residents. The adjustment to 23 per cent creates latitude to accept bids if offshore investors choose to roll over.
Whether they roll over is not a function of the cap. If yields are attractive, they will bid regardless of whether the cap is 5 per cent or 50 per cent. If yields are not attractive, they will exit regardless of whether the cap is 50 per cent or 90 per cent. The cap merely removes a mechanical bottleneck. It does not create demand. It accommodates demand that either exists or does not exist based on yield attractiveness.
The mathematics confirm this. The amount to be raised from the market is ZMW106.07bn. Offshore cash outflows total ZMW23.52bn. The ratio is 22.17 per cent. Government is hoping to roll over 100 per cent of the cash going to non-residents. That is why the cap moved to 23 per cent.
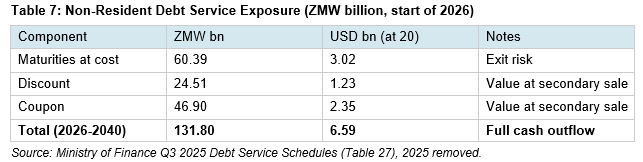
If non-residents exit before maturity, they transfer future coupons and discount accrual to the buyer and realise a price that reflects prevailing yields and liquidity. The cash flow at maturity is only certain if they hold to maturity. The practical risk is not forfeiture; it is whether the market can absorb large sales without a significant yield concession. For 2026 specifically, non-resident cash outflow comprises ZMW10.65bn maturities at cost, ZMW4.61bn discount, and ZMW8.26bn coupon, totalling ZMW23.52bn or USD1.18bn. If non-residents reinvest or new offshore investment materialises, potential foreign exchange demand reduces.
Offshore did not hold Treasury bills at end-September 2025. We assume this remains the case for 2026 projections.
9. Revenue-Side Vulnerability
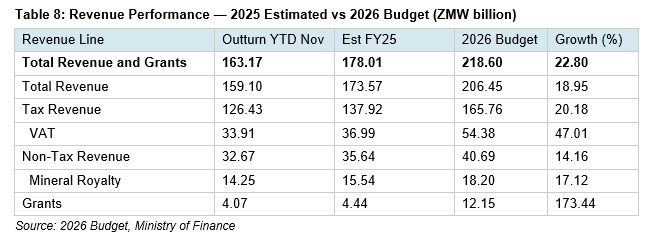
The ZMW106bn issuance requirement assumes revenues cover ZMW48bn in interest expense. The 2026 budget targets ZMW206.45bn in total revenue, a 22.8 per cent increase over the estimated 2025 outturn of ZMW178.01bn.
The ZMW48bn interest expense represents 23 per cent of budgeted domestic revenues, a ratio that leaves limited margin for slippage. The IMF’s fiscal sustainability framework typically flags interest-to-revenue ratios above 20 per cent as warranting close monitoring. Zambia sits just above this threshold before any revenue underperformance is considered.
Three lines carry concentration risk.
VAT. The budget assumes VAT rises from ZMW37.0bn to ZMW54.4bn, a 47 per cent increase. This requires either a consumption boom or substantial collection efficiency gains. The assumption is aggressive.
Mineral royalties. The budget projects royalties rising from ZMW15.5bn to ZMW18.2bn, about a 17% increase. Royalties remain sensitive to copper prices and exchange rates. The 2025 average exchange rate settled around 25.2 kwacha per dollar. The current rate sits near 20, a 20% appreciation. The 2025 average copper price came in at approximately USD9,947 per tonne. Current three-month LME copper trades around USD13,115, with 2026 forecasts ranging from USD11,000 to USD13,000. JPMorgan projects an average of USD11,000 per tonne for 2026. If the upper band of USD13,000 materialises as the annual average, that represents roughly 31% higher dollar-denominated prices than the 2025 average, which can largely offset the currency appreciation. On those two variables alone, however, the implied kwacha value per tonne rises only modestly. The 17% royalty uplift still leans on higher volumes, improved compliance, or both.
If the kwacha strengthens further toward 19, royalty collections compress even with higher copper. Using the same proportional logic: at an exchange rate of 20 and copper averaging USD13,000, production would need to rise by roughly 13% to deliver the budgeted 17% royalty increase. If the exchange rate strengthens toward 19, the implied production requirement rises to approximately 19%, unless royalty rates or enforcement also improve. Zambia’s copper production in H1 2025 reached 439,644 tonnes, up from 373,263 tonnes in H1 2024. Full-year 2024 production rose 12% year on year, supported by recoveries at key mines. The finance ministry projects output above one million tonnes in 2026. The practical question for 2026 revenue is not whether the ambition exists, but whether realised production growth lands nearer the mid-single digits or the low teens. That difference determines how much exchange rate strength the fiscal can tolerate before royalties undershoot the budget.
Working backwards from the 17% royalty target: at USD13,000 copper and 10% production growth, the kwacha would need to average around 20.5 to meet budget. At 12% growth, an average of 20.2 suffices. At 15% growth, the fiscal can tolerate the rate strengthening to 19.6. The current spot rate of 19.50 sits right at the threshold. If copper instead averages closer to JPMorgan’s USD11,000 projection, the arithmetic shifts materially. At 10% production growth, the kwacha would need to average around 24.2. At 15% growth, approximately 23.2. The budget’s royalty line prices in either high copper or a weaker kwacha or exceptional production growth. It does not price in all three variables moving against it simultaneously. The Ministry of Finance and Bank of Zambia may not want the currency much stronger than USD/ZMW 19 for revenue reasons.
Grants. The budget assumes grants rise from ZMW4.4bn to ZMW12.2bn, a 173 per cent increase. The source of this increase is not obvious. Zambia’s geopolitical positioning complicates the assumption. In October 2025, Chinese mining companies began paying royalties and taxes in yuan, making Zambia the first African country to accept renminbi for mining taxation. New SCO investment platforms have launched in Guangzhou targeting Zambian opportunities. The IMF programme expired in January 2026 with no successor arrangement. At the same time, Zambia anchors the Lobito Corridor, the US-backed infrastructure play into Central Africa’s copper belt. KoBold Metals, First Quantum, and US DFC activity represent continued Western positioning. If strategic ambiguity is giving way to something directional, grant flows from Western sources may tighten.
Sensitivity to Fiscal Slippage
The ZMW93.42bn remaining issuance requirement assumes the budget holds. That assumption warrants stress testing. The Bank of Zambia’s November 2025 MPC projects 2026 inflation at 7.6 per cent and real GDP growth around 6 per cent. This implies nominal GDP growth of approximately 13–14 per cent. Budget targets exceeding this range require either genuine overperformance or higher nominal growth, which would likely mean inflation above the 7.6 per cent forecast. If inflation rises, the Bank of Zambia may be forced to act, but the dominant inflation channel in Zambia operates through fiscal transmission. This is the dilemma the Structure Before Sentiment series identified.
Domestic revenue is budgeted to grow 19 per cent, well above the 13–14 per cent nominal growth baseline. VAT illustrates the execution risk. The 2025 budget targeted ZMW48.3bn in VAT. By November 2025, year-to-date collection stood at ZMW33.9bn, an annualised outturn of approximately ZMW37.0bn, representing a collection rate of 77 per cent against target. The 2026 budget now targets ZMW54.4bn, which is 12 per cent higher than the 2025 target that was missed. If 2026 VAT collection efficiency matches 2025 performance, actual receipts would be approximately ZMW41.7bn, a shortfall of ZMW12.7bn against budget.
Similar logic applies to grants (173 per cent increase assumed) and external financing (844 per cent increase assumed). If grants materialise at 50 per cent of target, the shortfall is ZMW6.1bn. If external financing disburses at 50 per cent, the shortfall is ZMW6.4bn. Under combined stress, VAT at 2025 collection efficiency, grants at 50 per cent, and external financing at 50 per cent, the outstanding domestic issuance requirement rises by approximately ZMW25bn, from ZMW93.4bn to approximately ZMW118bn.
Under combined stress, the required average monthly allocation would rise from ZMW8.49bn to approximately ZMW10.7bn. The required allocation rate would exceed 100 per cent of currently offered amounts. The probability of all three stress factors materialising simultaneously is low. The probability of at least one materialising in an election year is considerably higher.
Competing Fiscal Pressure: Supplier Arrears
A parallel fiscal constraint bears mention. As at August 2025, outstanding payments to suppliers of goods and services stood at ZMW84.1bn. The 2026 budget allocates just ZMW4.66bn toward dismantling these arrears, a coverage ratio of 5.5 per cent. At this pace, full clearance would require eighteen years.
With general elections scheduled for August 2026, political pressure to accelerate arrears clearance will intensify. Suppliers vote. Suppliers employ people who vote. Any reallocation from the domestic debt service envelope toward arrears clearance would tighten the fiscal constraint on the refinancing requirement. The arithmetic does not offer the luxury of addressing both simultaneously at current budget allocations.
This creates a fiscal pincer: the government must service ZMW84.1bn in supplier arrears while managing ZMW106bn in domestic debt maturities, with a revenue envelope that leaves minimal buffer for either.
10. Financing Assumptions
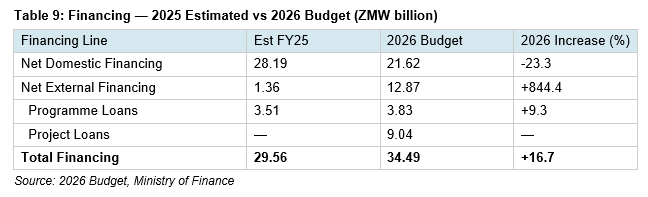
Programme loans. The budget assumes ZMW3.83bn in programme loans. The final ECF review disburses SDR138.9 million, approximately USD190 million, at an exchange rate of 20. This implies the budgeted rate was around USD/ZMW 20. The programme loan assumption is consistent with IMF mechanics.
Project loans. The budget assumes ZMW9.04bn in project loans, approximately USD450m at an exchange rate of 20. The specific projects and disbursement timelines remain unclear. If project disbursements slip, this creates a financing gap that must be covered from domestic issuance.
In 2025, net external financing was approximately ZMW1.4bn. The 2026 budget assumes ZMW12.9bn, an 844 per cent increase. If external financing underperforms, the ZMW93.42bn remaining issuance requirement could rise back toward the full ZMW106bn baseline or beyond.
11. The Inflation and Monetary Policy Constraint
December 2025 inflation was 11.2 per cent, up from 10.9 per cent in November. This is the first uptick after a sustained decline from the March 2025 peak of 16.8 per cent. The Structure Before Sentiment series warned that easing into an inflation overshoot carries real risk.
The Q4 and Q1 period typically sees stronger monthly inflation prints due to seasonal factors. Exchange rate appreciation will provide some relief through the pass-through channel, but the fiscal channel remains the dominant driver of inflation in Zambia. Government borrowing competes with private credit for the same pool of bank liquidity. Banks hold government securities equivalent to 51 per cent of their local currency deposits. Genuine kwacha-originated private credit stands at 7.4 per cent of GDP (author’s calculations from Bank of Zambia data; methodology detailed in the Structure Before Sentiment series).
The statutory reserve ratio currently stands at 26 per cent. The Bank of Zambia cut the monetary policy rate by 25 basis points to 14.25 per cent in November 2025, the first cut since August 2020.
If inflation edges up again, the Bank of Zambia faces a dilemma. To contain inflation transmitted through the fiscal channel, the central bank may need to raise the statutory reserve ratio. But tightening the SRR squeezes bank liquidity exactly when government needs banks to finance the remaining ZMW93.42bn in issuance. Raising the policy rate may help with signalling, but the binding constraint operates through the reserve ratio.
The Bank of Zambia may be approaching a policy crossroads. This is what the Structure Before Sentiment series warned about. Heading into an election window with no IMF fiscal anchor and inflation showing signs of turning, the room for error is narrow. The cost always comes somewhere.
12. The Kwacha Technical View
The kwacha’s performance is central to both the revenue outlook and non-resident refinancing dynamics.
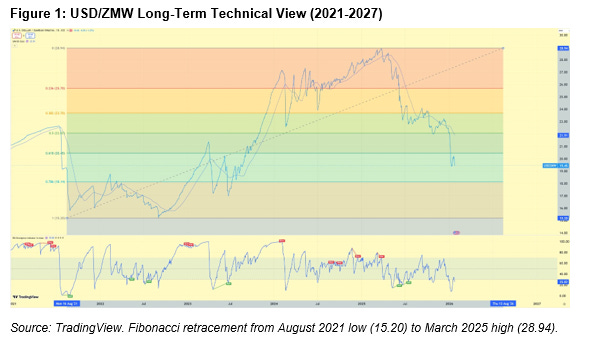
The USD/ZMW exchange rate has retraced the entire 2023-2024 kwacha depreciation cycle. From the August 2021 low of 15.20 to the March 2025 peak of 28.94, the kwacha depreciated by 90 per cent. Since then, it has appreciated from 28.94 to approximately 19.45, recovering a significant portion of that depreciation. The currency pair trades just below the 61.8 per cent Fibonacci retracement level at 20.45, with the next support at the 78.6 per cent level around 18.14.
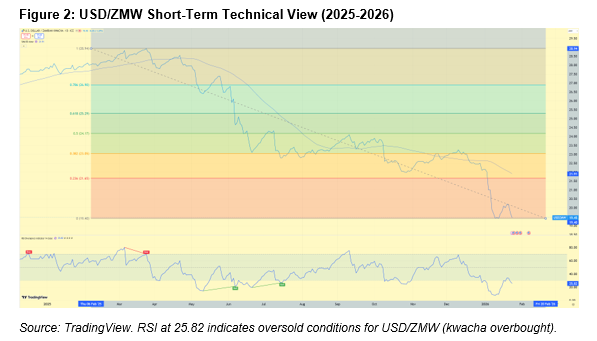
The daily RSI divergence indicator sits at 25.82, deep in oversold territory for USD/ZMW. This suggests kwacha strength may be overextended. The 50-day simple moving average at 21.91 sits well above the current price.
The fiscal implication is clear. A stronger kwacha compresses kwacha-denominated mineral royalties even if copper prices rise. At an exchange rate of 20 and copper averaging USD13,000, production growth of roughly 12 to 13% can compensate. If the rate strengthens toward 19, the required production growth rises closer to 19%. At current spot levels around 20, the fiscal sits right at the threshold. The Bank of Zambia may begin accumulating dollars around these levels, both to build reserves and to protect the revenue base.
For non-resident investors, the implications cut both ways. Those who have captured significant currency gains may find rolling over less attractive. Those who believe further appreciation is possible may view current levels as an entry point. The January, February, and March bond auctions, alongside updated participation data, will clarify offshore positioning.
13. Assessment
ZMW93.42bn in issuance remains after January. ZMW48bn in interest must come from revenues. The questions are under what conditions, at what yields, and with what fiscal discipline.
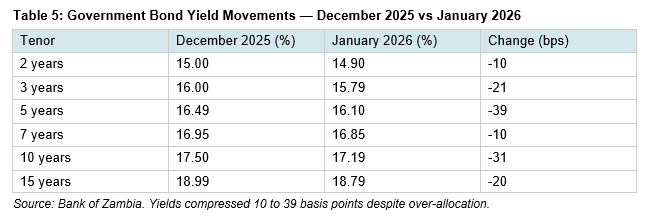
First, yield trajectory. Yields compressed 10 to 39 basis points in January despite over-allocation. Whether this stability can be maintained as supply continues is uncertain.
Second, demand composition. January auctions had strong subscription driven by maturing cash recycling. Net new money for bonds was ZMW2.51bn. January had concentrated bond maturities of ZMW6.80bn. February and March do not. The breakdown between domestic and offshore participation will be informative.
Third, fiscal discipline. No IMF anchor is locked. Elections are in August. Whether Treasury can hold net issuance at ZMW93.42bn or slippage pushes it back toward ZMW106bn or beyond depends on revenue performance, external financing realisation, and expenditure control.
Fourth, inflation trajectory. December inflation rose to 11.2 per cent from 10.9 per cent in November after months of decline. The seasonal pattern and fiscal channel suggest upside risk. If inflation edges up again, the Bank of Zambia may be called to tighten exactly when government needs financing.
Fifth, currency trajectory. The kwacha at 19.45 has retraced most of the 2023-2024 depreciation. RSI divergence suggests the move may be overextended. Further strength compresses mineral royalties and complicates offshore rollover decisions.
Front-loading in January demonstrates Treasury’s assessment that conditions may deteriorate later in the year. This is rational behaviour. It confirms the refinancing wall is a binding constraint. The arithmetic is clear. The replication challenge is real. The governance questions posed in The 2026 Refinancing Wall policy note remain unanswered until data releases guide our perception of changes or stability in the numeric anchors necessary to avoid slippage.
14. Conclusion
January was a strong start. Treasury front-loaded ZMW12.65bn against a requirement of ZMW106.07bn, leaving ZMW93.42bn for the remaining eleven months. Yields compressed. Demand exceeded supply. The required average allocation has fallen from 98.6 per cent to 94.4 per cent.
One month does not make a year. January had ZMW6.80bn in bond maturities providing recycling demand. February and March do not. Net new money for bonds was ZMW2.51bn. If this pace cannot be maintained without concentrated maturities, the front-loading merely shifts pressure rather than removing it.
The refinancing wall remains the binding constraint. Non-resident cash outflows of USD1.18bn must either roll over or exit. The cap adjustment to 23 per cent creates room to accept bids. It does not create the bids.
The revenue assumptions are aggressive. VAT at 47 per cent growth. Grants at 173 per cent growth. External financing at 844 per cent growth. If any of these underperform, the remaining issuance requirement rises.
The inflation uptick in December, after months of decline, signals that the fiscal channel remains active. If the Bank of Zambia is forced to tighten to contain inflation, it squeezes the same liquidity government needs to finance.
The absence of an IMF anchor means no external monitoring until a successor programme is negotiated, likely after the August elections. The market must assess fiscal credibility from monthly data releases issued with a lag.
January demonstrated that the domestic market can absorb significant issuance under favourable conditions. The question is whether those conditions persist. Reserves are adequate. Inflation is elevated but not spiralling. Copper prices are supportive. The currency is strong. Elections are seven months away.
The arithmetic is clear. The execution risk is real. The governance gap remains open.
Note on the Structure Before Sentiment Series
The Structure Before Sentiment series examines the institutional mechanics of Zambian monetary policy transmission. Previous instalments have addressed statutory reserve requirements, the credit formation blockage, and the fiscal-monetary policy interface. The series is available on Canary Compass and provides the analytical foundation for several claims in this article regarding banking sector liquidity allocation, private credit dynamics, and the fiscal transmission of inflation.
Disclaimer
This article does not constitute legal, financial, or investment advice. The author shares views for perspective and discussion only. Do not rely on them as a substitute for professional advice tailored to your specific circumstances. Always consult a qualified legal, financial, investment, or other professional adviser before making decisions based on this content. The analysis reflects proprietary research undertaken by Canary Compass and the author.
Canary Compass and the author accept no liability for actions taken or not taken based on the information in this article.
About the Author
Dean N. Onyambu is the Founder and Chief Editor of Canary Compass. His insights draw on experience across trading, fund leadership, governance, and economic policy.
The Canary Compass Channel is available on @CanaryCompassWhatsApp for economic and financial market updates on the go.
Canary Compass is also available on Facebook: @CanaryCompassFacebook.
For more insights from Dean, you can follow him on LinkedIn @DeanNOnyambu, X @InfinitelyDean, or Facebook @DeanNathanielOnyambu