
Zambia: Copper Output and the 2026 Royalty Arithmetic
A constraint mapping framework under Bear, Base, Bull, and Super Bull copper regimes

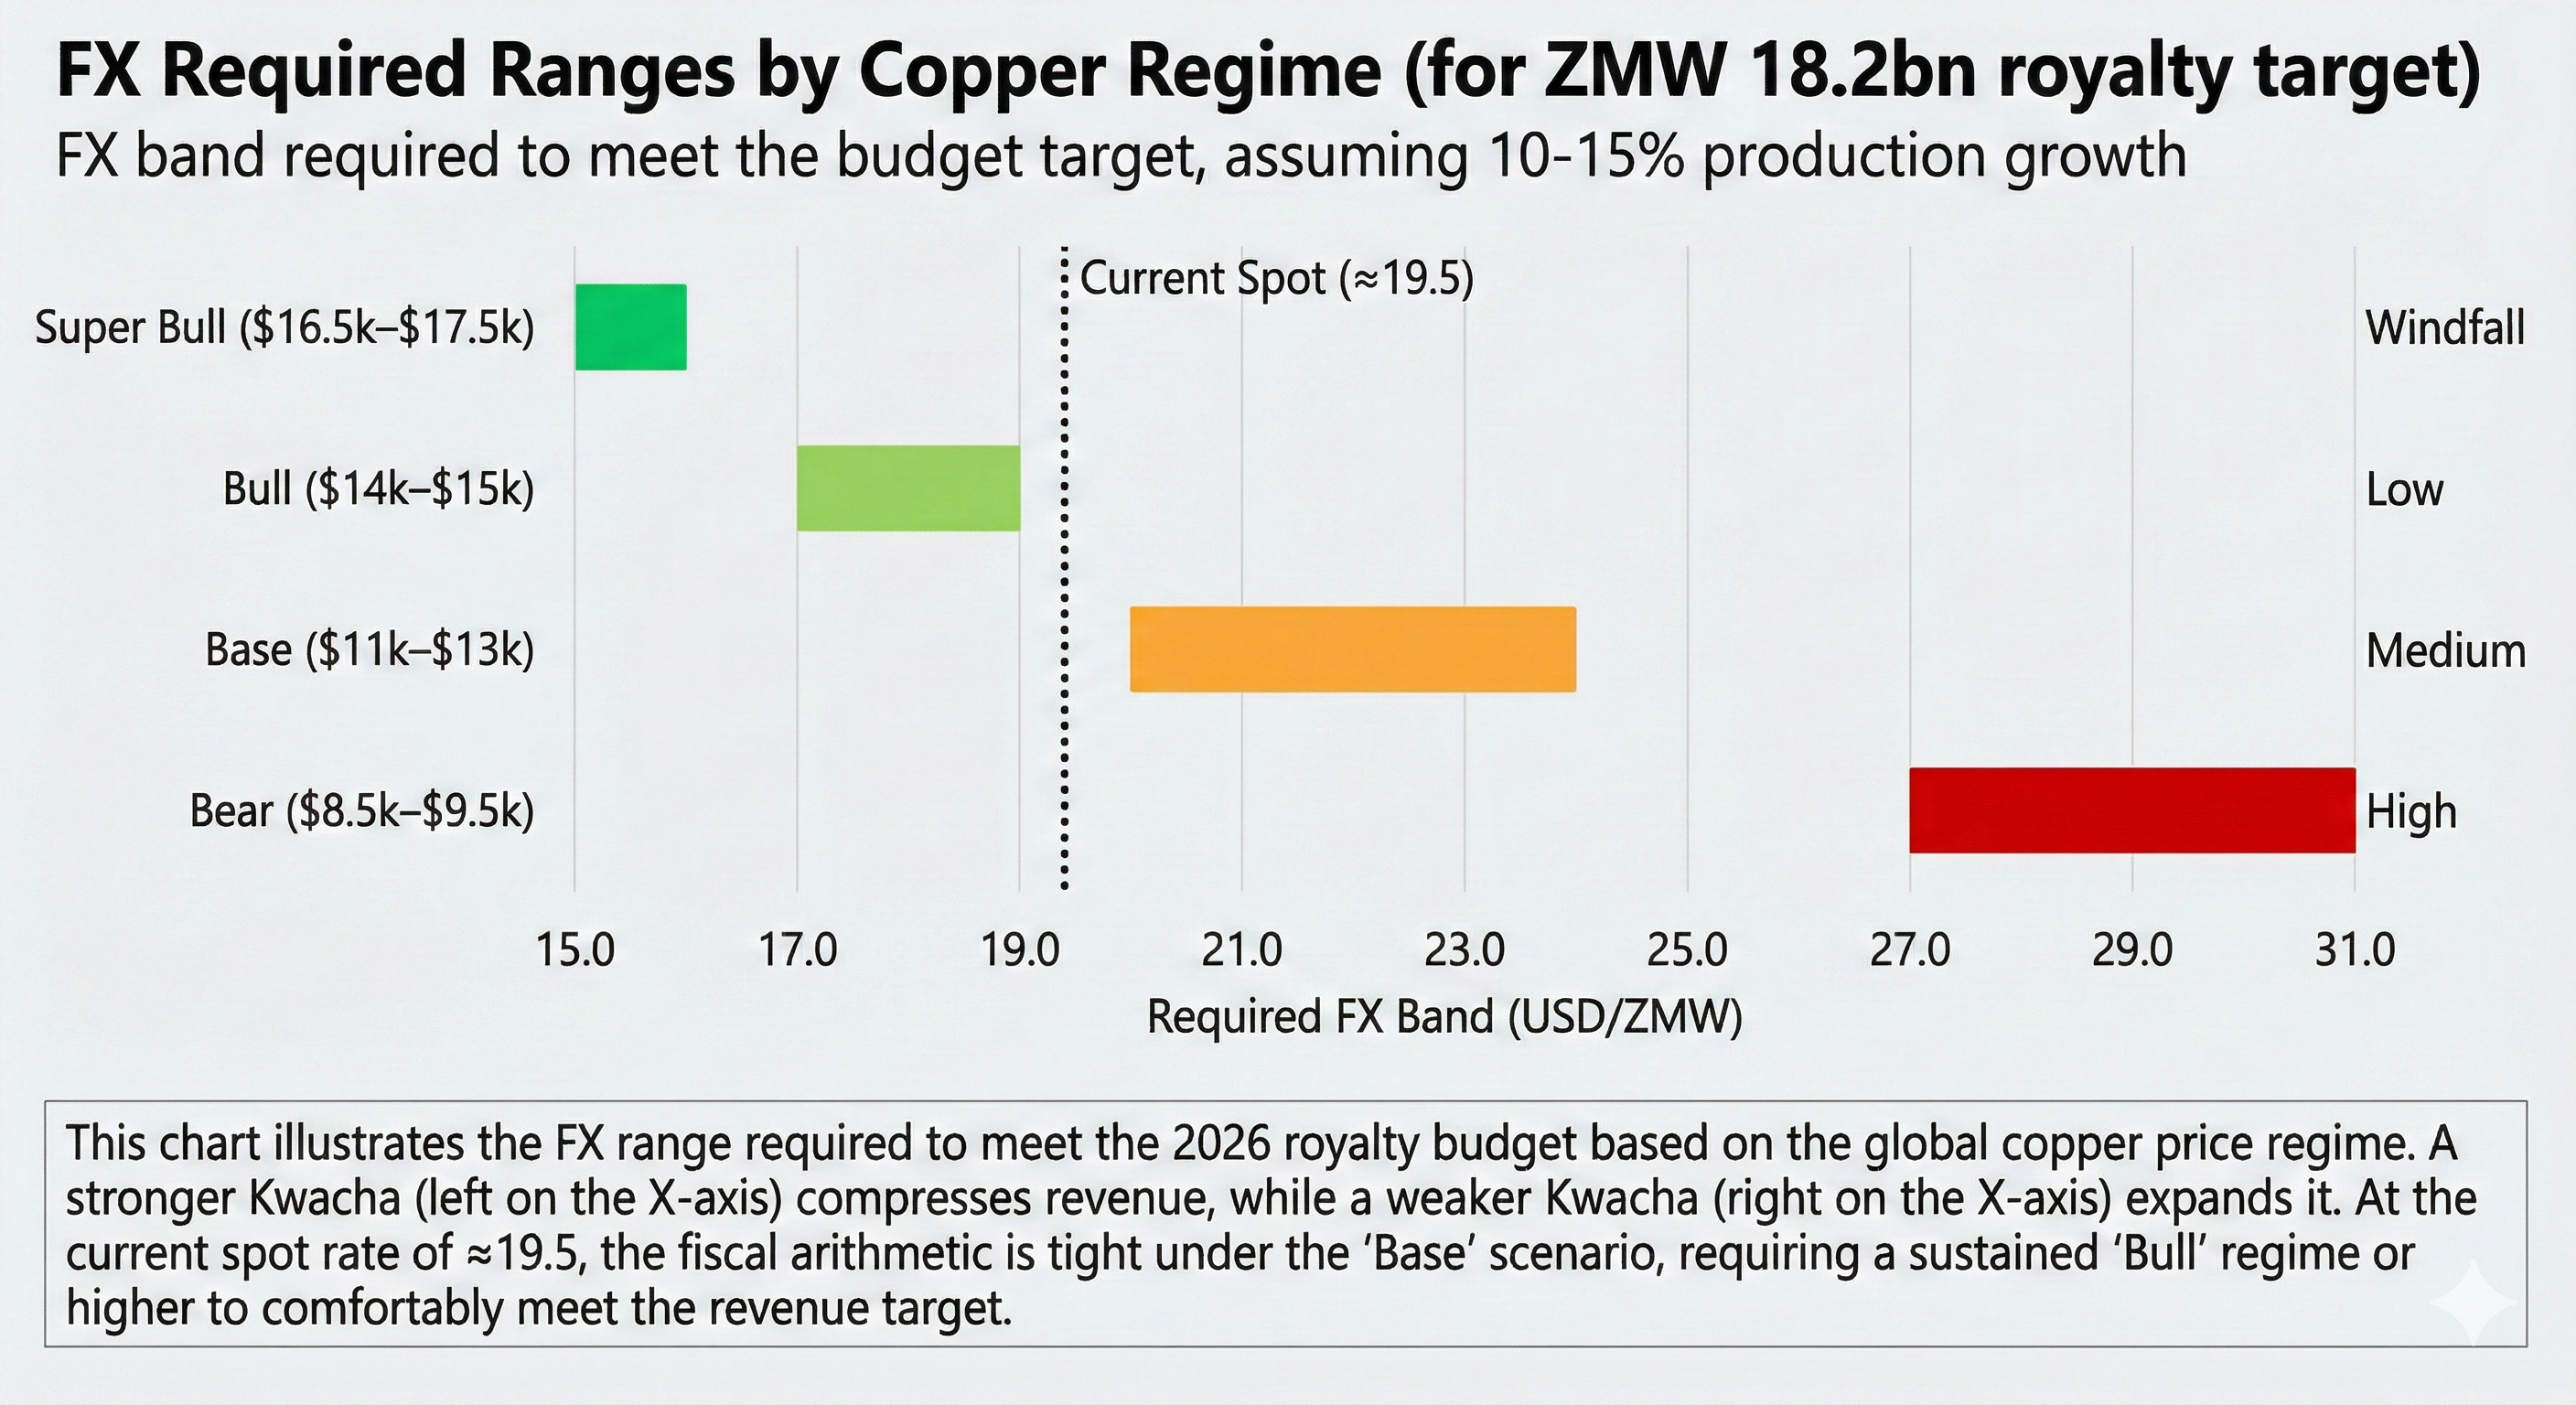
AI-generated Image of FX Required Ranges by Copper Regime
Note: This update builds on Zambia 2026 Domestic Market Absorption: The Arithmetic Through End-January, published last week. It adds a structured explanation of the mineral royalty arithmetic and an explicit scenario framework for copper, prompted by preliminary 2025 production figures circulating in the market. Where 2025 production is referenced, it is treated as provisional until confirmed by official releases. The FY25 mineral royalty baseline used here is the same November outturn anchored estimate referenced in the Revenue Side Vulnerability section of the domestic absorption article.
1. What This Note Does
This note does not attempt to forecast Zambia’s revenue outturn or produce a tax simulation. It maps constraint boundaries under alternative assumptions for copper price, copper output, and the USD/ZMW exchange rate. The aim is stress testing: identifying the ranges under which the 2026 budget arithmetic holds, and the ranges under which domestic market absorption rises.
The framework remains unchanged from the original article. The refinement is interpretive discipline: separating revenue scale from revenue volatility, and correctly positioning mineral royalties inside the broader revenue fragility structure.
2. Revenue Vulnerability: Scale, Execution Risk, and Volatility
An institutional-level critique often begins with a valid observation: mineral royalties are not the largest revenue line. In the 2026 budget, mineral royalties are budgeted at ZMW18.2bn out of ZMW206.5bn in total domestic revenue, roughly 8.8 per cent.
So why focus on them? Because the correct framing is not scale. It is fragility.
By scale, the largest domestic revenue drivers are tax revenues: VAT, PAYE, customs and excise duties, and other income taxes.
By execution risk, the dominant vulnerabilities are VAT collection efficiency (2025 ran at 77 per cent of target), grants and external financing realism, and mineral royalty performance relative to FX and output.
By volatility, mineral royalties matter because they are directly linked to external prices, directly linked to the exchange rate, and harder to fix mid-year without volume, compliance, or policy shifts.
Royalties are not the largest line. They are the most mechanically exposed line. That is why they matter in a tight funding year.
The correct conclusion is not that royalties dominate revenue. It is that royalties can create fiscal gaps quickly, and those gaps shift the burden onto domestic issuance.
3. Royalty Rate Structure
Under Zambia’s mineral royalty schedule as amended in 2024, copper royalties operate on a sliding scale. At prices above the top threshold, the royalty rate does not rise further. This means high copper does not create a rising tax rate, it creates a higher norm value base. The fiscal benefit is linear, not convex.
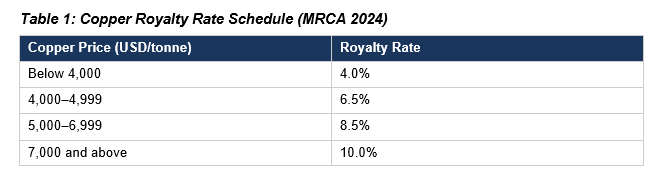
At all prices within our scenarios, Zambia is in the 10 per cent bracket. This note therefore uses a proportional sensitivity framework, not a tax simulation.
4. The Calculation Logic
Mineral royalties in kwacha are proportional to four variables:
R = Q × P × E × T
Where R is mineral royalties in ZMW, Q is copper production in tonnes, P is average copper price in USD per tonne, used here as an LME proxy for the norm value base, E is average exchange rate in ZMW per USD, and T is the effective take factor capturing the royalty schedule, compliance, enforcement, and timing.
Comparing 2026 to 2025 using ratios:
R₂₀₂₆ / R₂₀₂₅ = (Q₂₀₂₆ / Q₂₀₂₅) × (P₂₀₂₆ / P₂₀₂₅) × (E₂₀₂₆ / E₂₀₂₅) × (T₂₀₂₆ / T₂₀₂₅)
For a first pass, we hold the effective take factor constant (T₂₀₂₆ / T₂₀₂₅ = 1). This isolates the pure macro arithmetic before adding policy effects.
5. Inputs Used
From the 2026 budget:
· FY25 estimated mineral royalties: ZMW 15.540bn, as per the Ministry of Finance Revenue Performance table. This FY25 estimate is derived from the Outturn year-to-date to November of ZMW14.245bn and is consistent with annualising the November outturn. For ease of arithmetic, this note rounds the baseline to ZMW15.5bn.
· 2026 budgeted royalties: ZMW18.200bn (Revenue Performance table shows ZMW18.199881bn)
· Target multiplier: 18.199881 / 15.540177 = 1.171150 (17.115 per cent increase). Rounding convention: calculations use the unrounded multiplier and unrounded ratios; results are rounded only at the final displayed step (K to three decimals, required growth to one decimal point, and FX required band to one decimal point)
Macro anchors:
· 2025 average copper price: USD 9,947 per tonne
· 2025 average USD/ZMW: 25.2
· Spot USD ZMW reference: approximately 19.5 to 19.8, used as a rounded market reference for constraint mapping rather than a precise fixing. The binding variable is the annual average exchange rate.
· Current spot copper: approximately USD 13,000 per tonne (LME)
6. Solving for Required Production Growth
Rearranging the ratio identity to solve for output growth:
Required production growth = (Target / K) − 1
Where K is the price-FX multiplier: K = (P₂₀₂₆ / P₂₀₂₅) × (E₂₀₂₆ / E₂₀₂₅)
Worked Example 1: Bull copper (USD 14,500), current FX (19.5)
K = (14,500 / 9,947) × (19.5 / 25.2) = 1.458 × 0.774 = 1.128
Required growth = (1.171150 / 1.128) − 1 = 3.8%
→ Royalty target achievable with modest production growth
Worked Example 2: Base copper (USD 13,000), current FX (19.5)
K = (13,000 / 9,947) × (19.5 / 25.2) = 1.3069 × 0.7738 = 1.011
Required growth = (1.171150 / 1.011) − 1 = 15.8%
→ Royalty target requires strong production growth
Worked Example 3: Bear copper (USD 9,000), current FX (19.5)
K = (9,000 / 9,947) × (19.5 / 25.2) = 0.905 × 0.774 = 0.700
Required growth = (1.171150 / 0.700) − 1 = 67.3%
→ Royalty target structurally undeliverable at current FX
7. Solving for Required Exchange Rate
Rearranging to solve for E₂₀₂₆:
E₂₀₂₆ = E₂₀₂₅ × Target / [(P₂₀₂₆ / P₂₀₂₅) × (1 + g)]
Worked Example 4: Base copper (USD 13,000), 15% production growth
E₂₀₂₆ = 25.2 × 1.171150 / (1.3069 × 1.15) = 29.51 / 1.503 = 19.64
→ FX can average approximately 19.6 and still hit target at 15% growth
Worked Example 5: Base copper (USD 11,000), 15% production growth
E₂₀₂₆ = 25.2 × 1.171150 / (1.1057 × 1.15) = 29.51 / 1.272 = 23.21
→ FX must average approximately 23.2 to hit target; significant depreciation required
This is the spine of the argument. At current FX levels, the royalty arithmetic works only if copper stays at the top of the Base range or enters Bull territory. If copper retreats toward USD 11,000, the FX must depreciate or production must exceed 30 per cent.
8. The Bear, Base, Bull, Super Bull Framework
Rather than anchoring the analysis to one copper path, this note frames copper under four regimes with explicit probability weights:
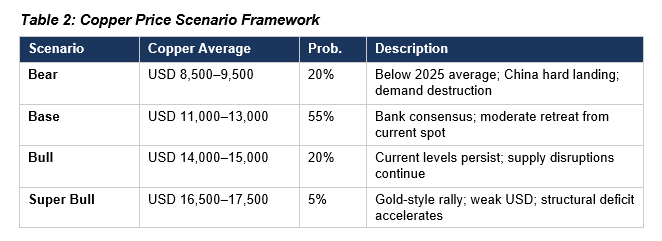
The probability weighting reflects a disciplined view: 75 per cent of outcomes involve copper retreating from current spot or staying flat (Bear + Base), while 25 per cent involve sustained elevation or further gains (Bull + Super Bull).
Note on forecasts: The original article cited JP Morgan’s March 2025 projection of USD 11,000. Since publication, forecasts have firmed. JP Morgan’s November estimate stands at USD 12,075, with a Q2 2026 peak of USD 12,500. Goldman Sachs expects USD 10,000–11,000 for 2026, with a long-term target of USD 15,000 by 2035. Current three-month LME copper trades near USD 13,000. Gold rallied 65 per cent in 2025; a similar momentum spillover into copper would support the Super Bull scenario.
9. The Constraint Mapping Table
The table below summarises the fiscal constraint logic across regimes. The “Required Growth” column shows the production growth required at the spot reference exchange rate. The “FX Required Band” column shows the strongest allowable annual average USD ZMW range that still delivers the royalty target under two production growth assumptions, 10 per cent and 15 per cent, holding the effective take factor constant. Required growth uses spot FX as a reference point, while the FX band reflects the annual average rate required to meet the target.
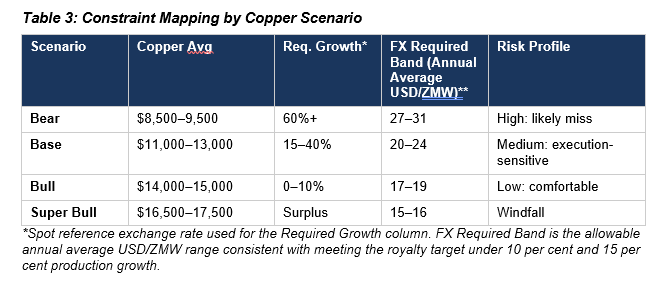
Bear (20%): The fiscal is structurally short. Copper below the 2025 average requires production growth above 60 per cent at current FX, impossible by any historical standard, or FX depreciation back toward roughly 27–31, depending on whether output grows 10–15 per cent. Revenue underperformance is near-certain.
Base (55%): The arithmetic is tight. At the top of the range (USD 13,000), current FX works with 15–16 per cent growth. At the bottom (USD 11,000), FX must weaken to 23–24 or production must exceed 35 per cent. Achievable only at the top of the range with strong execution.
Bull (20%): The FX constraint relaxes. At USD 14,000–15,000, production growth of 0–10 per cent delivers the royalty target. The fiscal has room to breathe.
Super Bull (5%): A windfall scenario. At USD 16,500–17,500, the fiscal generates surplus even with flat production. This requires a 2025 gold-style rally spilling into copper, sustained supply disruptions, and a weaker USD.
The bull case relaxes the FX constraint. It does not remove it.
10. Production Series
For structural analysis, Canary Compass anchors on the national statistical record: ZamStats for 2015–2022 and the Ministry of Mines for 2023–2024. The 2025 figure is treated as a reported signal pending official release.
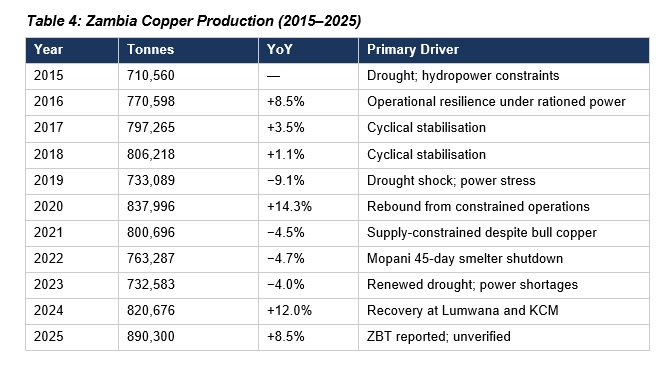
The compound annual growth rate from 2015 to 2025 is approximately 2.3 per cent per year. Over the entire decade, only two years exceeded 10 per cent growth: 2020 and 2024. Both followed periods of contraction. The 2021 observation is particularly instructive: copper prices were elevated globally, yet Zambia’s production fell. This confirms that correlation between copper prices and Zambian output can break down when supply constraints dominate.
Solutions were found to the energy crisis. Kafue Gorge Lower came online. Yet growth has been 12 per cent, then 8 per cent (if confirmed), recovery rates, meaningful in isolation, but the fiscal must be priced on replicable growth regimes, not rebound phases.
11. The 3 Million Tonne Ambition
The government targets 3 million tonnes of copper production by 2031. From a 2025 base of 890,300 tonnes, this requires a compound annual growth rate of approximately 22 per cent per year, nearly ten times the historical decade average of 2.3 per cent.
This is a different conversation from the 2026 fiscal arithmetic. It requires sustained capital inflows north of USD3-5bn per year, resolution of transmission and water infrastructure constraints, and a stable fiscal regime for at least seven to ten years. The decade production pattern suggests Zambia remains in a recovery regime rather than a structural transformation regime.
For context: the Democratic Republic of Congo produced approximately 2.9 million tonnes in 2024 and is on track to exceed 3 million tonnes in 2025. Zambia, at less than 1 million tonnes, is seeing the competitive gap widen.
12. The Macro Fiscal Loop
Zambia’s fiscal, FX, and domestic market dynamics form a closed loop:
Copper price, production, and FX influence mineral royalties. Revenue shortfalls increase reliance on domestic issuance. Domestic issuance absorbs bank liquidity and raises the inflation impulse through the fiscal channel. Inflation pressures monetary policy and liquidity conditions. Monetary conditions influence FX dynamics. FX strength compresses kwacha revenues, including royalties and import-linked lines. The loop restarts.
This is why FX strength is not unambiguously positive. It improves inflation optics but can weaken the fiscal base, increasing domestic absorption pressure. The original article covered these dynamics in detail; this note adds the explicit copper scenario structure to that framework.
13. Limitations and Counterarguments
This analysis invites several critiques:
First, the proportionality assumption is simplifying. Real royalty receipts depend on compliance, deductions, timing, and the mix of producers. The tables are sensitivities that isolate the mechanical pressure from exogenous variables; they are not point forecasts.
Second, the historical correlation between copper prices and Zambian revenues has weakened. Production fell in 2021 when prices were strong. The proportional model assumes demand-side variables transmit cleanly to revenues. In reality, supply constraints can dominate, breaking the arithmetic regardless of price.
Third, the model treats FX as exogenous when it is partially endogenous. If copper prices rise, the kwacha may strengthen further (Dutch disease), which would offset some of the price gain. The scenarios partially address this but do not fully capture the dynamic interaction.
Fourth, this analysis focuses on one revenue line in a budget with multiple vulnerabilities. VAT (47 per cent growth assumed against 77 per cent collection efficiency in 2025), grants (173 per cent), and external financing (844 per cent) carry greater execution risk. Mineral royalties are a testable bellwether, not the whole story.
Fifth, the probability assignments are indicative. They reflect the distribution of investment bank forecasts and subjective assessment of tail risks. A formal probabilistic model would require assumptions about correlation structures that exceed the scope of this note.
14. Conclusion
The original article’s core point remains intact. Domestic market absorption is refinancing plus deficit funding plus within-year churn. The constraint is tighter without an IMF anchor and in an election year. Revenue assumptions embed a three-part fragility structure: VAT execution, grants and external financing realism, and mineral royalty performance.
This note adds the explicit scenario framework that makes the copper dependence tractable:
• Under the Bear case (20%), the royalty line is structurally short.
• Under the Base case (55%), the arithmetic is tight but feasible with strong execution at the top of the copper range.
• Under the Bull case (20%), the fiscal has room to breathe.
• Under the Super Bull case (5%), the fiscal generates a windfall.
Even in a strong copper environment, FX strength still binds because it compresses kwacha revenues unless volume growth overshoots. The reported 8 per cent growth in 2025, if confirmed, is meaningful but sits below what the Base case arithmetic requires at current FX levels.
The arithmetic remains clear, the execution risk remains real, and the governance gap remains open.
Note on Data Status
FY25 revenue estimates are derived from year-to-date outturn to November and annualised. This is used as a working baseline to illustrate stress boundaries, not as an audited reference point. The 2025 copper production figure referenced is from a reported post on the Zambian Business Times Facebook page citing official data; it is treated as provisional until confirmed by ZamStats or the Ministry of Mines. The decade trend analysis anchors on confirmed official series.
Production series: ZamStats (2015–2022), Ministry of Mines (2023–2024). Royalty rate structure: Minerals Regulation Commission Act, No. 14 of 2024, Section 68. Copper price forecasts: JP Morgan, Goldman Sachs, Bank of America (November–December 2025). Current copper price: London Metal Exchange (27 January 2026). Exchange rate: Bank of Zambia (27 January 2026).
Disclaimer
This article does not constitute legal, financial, or investment advice. The author shares views for perspective and discussion only. Do not rely on them as a substitute for professional advice tailored to your specific circumstances. Always consult a qualified legal, financial, investment, or other professional adviser before making decisions based on this content. The analysis reflects proprietary research undertaken by Canary Compass and the author.
Canary Compass and the author accept no liability for actions taken or not taken based on the information in this article.
About the Author
Dean N. Onyambu is the Founder and Chief Editor of Canary Compass. His insights draw on experience across trading, fund leadership, governance, and economic policy.
The Canary Compass Channel is available on @CanaryCompassWhatsApp for economic and financial market updates on the go.
Canary Compass is also available on Facebook: @CanaryCompassFacebook.
For more insights from Dean, you can follow him on LinkedIn @DeanNOnyambu, X @InfinitelyDean, or Facebook @DeanNathanielOnyambu