
Zambia Macro Note: Growth Without Diffusion
What Zambia’s 2025 GDP Data Reveals About Who Actually Grows

In November 2025, before the data arrived, we wrote this:
Growth came in at 3.8 per cent. The thesis was right. The projection was not.
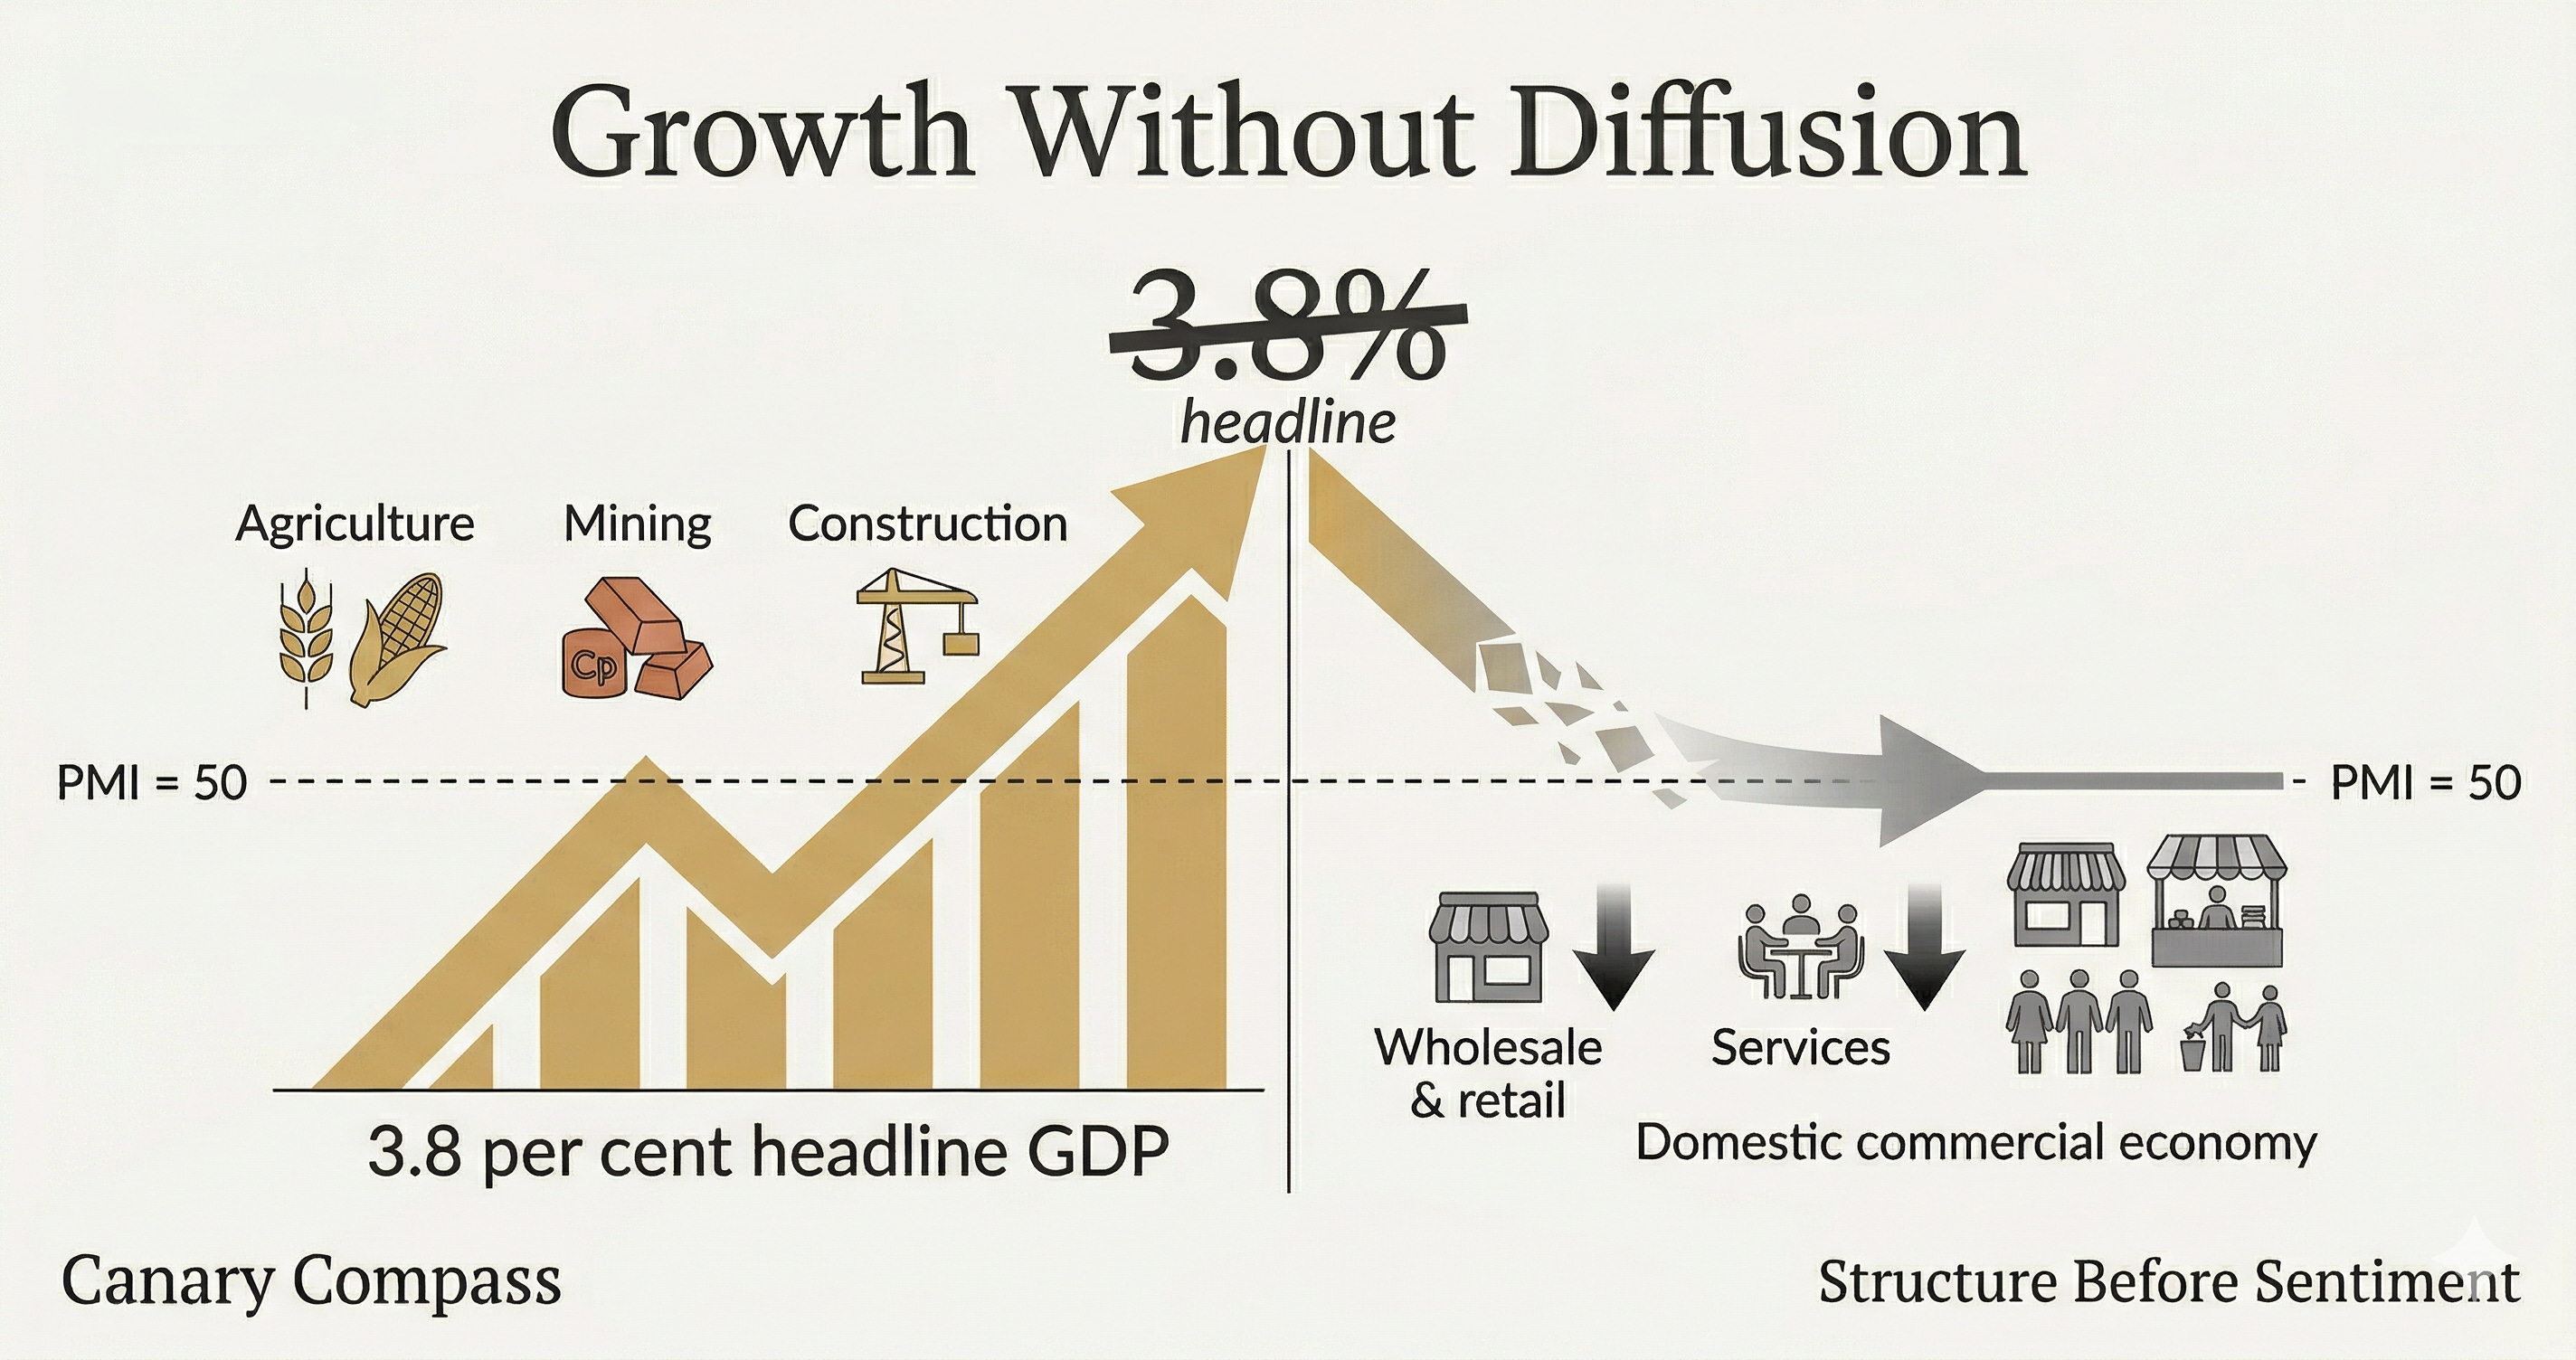
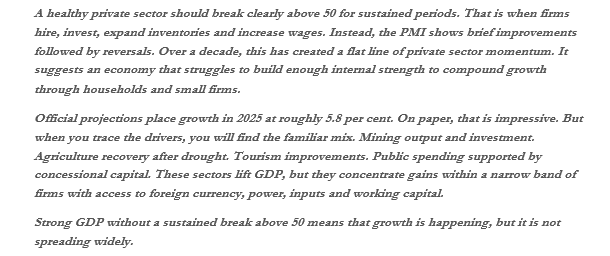
The question was never whether Zambia would grow. It was whether growth would reach the parts of the economy that employ most people, serve most households, and generate most of the tax base that sustains public spending. The 2025 data answers that question with unusual clarity. Agriculture and mining drove the headline. Wholesale and retail trade, the sector that touches households most directly, contracted at its deepest rate in at least five years. The Stanbic Bank Zambia PMI, surveying approximately 400 firms across all major sectors, never broke convincingly above 50. Growth happened, but it did not spread.
The miss
Full year 2025 GDP came in at 3.8 per cent, matching the revised 2024 outturn. Every major institution overestimated growth.
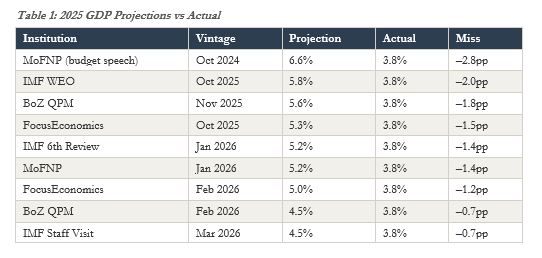
The IMF’s March 2026 staff visit, the most recent estimate before the data release, cited weaker mining, softer wholesale trade, and energy constraints on non-mining activity. Even that estimate overshot by 0.7 percentage points.
The miss is concentrated in Q4. The first three quarters of 2025 averaged 4.6 per cent (4.6, 5.5, 3.7), consistent with a moderately growing economy. Q4 printed 1.6 per cent, dragging the annual figure below every forecast.
Where the headline comes from
The headline GDP figure of 1.6 per cent in Q4 is measured at purchasers’ prices. The underlying productive economy (total gross value added at basic prices) grew 2.1 per cent, but a 0.4 percentage point drag from taxes less subsidies on products, which contracted 8.9 per cent, pulled the headline lower. That contraction reflects in part the collapse in wholesale and retail activity, which depresses VAT and import duty collection. It is not confined to 2025. The 2026 budget requires a materially larger revenue envelope. If wholesale and retail activity remains depressed, the domestic tax base that funds it will underperform, making an already difficult financing year harder.
Two sectors account for the bulk of the Q4 deceleration. ICT subtracted 2.5 percentage points. Wholesale and retail trade subtracted 1.5 percentage points. Together they removed 4.0 percentage points from Q4 value added. But the year-on-year swing table reveals that the story extends further.
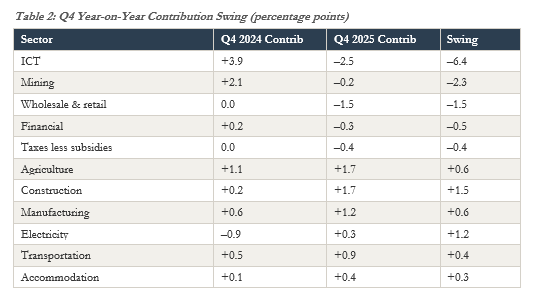
Gross negative swings totalled 11.2 percentage points. Gross positive swings totalled 4.6 percentage points. ICT accounted for 57 per cent of the gross negative and 96 per cent of the net deceleration. But mining swung negative by 2.3 percentage points and financial services by 0.5. The Q4 print is not the story of one sector collapsing. It is the story of broad service-sector weakness overwhelming recoveries in agriculture, manufacturing, construction, and electricity.
This distinction matters because the sectors that drove the recovery are structurally different from those that contracted. Agriculture, construction, and electricity are capital-intensive, often publicly supported, and employ relatively few people per unit of output. Wholesale and retail, financial services, and the informal economy adjacent to them are where employment concentrates, household spending circulates, and the tax base compounds.
The wholesale and retail signal
The ICT question, which we address below, should not obscure the genuine economic signal in the data.
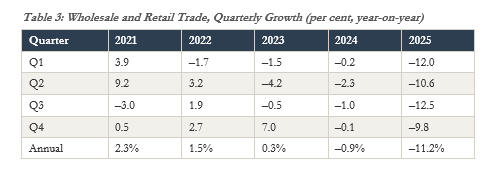
Wholesale and retail trade contracted 11.2 per cent for the full year 2025, subtracting 1.8 percentage points from annual growth, the single largest sectoral drag on the economy. The five-year trajectory is unmistakable: growth in 2021, positive in 2022, marginal in 2023, mild contraction in 2024, then a sharp acceleration to deep and sustained contraction across every quarter of 2025.
The PMI data confirms the mechanism. In March 2025, firms reported reduced purchasing power at customers. By May, new orders surged to their strongest in seven years as the Kwacha appreciation from its March peak improved purchasing power. That relief was temporary. By December, firms again cited lower purchasing power at clients, and new orders contracted for the first time in nine months.
Three forces converged. First, cumulative price erosion. Consumer prices rose approximately 60 per cent between end-2021 and end-2025, with food inflation running at 18.9 per cent as late as March 2025. Four consecutive years of double-digit inflation, averaging roughly 12.7 per cent annually from 2022 to 2025, systematically eroded household purchasing power. Agriculture grew 51.1 per cent in 2025 and the maize harvest was a record, but agricultural GDP measures output, not farmer income. Smallholders entered 2025 with balance sheets depleted by the failed 2024 harvest and no working capital to convert a strong season into restored purchasing power. The quantity was there. The transmission to household spending was not.
Second, the Kwacha moved through three phases, each interacting with power recovery and cost pressures but visible as the dominant currency regime in the PMI testimony. A depreciation phase through Q1 2025 (peaking at ZMW 28.90 in March) drove up import costs and squeezed margins. A sweet spot from Q2 through Q3, as appreciation lowered input costs and improved purchasing power. Then a competitiveness squeeze from Q4 into 2026 as the appreciation accelerated to ZMW 18.80, with firms explicitly citing cheaper imports undercutting domestic production.
Third, weak credit transmission. Private sector credit growth fell from 21.4 to 15.7 per cent, and what remained was concentrated: approximately 65 per cent of total lending flows to the top 20 borrowers (Bank of Zambia data, December 2025), and only around 10 per cent of firms hold a bank loan or line of credit (World Bank Enterprise Survey, 2019). The Bank of Zambia’s February 2026 Monetary Policy Report documented firms repaying loans rather than borrowing. For the small and medium firms that dominate wholesale and retail, the formal credit channel remained effectively closed.
The relatively consistent contraction across all four quarters (negative 12.0, 10.6, 12.5, 9.8) indicates a sustained structural squeeze, not a single discrete shock. The PMI confirms this independently of the GDP statistics: firms reported demand destruction, margin compression, and falling purchasing power across the year. Part of the measured contraction may reflect relative price effects from the Kwacha appreciation compressing the GDP deflator for imported goods. But the firm-level testimony points to genuine demand weakness, not a statistical artefact. This is the clearest signal in the data that growth in 2025 did not diffuse.
The ICT question
The ICT sector’s Q4 behaviour has become a defining feature of Zambia’s quarterly GDP profile. The five-year record shows why.
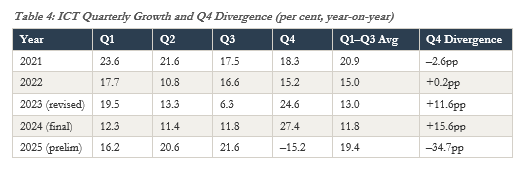
In 2021 and 2022, ICT growth was stable across quarters. Starting in 2023, Q4 began diverging sharply: positive 11.6 percentage points above the Q1–Q3 average in 2023, positive 15.6 in 2024, then negative 34.7 in 2025. The swing from positive 27.4 per cent in Q4 2024 to negative 15.2 per cent in Q4 2025 spans 42.6 percentage points in a single year.
Three layers are relevant and may operate simultaneously.
First, the structural observation. Something changed in Q4 ICT behaviour starting in 2023. The divergence pattern did not exist in 2021 or 2022. Whether this reflects a change in real economic activity (lumpy capital deployments, spectrum allocations, discrete regulatory compliance events) or a change in how activity is captured across quarters is not determinable from published data.
Second, base effects. ICT grew 24.6 per cent in Q4 2023 and 27.4 per cent in Q4 2024. If base effects were the primary driver of the Q4 2025 reversal, they should have dampened Q4 2024 as well. They did not. Q4 2024 accelerated on an already elevated base. The three-year compound annual growth rate from Q4 2022 to Q4 2025 remains approximately 10.4 per cent. ICT output is still roughly 35 per cent above its Q4 2022 level. The sector has not collapsed. It has corrected from an elevated peak. But the correction alone does not explain a 34.7 percentage point divergence from the Q1-Q3 average, nor does it explain why the Q4 divergence pattern began in 2023 but did not exist in 2021 or 2022.
Third, the measurement question. ZICTA, Zambia’s telecommunications regulator, publishes data annually. It does not produce quarterly indicators. Kenya’s National Bureau of Statistics, by contrast, uses quarterly subscriber, traffic, and revenue data from the Communications Authority to interpolate quarterly ICT GDP. Whether ZamStats has access to equivalent quarterly source data is not publicly documented. If such a gap exists, it may contribute to the Q4 volatility, which is not uncommon in preliminary national accounts where quarterly estimates are later reconciled against annual enterprise data.
For the full year 2025, ICT grew 6.4 per cent and contributed 0.8 percentage points to annual GDP. The sector was a net positive contributor to the year. Airtel Zambia, the largest mobile network operator, published audited results for calendar year 2025: nominal revenue up 26 per cent to ZMW 8.95 billion, subscribers up 12 per cent to 12.45 million, and ZMW 2.66 billion in new property, plant and equipment. But GDP measures gross value added, not revenue. If intermediate consumption surged, as it plausibly did given the 217 per cent spike in services-sector diesel consumption during the 2024 power crisis, the massive capital deployment, and the dollarised cost of international bandwidth, then value added can contract while revenue grows. The sector-specific GDP deflator also differs materially from headline CPI.
The Q4 2025 ICT figure is preliminary. ZamStats has revised preliminary sectoral data in past releases, sometimes materially. The note’s argument does not depend on resolving the ICT question because the wholesale and retail contraction is independently confirmed at firm level by the PMI.
The power story
Some coverage attributed the Q4 growth deceleration to record power outages. The data complicates that narrative.
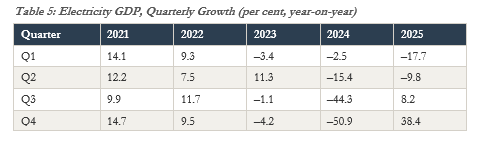
Electricity GDP grew 38.4 per cent in Q4 2025, contributing 0.3 percentage points to growth. But that figure is itself a base effect. Q4 2024 contracted 50.9 per cent. The arithmetic: 100 multiplied by 0.491 multiplied by 1.384 yields approximately 68. Electricity output in Q4 2025 remained roughly 32 per cent below Q4 2023 levels. The power crisis was easing, but it was not over.
The PMI confirms this at firm level. In October 2025, firms cited inconsistent energy supplies as a constraint on output. In November, load shedding and unstable electricity hampered production for the second consecutive month. Agriculture was the only sector expanding in both output and new orders by Q4. The 38.4 per cent growth in electricity generation GDP did not translate into reliable power at the business level. Generation recovered; distribution did not.
The damage from the 2024 crisis also operated with a lag. The H2 2024 PMI data shows how severe the conditions were. The headline PMI averaged 47.8 in Q3 2024 and 49.3 in Q4 2024. September 2024 hit 45.6, the sharpest deterioration in over four years. Output, new orders, and employment all contracted simultaneously. Firms were cutting jobs, depleting inventories at the fastest rate since 2020, and reporting backlogs at their highest in over four and a half years. By the time the PMI crossed back above 50 in December 2024, output had been contracting for thirteen consecutive months.
That is the condition firms carried into 2025. The sustained load shedding systematically depleted corporate working capital. Businesses that exhausted cash reserves running generators in 2024 entered 2025 without the financial capacity to restock inventory or expand operations. The sectoral timing supports this: wholesale and retail contracted mildly in 2024 (negative 0.9 per cent), when load shedding was at its most severe, then deeply in 2025 (negative 11.2 per cent), when generation was recovering. If power outages alone drove the 2025 contraction, the 2024 figures should have been worse. They were not. The financial residue of the crisis, not the crisis itself, is consistent with the 2025 pattern.
The firm-level evidence
The PMI data provides the interpretive layer that connects the sectoral GDP figures to what firms actually experienced in 2025. Three patterns stand out.
First, the headline PMI overstated the health of the private sector. Output contracted at firm level in eight of fourteen months between January 2025 and February 2026, despite the headline PMI remaining above 50 for eleven of those months. The PMI was held above the expansion threshold by new orders, employment, and inventory building, not by actual production. GDP measures output, not orders. The PMI’s output sub-index measures month-on-month change at firm level, not year-on-year aggregate output; its value is confirming the breadth and persistence of private sector weakness across the year, not quantifying the contraction. The disconnect between the PMI headline and its output sub-index is the pattern of an economy where firms positioned for growth that did not arrive.
Second, firms hired ahead of demand that never materialised. Employment expanded in eleven of fourteen months. November 2025 recorded the fastest hiring since January 2018. Yet output fell that same month. Firms built capacity for an expansion that the cost squeeze, power instability, and weakening demand did not support. By January 2026, they began cutting staff for the first time in nine months.
Third, the pricing data reveals the margin compression in real time. In Q1 2025, firms could pass rising costs through to customers. By October, they were cutting selling prices at the fastest pace in four years while their own input costs (fuel, electricity, wages) were rising. By January 2026, selling prices were falling at their steepest rate since September 2021. The balance shifted across the year: in Q4, weakening domestic demand was the primary pressure on margins; by early 2026, the further acceleration of the Kwacha to ZMW 18.80, a further 15 per cent appreciation in three months, made import competition the dominant force. Different mechanisms, same outcome: firms absorbing losses to maintain volume.
The February 2026 PMI, at 49.3, reinforces the shift. New orders fell at their sharpest pace since October 2024. Manufacturing, construction, and wholesale and retail all contracted. The driver was no longer power, inflation, or drought residue. It was the Kwacha appreciation making imports cheaper than domestic production. If this persists, the 2026 growth story faces a different constraint from 2025, and the private sector enters another year without the conditions for sustained expansion.
What this means
Zambia’s economy grew 3.8 per cent in 2025. That is slower than every major institution projected. Agriculture contributed 2.2 percentage points of annual growth. Mining added 0.5. Transport and manufacturing contributed meaningfully. These sectors performed. The economy is not stagnant.
But the domestic commercial economy, retail, services, small enterprise, the part that connects growth to household spending, contracted. Wholesale and retail subtracted 1.8 percentage points from annual growth. The PMI never broke convincingly above 50. Firms hired for expansion that did not arrive, cut prices to sustain volume they could not afford to lose, and entered 2026 facing a new threat from import competition.
The ICT sector’s Q4 volatility amplified the headline and shaped how the number was read. But it did not cause the underlying weakness. Remove ICT entirely and the picture remains: a narrow growth base, a contracting domestic commercial sector, and a private sector that spent the year at the waterline.
This is not new. For over a decade, the PMI has hovered near its long-run average of 48.9, never building the sustained momentum above 50 that signals genuine private sector expansion. The 2025 data made visible in the national accounts what the PMI had been documenting at firm level for years.
Three things would change the pattern.
First, reliable power at the distribution level. The PMI data suggests this constraint eased in early 2026, but distribution bottlenecks persisted into Q4 2025 even as generation recovered. The distinction between generation capacity and delivered supply remains the binding gap.
Second, a pace of Kwacha appreciation that domestic producers can absorb. The consumer benefit is real. But a 35 per cent move in twelve months, with a further 15 per cent in the first quarter of 2026, compresses margins faster than firms can adjust. The threat is the velocity, not the direction.
Third, transmission reform. Private sector credit grew 15.7 per cent in 2025, down from 21.4 per cent, and what remained was concentrated: approximately 65 per cent of total lending flows to the top 20 borrowers (Bank of Zambia data, December 2025), and only around 10 per cent of firms hold a bank loan or line of credit (World Bank Enterprise Survey, 2019). Cutting the policy rate does not reach the firms whose balance sheets were depleted by the 2024 crisis. What reaches them is structural reform of the lending channel: pricing transparency, collateral reform, and the legislative measures currently before Parliament. The risk is that fiscal pressure in an election year pushes monetary policy toward convenience rather than transmission. The IMF’s March 2026 staff visit identified early signs of fiscal slippage from spending pressures, including the wage bill, agricultural support, and election-related expenditure. The revenue side compounds the problem: if wholesale and retail activity remains depressed, the domestic tax base that funds the materially larger 2026 budget will underperform. Should the March 2026 bond auction, in which bid volume fell 85 per cent from February, not be a one-off, that pressure augments quite fast.
The 2025 projections overestimated because the models assumed diffusion that the structure did not deliver. The three conditions above would change the immediate pattern. But none of them are new. Power constraints, currency volatility, and broken credit transmission have shaped the private sector environment for years. What 2025 revealed is what happens when all three bind simultaneously. The question we asked in November 2025 remains the right one: who actually drives economic growth in Zambia?
Sourcing note
The analysis in this essay draws on ZamStats Monthly publications (Volume 228 through Volume 276, covering March 2022 to March 2026), Bank of Zambia Monetary Policy Reports (November 2025, February 2026), Stanbic Bank Zambia PMI press releases (September 2024 through February 2026, compiled by S&P Global from a panel of approximately 400 private sector firms), ZICTA Annual Market Reports, Airtel Zambia audited financial results (year ended December 2025), IMF staff statements and Executive Board reviews, and CEIC and FocusEconomics exchange rate data. All sectoral GDP figures are year-on-year growth rates at constant 2010 prices as published by the Zambia Statistics Agency. ICT quarterly figures for 2021 and 2022 are from their respective original publications; 2023 figures are revised (March 2025 publication); 2024 figures are final; 2025 figures are preliminary.
Disclaimer
This article does not constitute legal, financial, or investment advice. The author shares views for perspective and discussion only. Do not rely on them as a substitute for professional advice tailored to your specific circumstances. Always consult a qualified legal, financial, investment, or other professional adviser before making decisions based on this content. The analysis reflects proprietary research undertaken by Canary Compass and the author.
Canary Compass and the author accept no liability for actions taken or not taken based on the information in this article.
The views expressed in this article represent the author’s independent professional analysis and do not constitute an endorsement of any individual, institution, or position. Canary Compass and the author accept no responsibility for how this content is interpreted, excerpted, or recontextualised by third parties not involved in its production and publication. Reproducing any portion of this work in isolation, or in combination with other material, in a manner that misrepresents the author’s original meaning constitutes a distortion of the published record.
The author may hold positions in financial instruments, currencies, or assets discussed or referenced in this publication. Such positions do not constitute a recommendation to buy or sell.
All views, projections, and forecasts reflect the author’s assessment at the time of writing. Data sourced from third parties is believed to be reliable but has not been independently verified. Past performance does not indicate future results.
All content published by Canary Compass is the intellectual property of the author. Reproduction, adaptation, or redistribution, in whole or in part, requires written permission.
About the Author
Dean N. Onyambu is the Founder and Chief Editor of Canary Compass, a financial research publication focused on African monetary architecture and financial sovereignty. He brings 18 years of experience across trading, fund leadership, and economic policy, with senior roles at Standard Bank, First Capital Bank, and Opportunik Global Fund.
Read and subscribe at www.canarycompass.com.
The Canary Compass Channel is available on @CanaryCompassWhatsApp for economic and financial market updates on the go.
Canary Compass is also available on Facebook: @CanaryCompassFacebook.
For more insights from Dean, you can follow him on LinkedIn @DeanNOnyambu, X @InfinitelyDean, or Facebook @DeanNathanielOnyambu
Dean — strong piece. The wholesale and retail trajectory is the clearest signal in the national accounts and you've used it well. The power crisis balance sheet residue argument — that the financial damage lands in 2025 rather than 2024 — is genuinely non-obvious and supported by the quarterly pattern.
One structural gap worth pressing on: the margin compression framing treats Kwacha appreciation as a uniform pressure across the private sector. It isn't — and this matters for your central thesis.
The Zambian private sector contains at least two distinct firm types that respond to appreciation in opposite directions. Firms with kwacha cost stacks and kwacha revenues are largely insulated from the exchange rate channel directly. Firms with dollar cost stacks and kwacha revenues — ICT most visibly, but also transport, fuel distribution, parts of manufacturing — face a structural mismatch that appreciation makes acute. For that class of firm, a 35% move in twelve months doesn't compress margins through import competition. It actively reverses dollar-indexed revenues into kwacha-denominated contraction. That's a different mechanism from diffusion failure, and it has a different remedy.
Airtel's numbers illustrate this. Nominal kwacha revenue up 26% — but in dollar terms revenue almost certainly fell over the same period. International bandwidth, spectrum, roaming, and capex are all dollarised. If ARPU is kwacha but the cost stack is dollar, rapid appreciation hits both the income statement and — through deflator effects — the GDP value added measurement itself. The Q4 ICT collapse may be partly a measurement artefact of that mismatch rather than a real output event.
The broader point: your piece identifies diffusion failure — growth that didn't spread. But some of what appears as non-diffusion is better described as active reversal — appreciation converting dollar-anchored revenues into kwacha contraction for a specific class of structurally mismatched firms. These two economies sit inside your aggregate and respond to the same policy instrument in opposite directions. Treating them as one understates the structural problem and points toward the wrong remedies.
I've been working through the architecture of this in The Ryder Report (ZACCI) — would be interested to compare notes if you're open to it.