
ZAMBIA MACRO NOTE: The Most Expensive Recovery
Bond B, the Composite Indicator, and the Price of Macro Improvement

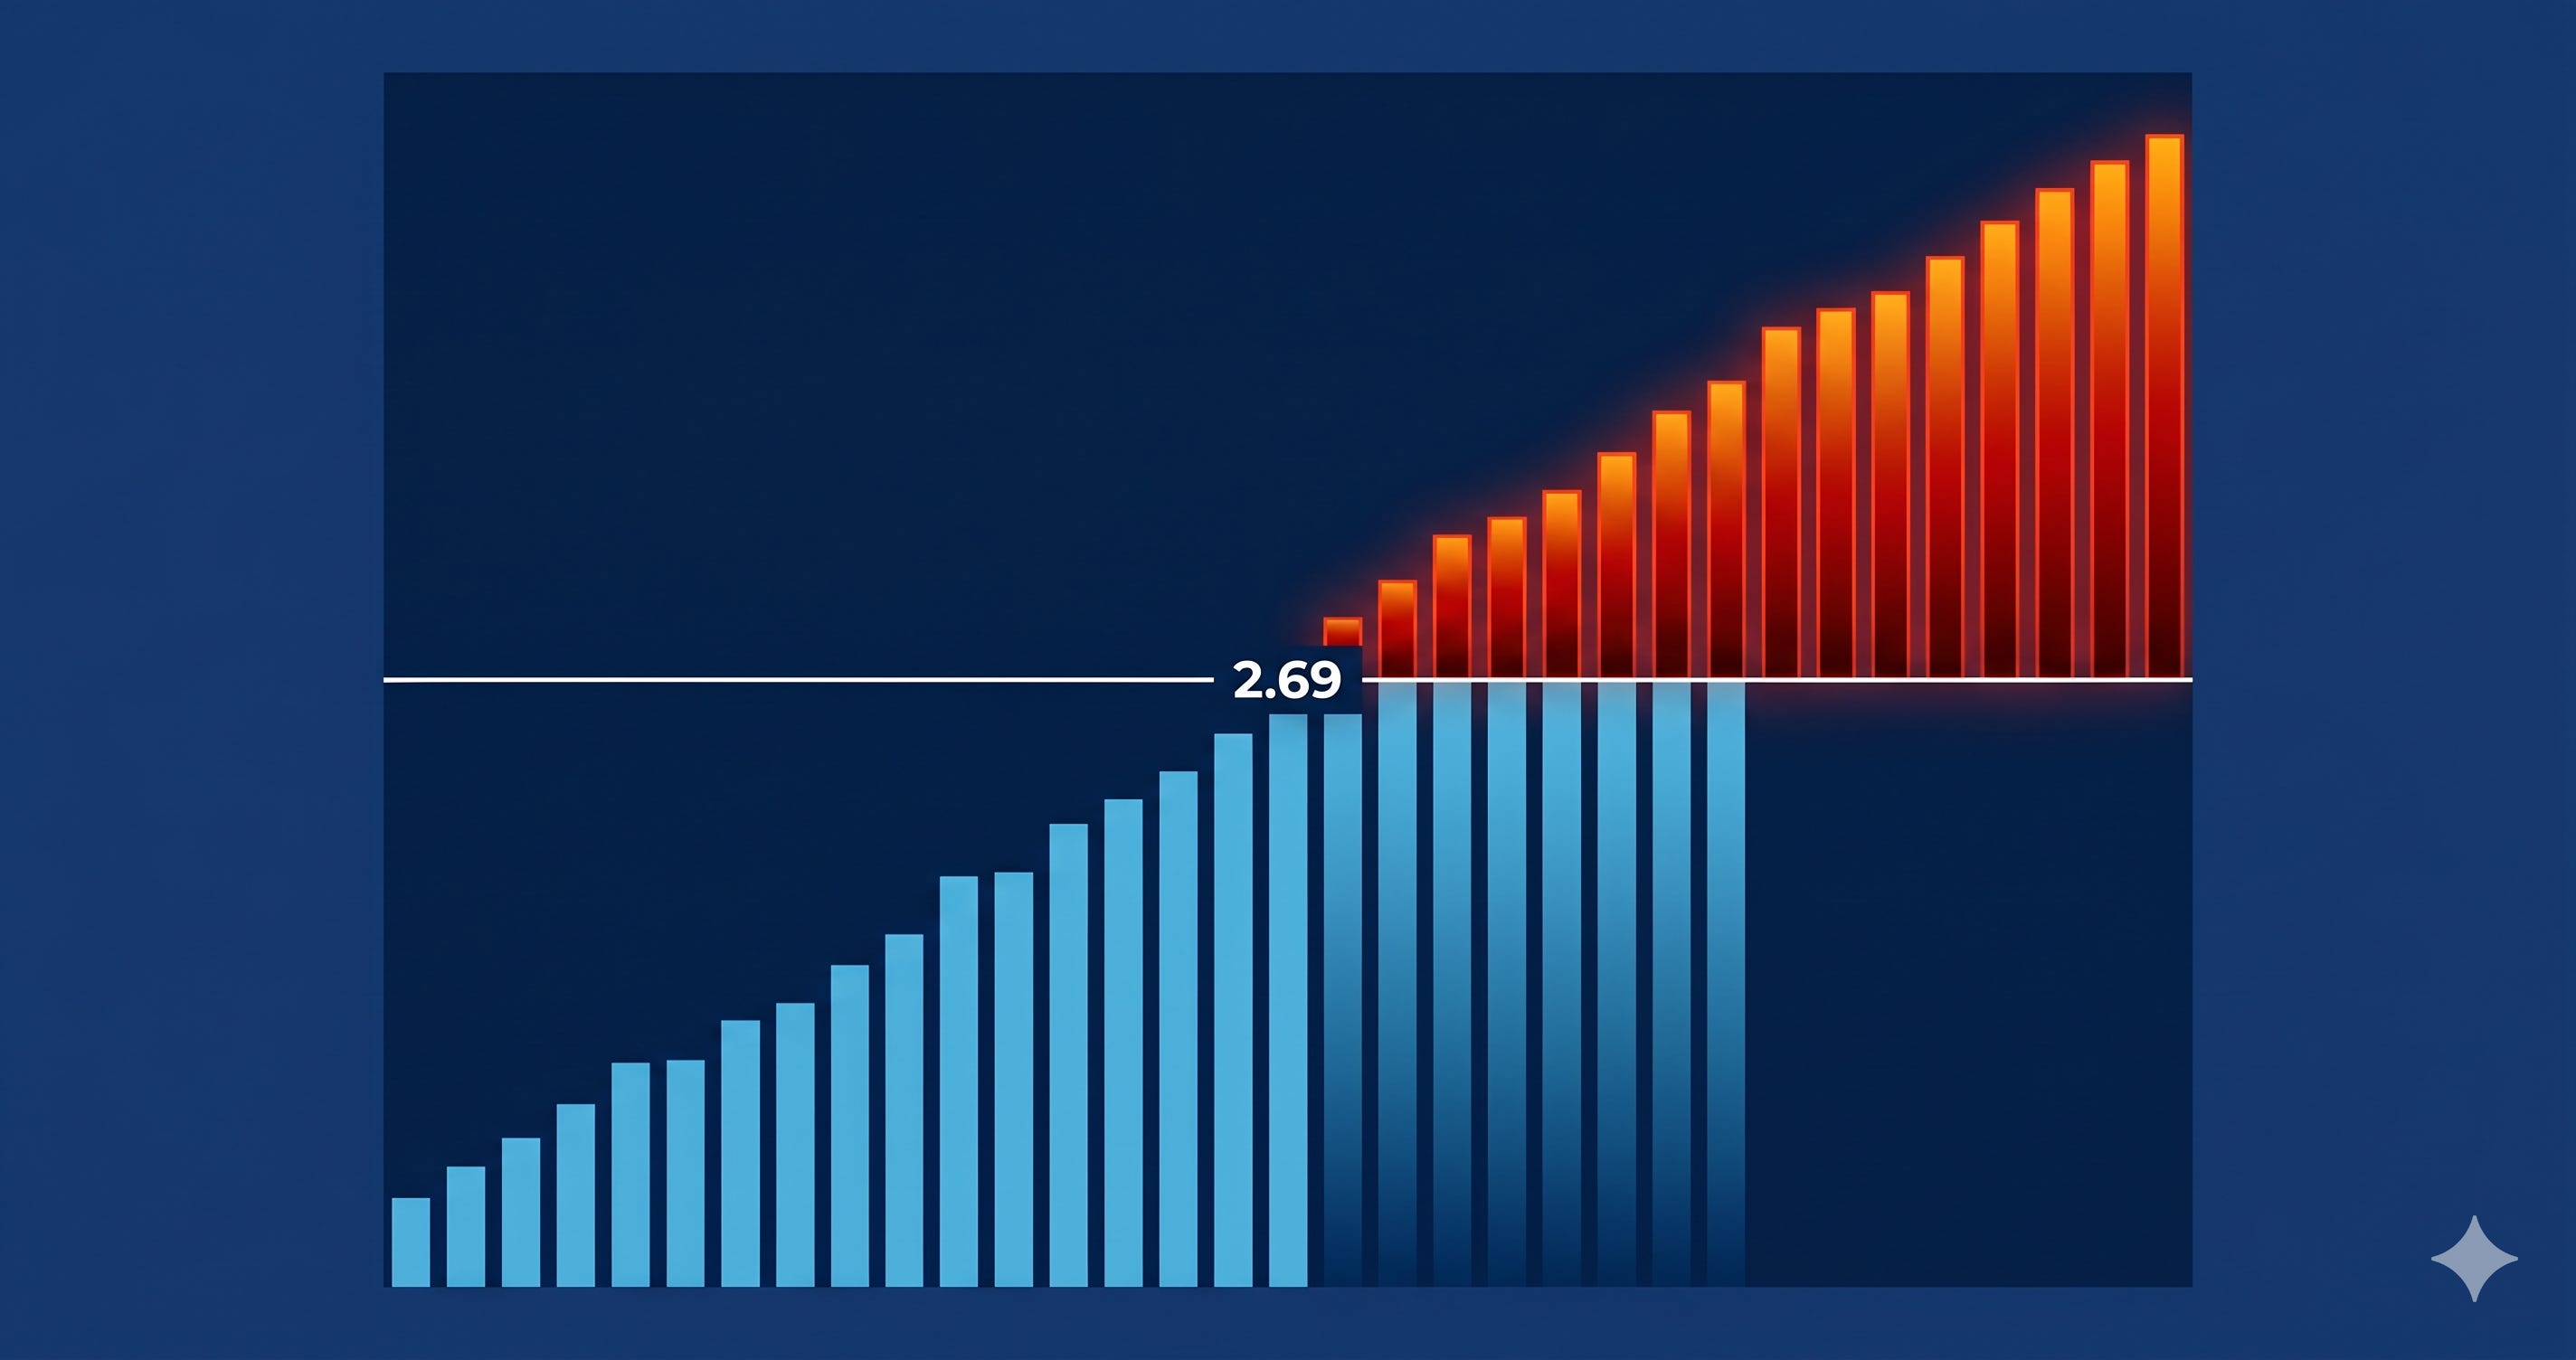
AI-illustration: The Most Expensive Recovery
In brief: Zambia is buying back its 0.5 per cent restructuring bond, the cheapest debt on its balance sheet, before a recovering economy pushes the Composite Indicator across the 2.69 threshold that would trigger a far more expensive upside case. The transaction is rational only against that upside. Against the base case it destroys value, because nothing replaces 0.5 per cent debt cheaply. The same recovery that builds reserves and strengthens the kwacha is activating the trigger and compressing kwacha fiscal revenue at once. The Republic draws down roughly USD546.6m in present reserves to insure against an upside that would cost USD586m more than the base case, undiscounted, mostly between 2031 and 2035. Discounted honestly, that premium is thinner than it looks, and the case for paying it rests entirely on whether the trigger fires. June decides the near term: the tender resolves by 15 June, and the 26 June bond auction is the most important single read left on the domestic programme this year.
On 4 June, the Republic of Zambia published an amended tender offer on the London Stock Exchange. The document confirmed the Composite Indicator score for the January to June 2026 semi-annual assessment at 2.60, below the 2.69 threshold that would support a reclassification of Zambia’s debt-carrying capacity from “weak” to “medium.” The reclassification is an IMF judgement, not an automatic output of the CI score, though under the LIC-DSF the classification has typically tracked the CI indication. Two consecutive semi-annual DCC assessments at “medium” between January 2026 and December 2028 would irrevocably activate the upside case on Bond B under the bond terms. One day earlier, Fitch Ratings had reconstructed the same indicator at exactly 2.69 using April 2026 World Economic Outlook data. The current gap is driven by WEO vintage: Fitch used the April 2026 projections, the tender used older data. The government’s own characterisation of the CI as “imperfect and infrequently published” is an attempt to introduce uncertainty about a pathway that the arithmetic makes structurally likely.
The buyback was launched on 29 May, five days before the Fitch publication. The Republic is offering to repurchase the full USD1.365bn of its Fixed Rate Step-Up Amortising Notes due 2053, financed by a USD600m concessional loan from the African Development Bank and its own resources. The objective is to retire the instrument before sustained improvement in the Composite Indicator supports an IMF reclassification to “medium” for two consecutive semi-annual assessments. Under the upside case, the coupon eventually reaches 7.5 per cent on a principal that has been grown by four years of 6 per cent capitalisation, and maturity accelerates from 2053 to 2032-2035. Table 1 shows the annual cash flow profile under both cases.
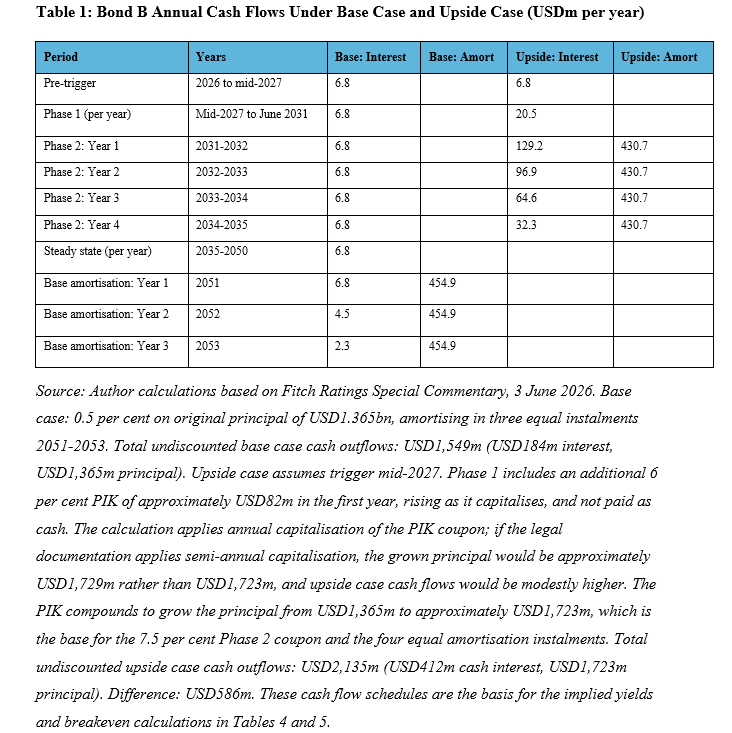
The contrast is in the timing. Under the base case, the Republic pays USD6.8m per year for 25 years and returns the original principal in 2051-2053. Under the upside case, annual cash outflows peak at USD560m (interest plus amortisation combined) in the first year of Phase 2, and the bond is fully repaid by 2035. The undiscounted difference: USD586m.
The recovery that builds reserves, strengthens the kwacha, and lifts the headline narrative is the same recovery pushing the CI toward the trigger. The government is not buying back the bond because the economy is deteriorating. It is buying it back because the economy is improving.
1. What the Transaction Actually Finances
Three sources characterise the transaction differently. The Ministry of Finance press release (31 May) described it as “the first-ever debt for development swap focused on the energy sector” and separately referenced investment “in the national electricity distribution network” through the Grid Resilience Programme. The LSE tender document (4 June) is narrower: it commits USD275m “to improve reliability and affordability of electricity through a Grid Resilience Programme over the next 15 years.” Fitch (3 June) addresses the buyback mechanics and the DDE determination but says nothing about the programme’s scope. The MoF says “distribution network.” The LSE says “electricity.” Neither specifies the assets.
The energy component is a Grid Resilience Programme of USD275m over 15 years. That is USD18.3m per year, the binding operational figure. Distribution infrastructure typically includes poles, transformers, substations, and transmission lines. For a household on a distribution-constrained feeder in Kafue or Kapiri Mposhi, reduced losses can mean the difference between eight and twelve hours of supply per day. That recovers effective capacity without building new generation. Zambia’s distribution losses are high by regional standards. Reducing losses by even a few percentage points across the network recovers meaningful effective capacity. Distribution reliability, loss reduction, and network reinforcement deliver measurable welfare and productivity gains even where they do not add firm power. They are real returns on real investment, and the programme would be defensible at its actual economic value. The headline overstates the commitment, which weakens the credibility of the development case rather than strengthening it.
GreenCo Power Services, the designated coordinator, is contributing on a corporate social responsibility basis. It is not disclosed as a direct generation investment, and the commercial return mechanism has not been published.
The AfDB’s concessional lending mandate requires a development component. A pure liability management operation would not qualify for the terms this facility carries. The AfDB facility of USD600m finances the buyback in full. The Republic has pledged to invest USD275m from the debt-service savings into the Grid Resilience Programme over 15 years. The development commitment enables the concessional terms. The concessional terms make the buyback executable. The AfDB has set a price ceiling: any increase in the tender consideration above the current range would reduce the savings below the level required to finance the programme. Above that level, the AfDB has advised it would no longer be able to provide the loan. The price ceiling also disciplines the sovereign against overpaying and protects the development envelope, a feature of the concessional design.
The tender requires at least 75 per cent participation to activate the clean-up call provision. If exercised by the issuer, the call would compel redemption of all remaining notes. The call is not automatic: its exercise and any legal challenge by the blocking minority would determine whether remaining holders are bought out. The AfDB’s support is contingent on full refinancing. Below 75 per cent, the entire transaction fails, including the Grid Resilience Programme.
An ad hoc creditor group, advised by Cleary Gottlieb Steen and Hamilton, issued a statement on 30 May describing the tender terms as “materially adverse” to noteholder interests and criticising the government for proceeding without prior consultation (Bloomberg, 1 June 2026). By 1 June, the group held more than 25 per cent of outstanding notes, a position sufficient to block collective action clause modification and, by withholding participation, to prevent the 75 per cent clean-up call threshold from being reached. By 3 June, the group and the government, advised by Lazard and White and Case, were moving toward non-disclosure agreements for confidential negotiations (Bloomberg, 3 June 2026). The amended tender, published the following day, added USD65m in pooled early tender fees.
At 75 per cent participation, the pooled fee adds approximately USD63.50 per USD1,000 for a total consideration of approximately USD844. At full participation, it adds approximately USD47.62 for a total of approximately USD828. The midpoint is USD836. The government characterised the amended offer as final (Bloomberg, 4 June 2026). The early tender deadline is 9 June. With a blocking minority assembled and the clean-up call threshold unmet, the standoff is likely to resolve on price.
Two disclosures in the tender document matter. The government describes the CI as “an imperfect and infrequently published indicator” and acknowledges that the contractual terms of the Notes are “ambiguous.” Whether this reflects strategic positioning or standard liability limitation language, the record exists. Separately, the government encourages tendering noteholders to contact Citigroup about “a potential new notes offering,” signalling an intention to return to international capital markets after the August election and IMF consultations in the second half of 2026.
The savings arithmetic does not survive scrutiny. The USD275m Grid Resilience Programme is funded from the debt-service savings the buyback generates over 15 years. Those savings are gross, nominal, and undiscounted. At the government’s marginal domestic borrowing cost of 17.5 per cent (the 15-year bond yield), the present value of USD18.3m per year for 15 years is approximately USD95-100m. At a 10 per cent USD discount rate, it is approximately USD139m. Either figure is substantially below the USD275m headline. The savings are also net of nothing. If Bond B holders rotate their USD proceeds into kwacha bonds at 17.5 per cent, the government adds new domestic debt service that did not exist before the buyback. The “saving” from retiring Bond B is consumed by the cost of whatever replaces it.
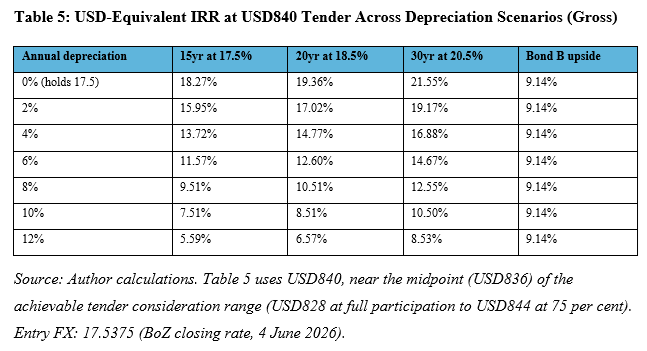
The Citigroup reference reveals the government’s implied expectation about replacement financing. At USD840, Bond B’s upside case delivers an implied yield of 9.14 per cent from the bondholder’s perspective (Table 5). A new Eurobond only improves the government’s debt service position if it prices below that threshold.
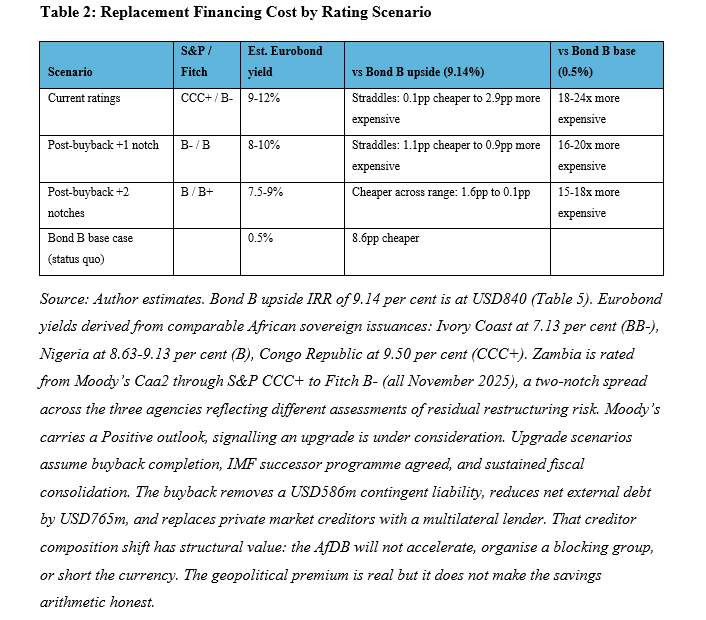
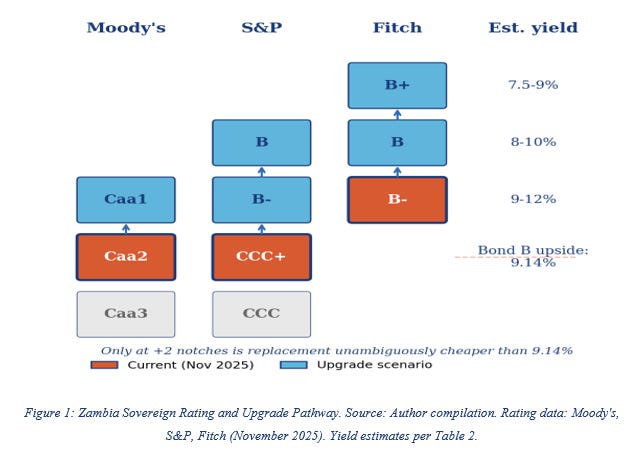
The table carries a structural finding. Only at a two-notch upgrade is replacement financing unambiguously cheaper than the upside case across the full range. At one notch, the range straddles 9.14 per cent. At current ratings, the upper end is materially more expensive. The government is betting that the buyback itself improves the credit profile enough to push the replacement yield below 9.14 per cent. The buyback triggers the upgrade. The upgrade enables cheaper replacement financing. The cheaper financing validates the buyback. If any link breaks, the chain does not close and the replacement costs more than what it replaced. Against the base case, no scenario closes. Bond B at 0.5 per cent is the cheapest sovereign debt on Zambia’s balance sheet. Any replacement, at any rating, at any tenor, is an order of magnitude more expensive. The replacement-cost arithmetic, not the development label, is where the transaction has to be judged. The verdict is conditional. Against the base case the buyback destroys value. Against the upside it is rational insurance. The question reduces to which counterfactual binds.
The displacement is not incidental. A system that prices concessional capital off labels rather than off delivered capacity will route liability management through a development envelope whenever the labels permit it. The label reform the Misaligned Transition series calls for is precisely to prevent this kind of displacement, where the development envelope is consumed by a transaction whose primary purpose is liability management, not energy investment.
The Misaligned Transition series asked whether climate-labelled instruments build the firm power capacity Africa needs to industrialise, and built a taxonomy to separate what the label conflates. This transaction is precisely the kind of case the taxonomy was designed to assess. The Ministry of Finance describes it as a debt-for-energy swap. The LSE tender document references investment in “electricity” through the Grid Resilience Programme; the MoF press release separately describes the programme as investing in “the national electricity distribution network.” The detailed breakdown has not been published.
The designated coordinator, GreenCo Power Services, is Zambia’s first licensed intermediary power trader, established in 2020 under the 2019 Energy Acts and backed by InfraCo Africa, IFU, and GuarantCo. Its public business is purchasing renewable energy from independent power producers and selling to utilities, corporates, and the Southern African Power Pool. It has traded over one terawatt-hour (GreenCo company disclosures). In March 2026, it launched ZamWatt with ZESCO and Stanbic Bank to deploy solar, wind, and hydro with battery storage for commercial and industrial customers. Its public materials present GreenCo primarily as a renewable energy buyer, trader, aggregator, and operational agent, not as a conventional distribution network operator.
The MoF description points to grid infrastructure. The coordinator’s expertise points to renewable energy procurement. These are different functions under the Misaligned Transition taxonomy. If the programme is distribution, it is Grid Finance, not Firm Power Finance, and sits in neither the Growth Lane nor the Resilience Lane, because both lanes deliver generation. If it includes renewable energy procurement, it is closer to Energy Volume Finance. Neither is the firm power that industrialisation requires. Without the programme breakdown, we cannot classify it with precision. GreenCo may hold capabilities or partnerships not reflected in its public materials that would emerge when the programme is detailed. What we can observe is that the description does not reference new generating capacity, and the label “debt for energy” cannot be verified against what has been disclosed.
2. What Moves the Composite Indicator
The CI is a weighted composite of six variables, each measured as a 10-year average blending five years of history with five years of World Economic Outlook projections. The threshold separating “weak” from “medium” debt-carrying capacity is 2.69. The CI informs the classification but the IMF retains discretion in the final debt-carrying capacity assessment. The DCC assessment also incorporates debt burden indicators and assumptions about market access, both of which the LIC-DSF framework evaluates alongside the CI. The aggregate tendency under the framework is for the classification to track the CI, but the country-level rationale for any departure is not published, so the second layer carries genuine uncertainty rather than a mechanical pass-through. The essay treats the DCC classification as conditional on the CI crossing, not determined by it.
Fitch’s reconstruction at 2.69 decomposes as follows.
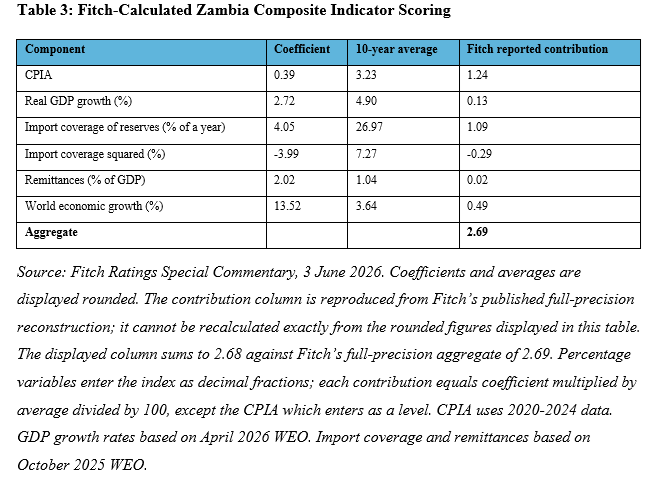
Three layers separate the CI score from the bondholder outcome. First, the CI score itself: a computed number from six variables, currently at 2.60 (LSE tender document), projected at 2.69 under the April 2026 WEO (Fitch). Second, the DCC classification: the IMF uses the CI score to inform its debt-carrying capacity assessment but retains discretion, while the classification has typically tracked the CI under the framework. A CI at or above 2.69 supports a “medium” classification; it does not compel one. Third, the bond trigger: two consecutive semi-annual DCC assessments at “medium” between January 2026 and December 2028 irrevocably activate the upside case. The CI decomposition in Table 3 is sourced from Fitch’s published commentary (3 June 2026). The bondholder decision framework, the fiscal compression mechanism, the reserve analysis, the yield curve construction, the breakeven and after-tax tables, and the rotation thesis are independent of Fitch’s assessment. Fitch independently concluded that the DCC classification is likely to be raised in 2026, 2027 or 2028, driven by the same variables this section identifies: import coverage and GDP growth. The convergence on the directional conclusion is structural, not derived.
The CPIA contributes 1.24 and is based on the most recent available historical data. World economic growth contributes 0.49 and is entirely exogenous. Remittances contribute 0.02 and are negligible. GDP growth contributes 0.13. The coefficient of 2.72 applied to a 10-year average means any single year moves the CI by approximately 0.003 per percentage point of growth. At the boundary, this matters, but the mechanism is arithmetically constrained. Q4 2025 GDP printed at 1.6 per cent, and institutional scepticism about that figure extends beyond analytical commentary. The question is legitimate. The law of averages limits how far it can be pushed.
Import coverage is the primary channel for future Zambia-specific CI movement. The linear term carries the largest positive coefficient at 4.05, contributing 1.09. The squared term subtracts 0.29, giving a net contribution of 0.80 out of 2.69. The relationship is concave. Zambia’s 10-year average import coverage, the figure that enters the CI, sits at approximately 3.2 months (26.97 per cent of a year), well below the level where additional reserves stop contributing to the score, even though current gross cover stands above five months. The score responds to the blended average, not the spot position. Other components, particularly world economic growth projections, also shifted between WEO vintages, but import coverage carries the largest positive coefficient and is the only component trending structurally upward on Zambian-specific data.
The rolling window makes this concrete. For import coverage, the October 2025 WEO window runs from 2021 to 2030 (five years of history, five of projections). The next assessment, using the October 2026 WEO, shifts the window to 2022-2031. When 2021 exits the window, Zambia’s crisis-era import coverage of approximately 20 per cent of a year (reserves approximately USD1.5-2.0bn) is replaced by a 2031 projection of approximately 35-40 per cent. Simultaneously, 2026 import coverage updates from a WEO projection to an actual that is likely to exceed what was forecast, given reserves above USD6bn and the kwacha appreciation potentially compressing the import denominator as the rolling average exchange rate adjusts. At the margin, each percentage point increase in the 10-year average adds approximately 0.019 to the CI net of the squared term. Each rolling cycle contributes approximately 0.04-0.05 to the CI from import coverage alone. GDP growth contributes approximately 0.01 per cycle.
The channel runs through reserves and the import denominator. Import coverage equals reserves divided by rolling imports. Reserves peaked at USD6.5bn in February 2026, the highest in Zambia’s history. The kwacha appreciation may also compress the import denominator, but with a lag: the 12-month average exchange rate is estimated at approximately 21.6, not the current 17.5. As months at 18-19 replace months at 23-25 in the rolling window, the denominator shrinks further and import coverage rises. The CI absorbs these changes through WEO data vintages, not in real time. Each semi-annual assessment uses the latest available WEO.
The upside case can also trigger through a second path: if the three-year average of both USD export receipts and USD fiscal revenue outperforms the IMF’s December 2023 second review projections. Fitch’s own data shows actual exports undershot those projections in both 2023 and 2024, while fiscal revenue outperforms in US dollar terms due to the exchange rate effect. The trigger requires both conditions simultaneously. With exports running below forecast, the CI remains the binding path.
The second CI assessment (July to December 2026) will use the October 2026 WEO. If three-month LME copper holds above USD12,000 per tonne, reserves hold above USD6bn, and the kwacha remains in the 17-20 range, the CI is likely to test the 2.69 boundary in later assessments. If three-month LME copper falls below USD12,000 or reserves stall, the trajectory delays and the buyback arithmetic shifts in the government’s favour. A second consecutive DCC classification at “medium” would activate the upside case irrevocably.
3. The Bondholder’s Decision
If the tender reaches at least 75 per cent and the issuer exercises the clean-up call, the remaining notes are redeemed. Bond B ceases to exist as the relevant exposure. The question becomes what tendering holders do with the cash. Tendering waives all future claims against the issuer, including any challenge to the trigger determination or the clean-up call exercise. Holding preserves them.
This is not a like-for-like comparison and should not be read as one. Bond B is external sovereign credit in US dollars, settled through Euroclear. Kwacha bonds add currency, liquidity, custody, settlement, and repatriation risk. The comparison that follows is an opportunity cost screen, not a trade recommendation. Mandate constraints may prevent some holders from rotating into local currency regardless of the return profile.
The opportunity cost is what the holder forgoes. Under the upside case (assuming the trigger fires mid-2027 after two consecutive DCC assessments at “medium”), Bond B pays a 1.5 per cent cash coupon plus 6 per cent capitalised coupon until June 2031. From June 2031, the coupon rises to 7.5 per cent on the grown principal, with amortisation in four equal instalments across 2032-2035. The principal compounds to approximately USD1,262 per USD1,000 notional by June 2031. Total undiscounted cash return over nine years: USD1,564. The structure is deeply back-loaded: the holder receives only USD65 in cash over the first five years before the amortising payments begin in year six.
The implied yield forgone depends on the exit price. At USD840, the implied yield is 9.14 per cent in US dollars. At USD900, it is 8.07 per cent. Modified duration is approximately 6.71 years, driven by the back-loading. This metric is used here as a measure of cash flow timing; Bond B’s amortising structure with PIK capitalisation is fully reflected in the 6.71-year calculation, which uses the actual semi-annual cash flow schedule. If the trigger fires later than mid-2027, Bond B’s implied IRR falls to approximately 8 per cent at mid-2028 and 7 per cent at mid-2029. The holder sits through additional years at 1.5 per cent cash before the 7.5 per cent phase begins. The base case assumption of mid-2027 is the most conservative for the rotation comparison.
The tender settles on or about 15 June. The next bond auction falls on 26 June. The bondholder who wants to maintain Zambia exposure has a specific entry window: eleven days between cash in hand and the first available kwacha instrument.
The natural comparison is a kwacha government bond of comparable duration. At April 2026 auction yields, the 15-year at 17.50 per cent has a modified duration of 5.25 years, the closest available match. The gap of 1.46 years reflects the high coupon: at yields above 17 per cent, semi-annual coupon payments compress duration. The observed curve slope between the 10-year and 15-year tenors is approximately 20 basis points per year (BoZ Bond Tender 04/2026/BA, 24 April 2026). Extrapolated linearly, a hypothetical 20-year par bond at 18.50 per cent delivers a modified duration of 5.25 years. A 30-year at 20.50 per cent delivers 4.86 years. These instruments do not exist in the Zambian market, and their yields, durations, and breakevens are indicative estimates, not observed prices. If the curve flattens above the 15-year rather than extending linearly at 20 basis points, the 20-year and 30-year yields would be lower and the breakeven advantage would narrow. At these yield levels, extending tenor adds yield but not duration: the higher coupon compresses the weighted average life of cash flowss.
The 15-year is the actionable instrument. It is the longest tenor currently available in the Zambian government bond market. Bond B interest is paid gross through international clearing systems, consistent with Bond A from the same restructuring and standard USD sovereign Eurobond convention. Kwacha bond coupons are subject to withholding tax: 20 per cent plus a 1 per cent handling fee for non-resident holders, applied at source on kwacha coupon payments before conversion. This is reducible to approximately 11 per cent under double taxation agreements, typically 10 per cent on interest income plus 1 per cent handling fee. This tax asymmetry is the reason the instrument choice matters: Table 6 shows the after-tax comparison across depreciation scenarios from zero to 12 per cent, spanning the 2-5 per cent central corridor and the stress cases beyond it. The 20-year and 30-year, if launched at the 26 June auction, would extend the rotation thesis. At full withholding and 4 per cent depreciation, the 20-year at 18.50 per cent returns 10.7 per cent and the 30-year at 20.50 per cent returns 12.4 per cent, against Bond B's 9.1 per cent. At 8 per cent depreciation both fall below Bond B, to 6.6 and 8.2 per cent. Tables 4, 5, and 6 present the full comparison.
The decision boundary at USD840 is 8.36 per cent annual depreciation: below this rate, the 15-year outperforms Bond B on a gross basis. The 20-year pushes the boundary to 9.36 per cent. The 30-year to 11.37 per cent. The scenario corridor of 18-20, derived from fiscal breakevens and BoZ intervention patterns (“The Forecast Is Not the Evidence,” March 2026), implies annual depreciation of 2-5 per cent from the current 17.5. This is a central-case scenario, not a stress test: historical realised kwacha volatility over the past twelve months has been approximately 25-30 per cent annualised, and a kwacha that averages 19.2 but swings between 15 and 25 creates different risk from one that drifts steadily. Volatility around the path imposes liquidity and repatriation costs on the kwacha leg that these tables do not price.
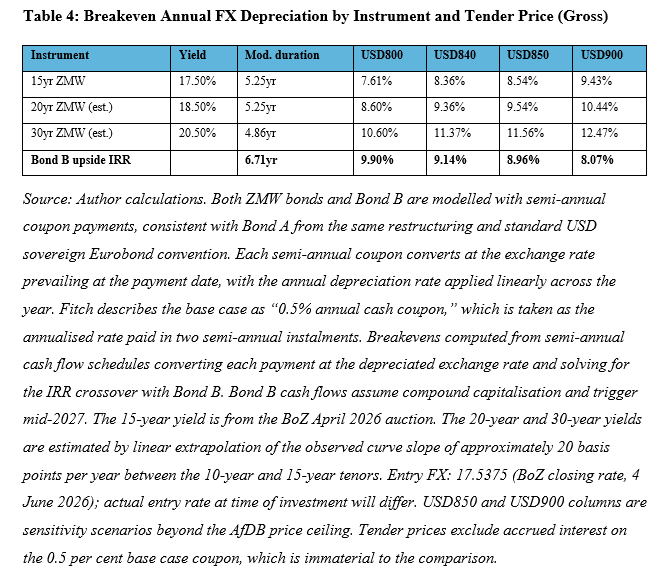
Table 5 shows the opposite view: for a given rate of annual depreciation, what return in US dollars does each instrument deliver? The Bond B column is constant because the upside cash flows are denominated in US dollars and unaffected by the kwacha. The kwacha bond returns fall as depreciation rises because each coupon converts to fewer dollars.
Tables 4 and 5 present gross yields. Bond B interest is paid gross. Kwacha bond coupons are not. Table 6 applies the tax friction. Bond B is unaffected by withholding tax because it pays through international clearing systems under standard Eurobond provisions.
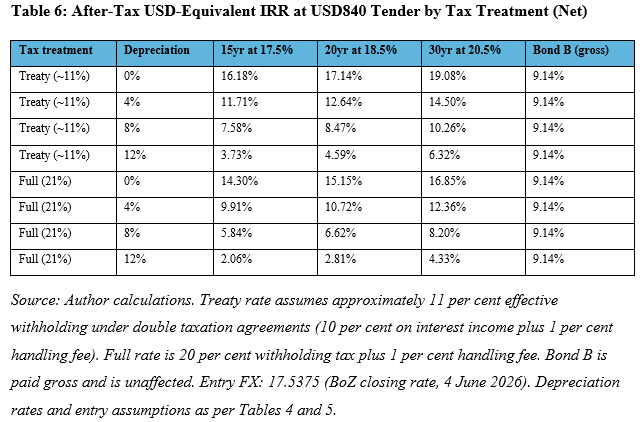
The bottom half of Table 6 is where the rotation thesis meets its test. At full withholding, the 30-year is the only kwacha instrument that stays close to Bond B as depreciation rises, holding above it out to about 7 per cent before falling just below at 8 per cent, where it returns 8.2 per cent against Bond B's 9.1 per cent. The 15-year and 20-year cross below Bond B much earlier, at roughly 4.7 and 5.5 per cent depreciation. The 15-year margin over Bond B at 4 per cent depreciation is less than one percentage point and disappears entirely by 8 per cent. Treaty holders fare better: under relief the 30-year stays above Bond B at 8 per cent, at 10.3 per cent, though the 15-year still falls below Bond B at that rate. The after-tax comparison is where Bond B's advantage concentrates, and the depreciation assumption is where the rotation thesis lives or dies.
The front-loading advantage reinforces the case. Bond B upside delivers USD65 in cash over five years before the amortising payments begin. A kwacha bond at 17.5 to 20.5 per cent delivers immediate income from settlement.
The government planned to launch a 20-year benchmark bond in January 2026 as signalled through its market engagement programme. The launch was deferred. The BoZ March restructuring designated 7, 10, and 15-year benchmarks but excluded the 20-year. Switch auctions, committed in the 2026 Annual Borrowing Plan with modalities scheduled for announcement in June per the BoZ March notice, have not been announced. If the 20-year or a 30-year launches at the 26 June bond auction, it creates a natural landing instrument for holders who tender and want to maintain Zambia exposure. The 20-year and 30-year results in Tables 4 and 5 are conditional on issuance at or near the estimated yields. If neither launches, the 15-year remains the closest fit.
If the tender fails to reach 75 per cent, Bond B remains outstanding and the CI trajectory does not change. The government would face the full cost of the upside case, and the creditor group’s negotiating leverage increases with every assessment that pushes the score closer to 2.69. For holders who believe the trigger will fire and the blocking group can prevent 75 per cent participation, the rational play is to hold: at current secondary market prices in the mid-80s, the implied return to the full upside case exceeds what the tender offers. The creditor group’s blocking position is not just a price negotiation. It is a bet on the macro trajectory the essay describes.
4. The Fiscal Reality
The recovery is real. Three-month LME copper trades above USD13,800 (LME, 4 June 2026). Mining sector FX receipts reached USD915.7m in Q1 2026 (Bank of Zambia, Governor’s Media Presentation, May 2026, slide 11). Gross reserves peaked at USD6.5bn in February, the highest in Zambia’s history. Net international reserves sit at an estimated USD3.5bn or above. Inflation fell to 6.6 per cent in May, inside the Bank of Zambia’s 6-8 per cent target band. The headline is underpriced by the fuel tax suspension, which removed a significant cost component from the index. The kwacha appreciated 14.8 per cent over Q1 on a period-average basis and a further 0.8 per cent in April (slides 9-10); on a point-to-point basis the year-to-date appreciation reached approximately 14.5 per cent by 11 May, making it one of the world’s best-performing currencies in 2026. Fitch rates Zambia at B- with a Stable outlook (November 2025). S&P rates Zambia CCC+ with a Stable outlook (November 2025). The credit upgrade trajectory is intact.
The fiscal stress is also real. The deficit in the first two months consumed 40 per cent of the annual target. Q1 fiscal front-loading is typical in Zambia (agricultural input subsidies, FRA advance payments, and capital project mobilisation concentrate in Q1), but the 40 per cent consumption rate exceeded the budgeted quarterly profile. The supplementary budget added K7.5bn in net domestic borrowing, raising the annual programme to K29.1bn. The April bond auction attracted bids for 43 per cent of the amount offered; the government allocated 20 per cent, rejecting higher-yielding bids, then tabled the supplementary six days later requesting K7.5bn in additional borrowing from the same market. Grants ran at K789m against K2.4bn projected. The Food Reserve Agency committed purchases of 1.67m MT against 543,000 planned, creating K5bn in commercial loans and K3.3bn in unfunded arrears. The fuel tax suspension removed ZMW3.3-4.6bn in revenue while dollar outflows for fuel imports continued (Secretary to the Treasury, April 2026 stakeholder presentation; Supplementary Estimates No. 1 of 2026). These figures are documented in “Seven Stars That Refuse to Align” (13 May 2026). That piece was explicit on causation: the supplementary invited attribution to the Iran war, but the composition did not support it as a direct cause. The war determined when the supplementary arrived, not what it contained. The budget was prepared while the IMF programme anchor was still active. The supplementary arrived after the programme ended. That timing does not prove causation, but it changes how markets read fiscal slippage. The timeline was three months.
The exchange rate is where the tension sits. FX receipts are strong. The kwacha is strong. Fiscal revenues in kwacha are compressing. All three statements are simultaneously true. Mining sector dollars flow into reserves and strengthen the currency. The same dollars, when converted to kwacha at 17.5 instead of 25.2 (the 2025 BoZ annual average), generate fewer kwacha of royalties, customs duties, and import VAT. The ZamStats May 2026 trade report confirms this directly. Refined copper export earnings in kwacha fell from approximately K20.2bn in January to approximately K17.3bn in April 2026, despite LME copper averaging above USD12,000 per tonne through Q1 and into April (USD12,499 in March, USD12,891 in April; ZamStats). In US dollar terms, the same exports were stable at approximately USD1bn per month through Q1. The compression is entirely an exchange rate effect. Total trade in kwacha terms ran below 2025 levels for every month from January to April, despite higher commodity prices.
The compression matters because the obligations it must service are kwacha-denominated. Public-sector wages, the Food Reserve Agency commitment, and the domestic borrowing programme of K29.1bn are paid in kwacha from a revenue base that is shrinking while those obligations are not. USD debt service is covered by USD receipts. The domestic budget is squeezed by the same appreciation that flatters the external accounts. Import expenditure in kwacha also compresses under appreciation, but with a lag as procurement contracts reprice. The near-term fiscal gap is real. The medium-term offset is probable but not yet reflected in the data.
The royalty arithmetic shows exactly how wide the gap is. Mineral royalty revenue is a function of production, price, and the exchange rate at which dollar receipts convert to kwacha. Table 7 isolates the exchange rate effect.
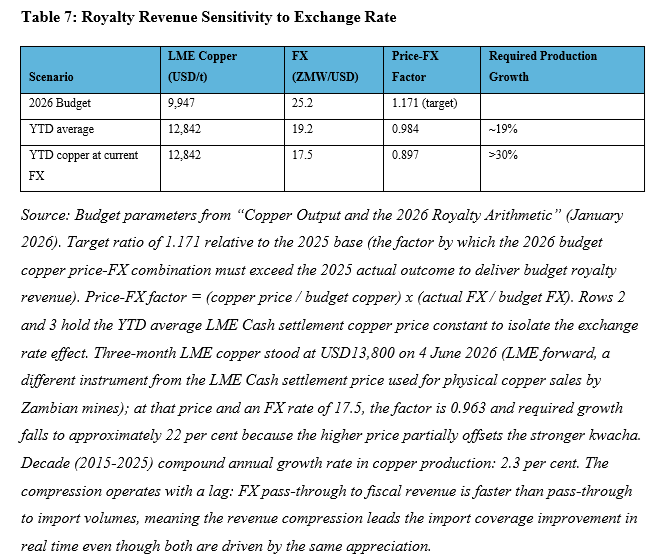
At the year-to-date average copper price and the current exchange rate, the gap is wider than the decade production growth rate can close. Even at the current three-month LME forward of USD13,800, the required growth of approximately 22 per cent is ten times the decade average. We operate inside these economies. The distance between the macro headline and the lived fiscal pressure is not abstract.
The Composite Indicator benefits from the same dynamics that degrade the fiscal base. Reserve accumulation lifts import coverage, pushing the CI toward the trigger. The kwacha appreciation compresses kwacha revenues, widening the fiscal gap. The “own resources” committed to the buyback draw from the same external balance sheet that the recovery is strengthening, while the domestic budget faces a kwacha revenue squeeze from the same appreciation.
5. The Medium-Term Outlook
The government has signalled an intention to negotiate a successor IMF programme in the second half of 2026, focused on growth. Some fiscal stress will transfer to taxpayers under any credible consolidation path. The buyback reshapes the balance sheet but does not simplify the fiscal position.
At USD840, the buyback costs approximately USD1.146bn. The AfDB provides USD600m, disbursed at or before settlement, which the tender document conditions on the AfDB loan drawdown. The Republic must find approximately USD546.6m from its own resources. That payment settles in USD through Euroclear. Kwacha cannot fund it. Mining sector taxes are payable in USD and flow into the BoZ reserve stock, so the “own resources” are a drawdown on accumulated reserves. USD546.6m is the maximum possible reserve drawdown. Two factors could reduce it. First, if bondholders who tender convert their USD proceeds to kwacha and purchase domestic bonds, the resulting USD supply in the FX market allows the BoZ to replenish part of the drawdown through purchases. If rotation offsets a quarter to a half of the drawdown, approximately USD140-280m re-enters the market, within the K12.5bn (USD713m) Q1 absorption capacity the BoZ demonstrated. Second, any additional concessional USD funding would offset the reserve cost directly. The tender document says “own resources” without specifying the source.
The external balance sheet improves regardless of how the rotation plays out. The Republic retires USD1,365m in Bond B obligations and adds USD600m in AfDB concessional debt, a net reduction of USD765m in external liabilities. The AfDB loan carries a lower interest rate and a longer maturity than Bond B under either case. Under the upside case (which the buyback is designed to avoid), the total undiscounted cost of Bond B would have been USD2,135m over nine years. The buyback cost of USD1,146m represents an undiscounted saving of approximately USD989m against that counterfactual. If the trigger never fires, the base case cost would have been USD1,549m over 27 years, and the buyback was an insurance premium: the reserve drawdown and the AfDB service cost are the price of eliminating the contingent liability.
Reserves ended Q1 at USD6.2bn, equivalent to 5.2 months of import cover (Bank of Zambia, Governor’s Media Presentation, May 2026, slide 15). That stock was built from USD5.5bn at end-December, a USD700m increase. The Bank of Zambia was a net buyer of USD196.94m during the quarter (slide 13), absorbing dollars from the market to build reserves and moderate exchange rate volatility. Mining sector total foreign exchange supply to the market reached USD915.7m: USD626.0m in net commercial bank purchases from mines and USD289.7m in mining tax remittances to the Bank of Zambia (slide 11). Foreign financial institutions contributed a further USD542.3m (slide 12). The current account shifted to a surplus of USD0.4bn from a deficit of USD0.6bn in Q4 2025 (slide 16). The reserve stock peaked at USD6.5bn in February before declining in March, which the BoZ attributed to government payments related to fuel procurement (USD114.7m), Bank of Zambia market support (USD106.5m), and government debt service (USD40.1m) (slide 15). These Q1 inflows were exceptional. The ECF programme has ended. No further IMF disbursement is scheduled. April and May trade data suggest a continued but narrower surplus, with copper export earnings in kwacha declining despite stable USD receipts.
The end-May reserve position is not published. The Q1 build of USD700m was exceptional: mining supply, foreign financial institution inflows, and a current account that swung into surplus combined against outflows concentrated in a single month, and that combination does not recur monthly. With the ECF ended and no further IMF disbursement scheduled, the narrowing surplus and continued fuel outflows leave the April-May trajectory close to flat. The lower anchor holds reserves near the Q1 close of USD6.2bn; the upper anchor, where mining supply sustains near the Q1 rate and the surplus persists, builds the stock modestly. The working range is USD6.1-6.4bn, an estimate bounded by those anchors, not a reported figure. The Q1 outflow average of USD87m per month (USD261.3m across the quarter, concentrated in March) is conservative in one direction: actual January-February outflows were likely lower than the March-concentrated figure, which would raise the estimate. It is aggressive in another: if March-level fuel or debt service outflows repeated, the lower bound would fall.
At settlement in mid-June, the maximum USD546.6m drawdown would reduce reserves to approximately USD5.55-5.85bn. At the BoZ’s reported ratio of USD1.19bn per month of import cover, that translates to approximately 4.7-4.9 months. The lower bound sits near the December 2025 stock of USD5.5bn (reported as 4.8 months on the then-current import denominator; approximately 4.6 months on the current denominator). Net external debt falls by USD765m while reserves fall by at most USD546.6m. The net improvement in the external position is at least USD218m.
The actual reserve drawdown depends on five flows. First, if Bond B holders rotate their USD proceeds into kwacha bonds, the USD they sell enters the market and the BoZ can purchase it, directly reducing the drawdown. Second, new offshore investors entering Zambian bonds independently of the rotation bring fresh USD and reduce the drawdown further. Third, domestic investors rolling over June maturities (approximately K5,882m per the BoZ auction calendar and Q4 2025 Debt Statistical Bulletin, or USD335m at current rates) do not bring new USD, but they limit repatriation that would otherwise increase the outflow. Fourth, any additional concessional or commercial USD funding secured by the Republic offsets the reserve cost directly. Fifth, if rotation is limited, few new investors arrive, and maturing holders use their proceeds to exit, the drawdown approaches or exceeds the USD546.6m maximum as divestments compound the outflow.
The first two flows are constrained by the structure of the non-resident participation cap. In January 2026, the Bank of Zambia raised the cap on non-resident participation in the primary market from 5 per cent to 23 per cent. The Bank of Zambia described the measure as a “limit on participation of non-resident investors in the primary market” (Governor’s Media Presentation, May 2026, slide 18) without specifying instrument type. The February 2026 MPC presentation was entirely silent on the cap increase (Governor’s Media Presentation, February 2026, slide 17), and the original notice to commercial banks was not published. Published media sources, including Bloomberg, also used imprecise language (“government securities” rather than “bonds”). The IMF Debt Sustainability Analysis is precise: across the Third Review (Country Report No. 2024/190), Fourth Review (Country Report No. 2024/350), and Sixth Review (Country Report No. 26/21), the cap applies to “the face value of gross domestic bonds issuance in the primary market,” established under the OCC restructuring agreement of June 2023. The IMF characterises the measure as a residency-based capital inflow measure, not a holdings ceiling (Sixth Review, page 13, footnote 2). Earlier Canary Compass analysis applied the cap to the full securities programme of approximately K106bn, yielding a cap of approximately K24.4bn (“The Forecast Is Not the Evidence,” March 2026; “Seven Stars,” May 2026). The error arose because the Bank of Zambia’s public language did not specify the base, published media sources followed the same imprecision, and the IMF DSA language was not cross-referenced in earlier analysis. The correct base is the gross primary bond issuance programme of approximately K50.4bn, yielding a cap of approximately K11.6bn. The measure is temporary: the authorities plan to reduce the allocation to 15 per cent of primary bond issuances from 2027.
The cap applies to the primary market. Secondary market purchases are uncapped. Non-resident holdings increased by K12.5bn in Q1 alone (Bank of Zambia, MPC Statement, May 2026). The stock change blends primary and secondary market acquisitions, but the arithmetic suggests that the primary allocation has likely been consumed. For the remainder of 2026, non-resident bond market participation operates through secondary channels: either purchasing from domestic holders’ existing portfolios, or acquiring bonds intermediated by domestic banks bidding at auction in their own name. Both channels are uncapped. Both require a willing domestic counterparty. The rollover mechanics do not change. What changes is the route through which rollover is addressed: primary auction allocation gives way to secondary market intermediation. Table 8 maps the participation constraints and obligation profile.
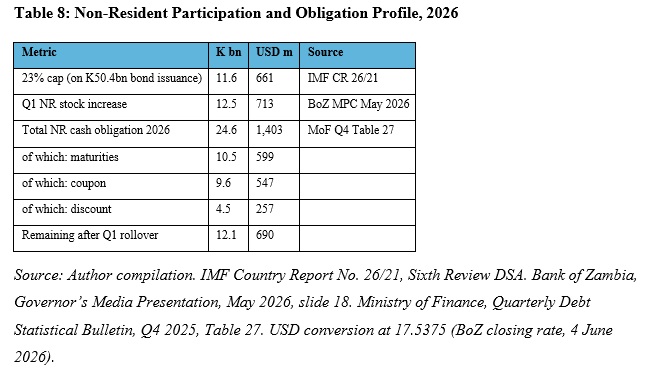
Q1 net purchases of K12.5bn cover the maturity rollover. The remaining K12.1bn comprises coupon and discount payments serviced from revenue, plus any further secondary market activity. The kwacha debt service on any bonds these holders purchase is part of the domestic borrowing programme regardless of who buys them.
Zambia sits on one of the largest copper-cobalt endowments in the world, and the long-term trajectory is credible. But the transmission from headline improvement to household welfare remains the binding constraint. Revenue is not diffusing: wholesale and retail trade contracted 11.2 per cent in 2025 (ZamStats), the PMI has not sustained above 50, and private sector credit growth fell from 15.7 per cent in Q4 2025 to 8.1 per cent in Q1 2026, largely reflecting exchange rate valuation effects on foreign currency loan books (Bank of Zambia, Governor’s Media Presentation, May 2026, slide 17). The copper sector generates the FX receipts, builds the reserves, and strengthens the currency. It does not employ the population at scale or diversify the revenue base. The improvement is genuine at the macro level. It has not yet reached the economy that most Zambians experience. The buyback is a rational response to the trigger. The question is whether the fiscal cost, combined with the revenue compression from the same recovery, leaves the successor programme starting from a position the market can price.
Close
The assumed exchange rate range holds at 18-20 tight. June is the critical month. T-bill auctions fall on 11 and 25 June. The bond auction on 26 June is the most important single test of the domestic programme in the remaining calendar. The market will judge whether the fiscal trajectory since the programme ended reflects short-term election-year pressure that a successor programme can reverse, or a pattern that emerged after the programme ended. The tender resolves by 15 June. The second CI assessment will use the October 2026 WEO, and import coverage, the dominant Zambia-specific variable, is rising structurally as crisis-era data exits the rolling window.
If the trigger never fires, the base case holds, the USD586m difference never materialises, and the government will have incurred USD600m in concessional debt to retire a risk that did not crystallise. The USD546.6m reserve drawdown is present cash. The USD586m it insures against is an undiscounted stream landing mostly between 2031 and 2035. Discounted on the same basis applied to the development savings in Section 1, the present value of avoiding it falls materially below USD586m and approaches the cash outlay itself. The insurance is rational against the upside. The margin is thinner than the undiscounted figure implies. The arithmetic is clear: every sustained gain in import coverage weakens the government’s negotiating position on price. The government is making a rational choice given the arithmetic. This essay assesses that arithmetic.
Sources
The primary transaction documents are the Republic of Zambia, Ministry of Finance and National Planning, “Tender Offer,” London Stock Exchange RNS, 4 June 2026; and the Ministry’s press release, “Zambia initiates a landmark debt-for-energy conversion with the support of the African Development Bank,” Lusaka, 31 May 2026. Fiscal data draws on the Secretary to the Treasury Stakeholder Presentation, Lusaka, April 2026, and the Supplementary Estimates No. 1 of 2026, tabled 30 April 2026. The Fitch assessment is from Fitch Ratings, “Zambia’s Bond Buyback Does Not Constitute a DDE,” Special Commentary, London, 3 June 2026. Creditor group reporting is from Bloomberg (Courcoulas and Hill), “Zambia Creditor Group Challenges $1.36 Billion Bond Buyback,” 1 June 2026, and Bloomberg, “Zambia to Start Negotiations With Bondholders Over Blocked Debt Buyback,” 3 June 2026. The IMF sources are the African Department’s Sixth Review (IMF Staff Country Reports 2026, 021, Washington, February 2026), Fourth Review (Country Report No. 2024/350, Washington, December 2024), and Third Review (Country Report No. 2024/190, Washington, June 2024) under the Extended Credit Facility Arrangement. Bank of Zambia sources include the Exchange Rates bulletin, Lusaka, 4 June 2026; Government Bond Auction Results, Tender No. 04/2026/BA, Lusaka, 24 April 2026; Government Securities Auction Calendar, June 2026; “Adjustments in the Government Securities Market,” Public Notice, Lusaka, 31 March 2026; the Monetary Policy Committee Statement, Lusaka, May 2026; and the Governor’s Presentations to the Media for the First Quarter of 2026 (13 May 2026) and Fourth Quarter of 2025 (11 February 2026). The Ministry of Finance and National Planning’s Quarterly Debt Statistical Bulletin, Q4 2025, provides the domestic debt maturity and non-resident obligation data. Prior Canary Compass analysis referenced in this essay: Dean Onyambu, “Seven Stars That Refuse to Align,” ZAMBIA MACRO NOTE, 13 May 2026; “The Forecast Is Not the Evidence,” ZAMBIA WORKING PAPER, 6 March 2026; “Growth Without Diffusion,” ZAMBIA MACRO NOTE, 30 March 2026; “Copper Output and the 2026 Royalty Arithmetic,” ZAMBIA MACRO NOTE, 27 January 2026; “The 2026 Refinancing Wall,” ZAMBIA POLICY NOTE, 8 January 2026; and “The Misaligned Transition, Parts 1-5,” PAN-AFRICAN ESSAY SERIES, May-June 2026. Trade data is from the Zambia Statistics Agency, “Monthly Bulletin, May 2026,” Lusaka.
Disclaimer
This article does not constitute legal, financial, or investment advice. The author shares views for perspective and discussion only. Do not rely on them as a substitute for professional advice tailored to your specific circumstances. Always consult a qualified legal, financial, investment, or other professional adviser before making decisions based on this content. The analysis reflects proprietary research undertaken by Canary Compass and the author.
Canary Compass and the author accept no liability for actions taken or not taken based on the information in this article.
The views expressed in this article represent the author’s independent professional analysis and do not constitute an endorsement of any individual, institution, or position. Canary Compass and the author accept no responsibility for how this content is interpreted, excerpted, or recontextualised by third parties not involved in its production and publication. Reproducing any portion of this work in isolation, or in combination with other material, in a manner that misrepresents the author’s original meaning constitutes a distortion of the published record.
The author may hold positions in financial instruments, currencies, or assets discussed or referenced in this publication. Such positions do not constitute a recommendation to buy or sell.
All views, projections, and forecasts reflect the author’s assessment at the time of writing. Data sourced from third parties is believed to be reliable but has not been independently verified. Past performance does not indicate future results.
All content published by Canary Compass is the intellectual property of the author. Reproduction, adaptation, or redistribution, in whole or in part, requires written permission.
About the Author
Dean N. Onyambu is the Founder and Chief Strategist of Canary Compass, a financial research publication focused on African monetary architecture and financial sovereignty. He brings 18 years of experience across trading, fund leadership, and economic policy, with senior roles at Standard Bank, First Capital Bank, and Opportunik Global Fund.
Read and subscribe at www.canarycompass.com.
The Canary Compass Channel is available on @CanaryCompassWhatsApp for economic and financial market updates on the go.
For more insights from Dean, you can follow him on LinkedIn @DeanNOnyambu or X @InfinitelyDean.