


AI-illustration: The Two-Sided Coin
Inflation expectations in Zambia are broadly unanchored and adaptive, and the exchange rate and the policy rate are their key drivers. Restated from Bank of Zambia Working Paper WP/2026/2.
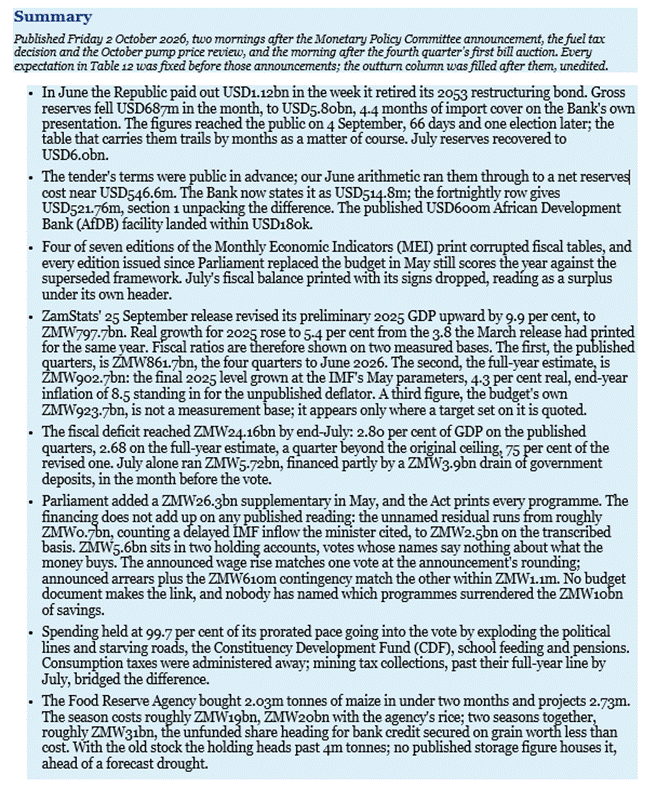
1. The Week the Money Left
The record is six rows of a table that took 66 days to appear (Table 1).
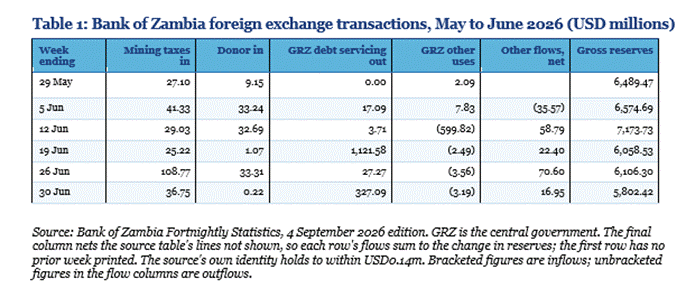
The Bond B buyback, the retirement of the 2053 restructuring bond, settles in these rows. The USD599.82m arriving in the week ending 12 June is the African Development Bank facility. The USD1.12bn leaving in the following week carries the tender payment. The instalment on the restructured 2033 bonds follows at month end. Net of the facility, the operation drew USD521.76m from reserves on these rows; the Bank’s Q3 presentation, released with the rate decision, states the cost as USD514.8m and reports July reserves recovering to USD6.0bn.
The tender’s terms were public when “The Most Expensive Recovery” (Canary Compass, June 2026) ran them through: 84 cents all-in, consideration, fees and accrued, on the USD1.365bn outstanding, against the USD600m AfDB facility. The result those terms implied, roughly USD546.6m of reserves at full uptake, was the projection, published ahead of the results of 10 and 12 June. Table 2 grades it against them and the settlement rows.
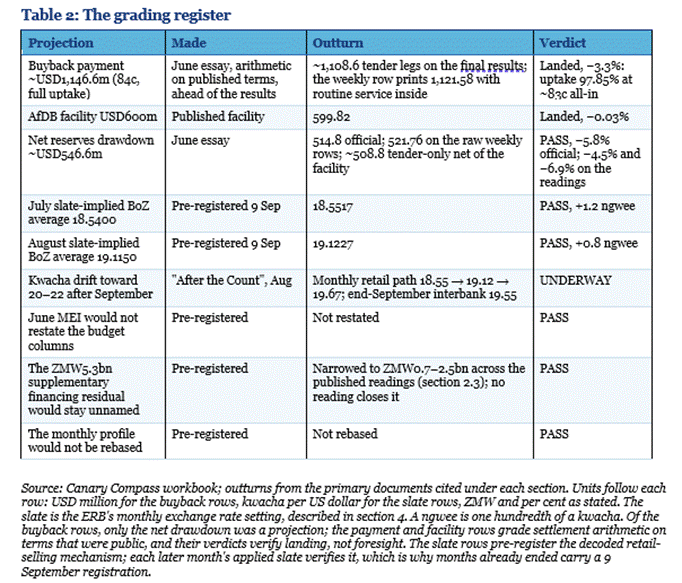
The buyback variance decomposes cleanly. The AfDB leg was exact to within USD180k. The payment row unpacks first: at the notes’ 0.5 per cent coupon, consideration, fees and accrued rebuild to about USD1,109m, leaving roughly USD12m of the week’s routine service inside the row. The tender record settles the rest: 97.85 per cent accepted at the early deadline, at USD828.68 per 1,000 plus accrued, about 83 cents all-in. The miss against the June arithmetic’s 84 is uptake with a cent of price. The clean-up call retired the remaining 2.1 per cent by 25 June, at the tender consideration plus accrued, the early fee excluded.
The recovery also grades the design. A net draw near USD515m was refilled within a month, and the market barely felt it: the interbank mid averaged 17.83 in the payment month and 18.34 in July, both stronger than May’s 18.85. The interbank is the right ruler for reserves: the Bank deals there, while the slate and retail series elsewhere in this note price the pump path. July reserves came back to USD6.0bn, 4.5 months of cover, on mining taxes and project inflows; the reading is the Bank’s September presentation, ahead of the fortnightly print. The engine is the one “The Most Expensive Recovery” rested its case on. The second quarter’s current account surplus widened to USD0.3bn from USD0.1bn, and the mining sector supplied USD1.2bn of foreign exchange in the quarter. The offshore bond bid had added USD674m of market supply across the first half, before its primary room ran out.
On 7 July, about three weeks after settlement, Governor Denny Kalyalya told the public not to downplay Zambia’s reserves, citing USD6.5bn and five months of import cover. The Bank’s own later presentation puts end-May cover at 4.9. That was the end-May position, the latest the Bank had published; the June drawdown was settled but not yet in print. The Bank’s own 30 June position, on its own later presentation, was USD5.80bn at 4.4 months of cover, and the publication carrying it is dated 4 September. The statement was accurate on the public record and five weeks older than it sounded. The fuller context was the Bank’s to give, and the fresher number crossed an election on its way to print.
2. The Books Nobody Restated
2.1 The Publication Record
The Ministry of Finance publishes its fiscal outturns in the Monthly Economic Indicators. The 2026 series is not in good order (Table 3).
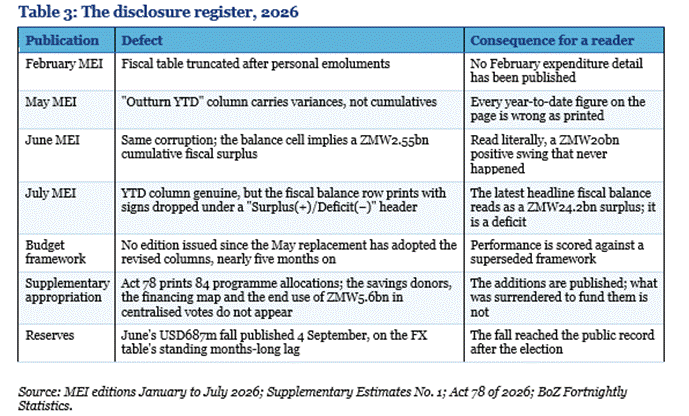
Four of the seven fiscal editions print corrupted tables. The framework is the newer failure: Parliament replaced the budget in May, and every edition issued since still scores against the one it replaced. The February truncation was on record in “Seven Stars That Refuse to Align” (May 2026); the rest accumulated after it. The headline cell a reader would lift from the most recent one is wrong as printed: the fiscal balance reads as a surplus under its own Surplus(+)/Deficit(−) header. Beside it sits a variance of 693.5 per cent, computed on the sign-dropped absolutes. The July fiscal balance is a deficit, quoted here with its subtraction shown: 114,281,456 minus 138,443,049 equals minus 24,161,593, in thousands of kwacha, confirmed by the financing table beneath it.
2.2 The Reconstructed Record
Table 4 rebuilds the monthly ledger from the archived prelims.
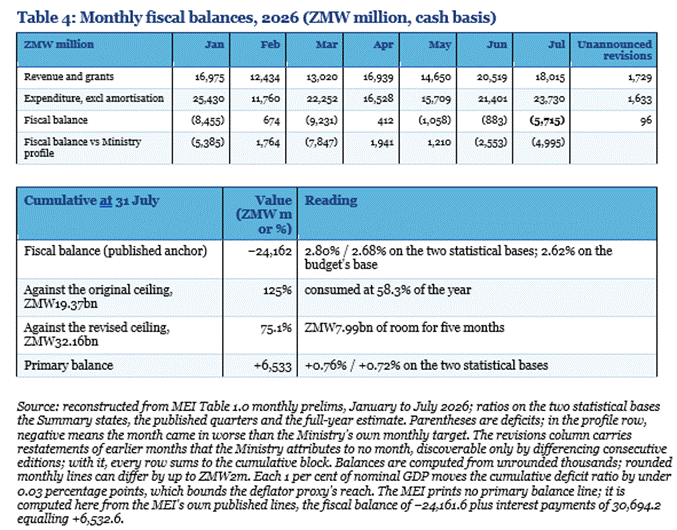
Three readings follow from the table. First, July, the month before the 13 August vote, was financed ZMW2.0bn from securities and ZMW3.9bn by draining government deposits; smaller lines net the difference. The buyback does not explain the drain: both its kwacha legs and the payment out are booked in June’s monthly financing column and net there; July’s buyback lines print zero. The buffer built from January to May was spent going into the vote. Second, June’s near-zero fiscal balance has two supports, neither of them spending discipline. June is the company tax provisional month, whose profile targeted a fiscal surplus. The month also booked ZMW2.02bn of unbudgeted revenue under the label Exceptional Revenue, a non-tax line in the MEI’s Table 1.0 with no budget provision and no explanation, now ZMW2.41bn for the year to July. Strip it and June’s fiscal deficit is roughly ZMW2.9bn; the strip treats the line as non-recurring until the Ministry classifies it. Third, across June and July the Ministry’s own profile budgeted a net fiscal surplus near ZMW0.95bn; the outturn was a ZMW6.6bn fiscal deficit. That is a ZMW7.5bn deterioration against plan in the two months before the vote. On the ceilings the distinction is pace against breach: the original was exceeded outright in July; the revised is being consumed at 129 per cent of pace, with ZMW7.99bn of room for five months.
The primary balance is the programme variable, and its path tells the year in four numbers. It ran 3.1 per cent of GDP in 2025 on the Fund’s series. The 2026 budget targeted 4.2 per cent on its own GDP base; on the statistical bases that is 4.5 and 4.3 per cent. The IMF’s May projection sits at 1.1 per cent, cut from its own prior 3.8, naming the fuel suspension, election spending, the wage settlement and the agricultural overrun as the drivers. At July the outturn is +0.76 per cent on the published quarters, +0.72 on the full-year estimate. Seven months in, the outturn tracks the Fund’s revision, not the budget’s ambition.
2.3 The Budget Zambia Actually Has
Parliament approved a ZMW26.3bn supplementary on 11 May, and the Supplementary Appropriation Act, assented on 4 June, prints the allocation: 84 programme amounts across the heads, summing to ZMW26.32bn. The MEIs ignore both. The schedule’s two largest finance lines are a ZMW2.90bn Centralised Holding Vote and ZMW2.68bn of Centralised Strategic Payments. A vote is the budget’s holding account, a line that carries money without naming a programme; these two carry ZMW5.6bn between them, unnamed.
Three outside transcriptions exist, and ours reconciles to all of them. ZIPAR, the Zambia Institute for Policy Analysis and Research, with UNICEF, transcribed the Estimates at head level in its mid-year analysis; CSPR, the Civil Society for Poverty Reduction, adds a sector summary. We combined both with the reconstruction, and the Act corroborates it: the Social Cash Transfer and Food Security Pack increments match exactly at ZIPAR’s printed precision, the agriculture head within ZMW5m. ZIPAR’s half-year revenue figure of ZMW96.3bn reproduces our monthly sums plus the ZMW1.73bn of unannounced revisions we had localised by differencing consecutive editions. ZIPAR’s July cash transfer figure of 56.87 per cent of the revised allocation equals ours to the second decimal. The ledger is internally sound; the publications describing it are not.
What the combination cannot do is make the supplementary’s own arithmetic close (Table 5).
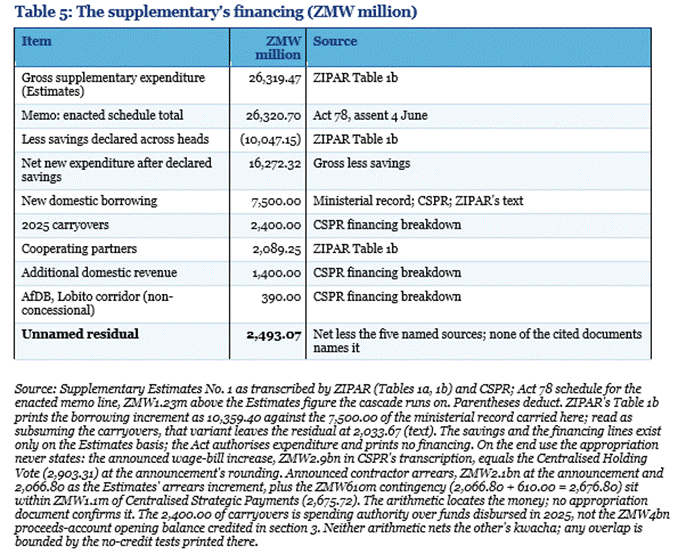
The residual moves with the reading; on neither published basis does it close. Add up every source of money the government has named for this supplementary, and it does not reach the amount Parliament approved. ZIPAR’s transcription of the Estimates financing table prints the borrowing increment as ZMW10.36bn rather than the ZMW7.5bn of the ministerial record. On the reading that the larger figure subsumes the ZMW2.4bn of carryovers, the residual is ZMW2.03bn; counted separately, the schedule would over-finance, which no account claims, so the classification is unresolved. We publish on ZMW7.5bn, the basis of record, and carry the variant as a question about a document never published in full. On that basis ZMW2.5bn of the appropriation has no named source; the carryover reading narrows it to ZMW2.0bn. The ministerial presentation separately counted a delayed disbursement under the IMF’s Extended Credit Facility (ECF), USD95m received after slipping from late 2025, about ZMW1.8bn at the May interbank. No transcription’s financing table carries it; counted in, the residual narrows toward ZMW0.7bn, and the reported domestic-financing figure itself varies between 5.75 and the 7.5 carried here. No reading closes the gap, and no single published table reconciles the financing.
On the spending side, CSPR’s analysis of the Estimates carried ZMW7.1bn, 27 per cent, as unspecified. The enacted schedule has since named every programme; what stays unconfirmed is the mapping: the announced purposes reconcile to the two centralised votes arithmetically, in Table 5’s note, and no appropriation document maps them. The ZMW10.05bn of declared savings is invisible twice: no document, the Act included, names the heads that surrendered it, nor how much each gave up, so every revised allocation is an upper bound. And the widely reported ZMW279.4bn revised total, the ZMW253.1bn original plus the ZMW26.3bn gross supplementary, ignores the offset. The net envelope is ZMW269.4bn. Nearly five months on, its financing does not add up in public, the two centralised votes still name no purpose, and the Ministry still scores the year against the budget it replaced.
2.4 Execution Against the Revised Budget
Table 6 screens the July outturn against both the original and the revised allocations.
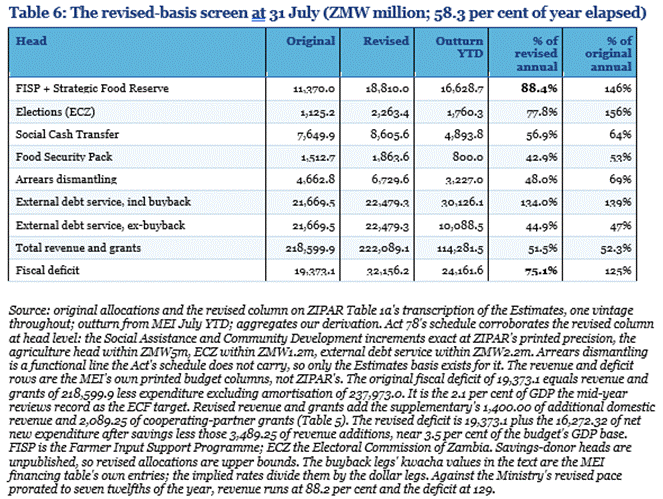
The restatement cuts both ways. The elections line, scored exhausted against the original budget before the vote, was funded through it once the supplementary doubled the ECZ head; the revised basis is the right one and Table 6 adopts it. The original line was written for a smaller election: the supplementary’s ZMW1.14bn increment funded the constitutional amendment’s new map, 226 constituencies from 156 and 16,400 polling stations from 12,152, on CSPR’s transcription. The maize line survives every restatement: nearly nine tenths of an envelope raised by two thirds, consumed before the input season. And the external service line shows the buyback for what the fiscal accounts say it was. The ZMW20.04bn that moved through June’s books nets to zero across the financing table: the ZMW10.4bn AfDB loan and the ZMW9.6bn Bank of Zambia leg in, the payment out. The kwacha legs are section 1’s dollar legs: the loan is Table 1’s USD599.82m facility; the Bank’s leg matches the official USD514.8m drawdown. The loan books at 17.40 kwacha per dollar, the market of its own drawdown week: 11 and 12 June printed the month’s lows. The Bank’s leg books near 18.65, above anything June traded. On the Bank’s published dailies, June ran 17.37 to 18.33 around a 17.83 average; 18.65 is a May-range rate. The operation financed none of the fiscal deficit. Strip it and external service falls to 44.9 per cent of the revised line, behind pace rather than through it.
2.5 Where the Money Went
Total expenditure excluding amortisation printed at 99.7 per cent of its prorated pace at July. The aggregate conceals the line-level divergence (Table 7).
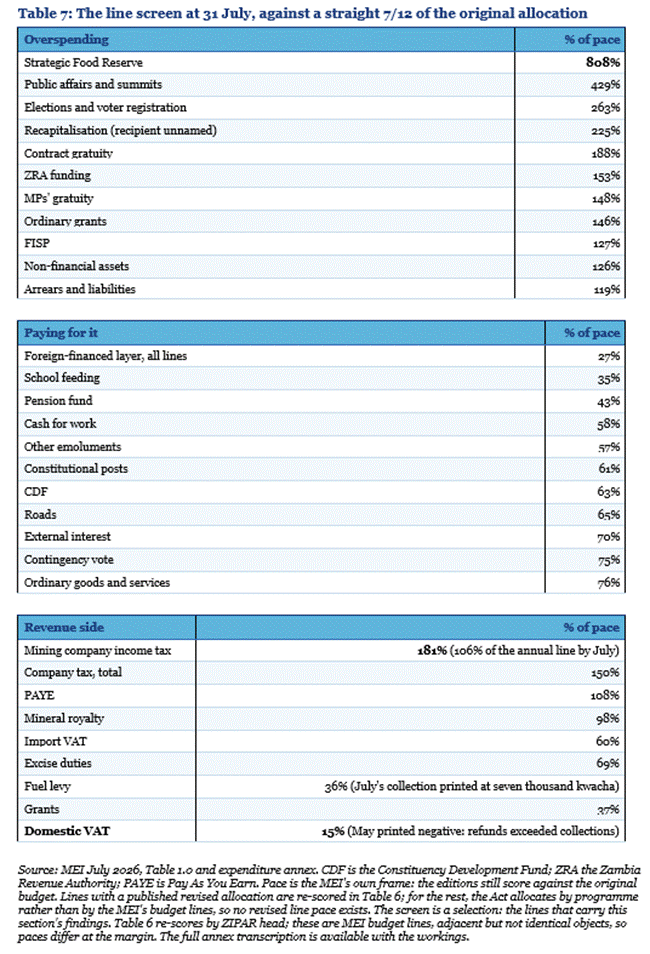
The composition is the table’s: political lines exploded while roads, the CDF, school feeding and pensions were starved, and consumption taxes were administered away. Mining collections, past their full-year line by July, bridged what the rest gave up. That bridge rests on one commodity. A copper economy at record prices is simultaneously the budget’s largest income tax payer and a structural source of its VAT refunds, because exports are zero-rated and copper is the export base. The appreciation that flatters the external accounts compresses every kwacha the state converts, the trade-off set out in “Copper Output and the 2026 Royalty Arithmetic” (January 2026).
Three unnamed items remain. Exceptional Revenue, ZMW2.41bn with no budget line and no name, is 2.1 per cent of revenue to July. A recapitalisation line is 31 per cent over its full-year allocation with the recipient unidentified. And a ZMW458m upward revision to grants has appeared in three consecutive publications, attributed to no month, discoverable only by differencing editions.
2.6 The Maize Position
The Strategic Food Reserve line is the centrepiece of the screen, and its mechanism sits outside the budget (Table 8).
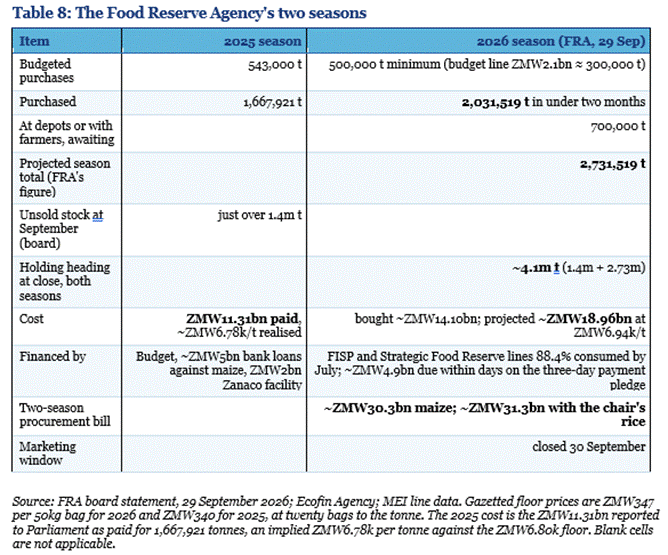
The 2025 gap was funded off the books: roughly ZMW5bn of commercial borrowing collateralised by the maize itself, a ZMW2bn Zanaco facility, and ZMW3.3bn of unfunded arrears. The Secretary to the Treasury’s April presentation acknowledged the arrears. The supplementary’s ZMW7.4bn agriculture allocation, ZMW5.0bn to food reserves and ZMW2.4bn to the input programme on the Act’s schedule, was not new spending; it cleaned up last season’s obligations. The MEI’s Strategic Food Reserve line, ZMW7.2bn by June and ZMW9.9bn by July, is that cleanup plus the new season starting. The new season then outran every frame, on the agency’s own account: a record 2.03m tonnes in under two months, 2.73m projected. On the pledge to pay within three days of delivery, roughly ZMW4.9bn falls due within days as deliveries are accepted, against appropriations already close to spent. The overflow heads for bank balance sheets, secured on grain, the same balance sheets the auction book clears through. The ZMW25bn that circulated in the market as the agency’s funding appetite was never published with a composition. Published tonnage and gazetted prices put the new season alone at roughly ZMW19bn and the two seasons at ZMW30.3bn, and the rumour sits inside that bracket. The agency chair’s own season figure, a record ZMW20bn as marketing closed, counts maize and 100,000 tonnes of rice together; the maize-only ZMW19bn sits inside it. Counted with the rice, the two seasons head past ZMW31bn.
The collateral does not cover the cost. Procurement cost runs near USD355 to 376 per tonne across the two seasons at the year’s exchange rates. ZAMACE market reporting, the Zambian commodity exchange, put the agency’s offer price near USD275 and the regional market near USD230 in September. The one large export deal, 540,000 tonnes signed with Kenya’s Baita Trading on 9 September, delivers in six tranches at undisclosed prices. Even at USD230 to 275, the full deal recovers ZMW2.4 to 2.9bn against a two-season procurement bill heading past ZMW30bn: under a tenth of the bill. Every tranche priced below cost would realise part of that loss; the undisclosed prices withhold the margin, not the exposure. No public record states whether the Zanaco facility has been repaid. The agency’s board put the old season’s unsold stock just over 1.4m tonnes in September; with the new season’s 2.73m, the holding heads past 4m tonnes, bought above its selling price.
Storage is where the arithmetic stops reconciling. The agency’s own secure capacity is roughly 1.5m tonnes, per “Seven Stars That Refuse to Align” in May; the Agriculture Minister put national capacity, 375 facilities including 72 private, at 1.83m the same month. The executive director’s mid-September count corroborates it: 3.1m tonnes held on 18 September, 1.7m new and 1.4m old, already more than a million beyond the national figure. No published record says where the balance sits: a property director sent to optimise storage space, satellite depots nationwide, and last season’s open-air precedent are the agency’s own markers. That precedent ran near a tenth of today’s overhang: roughly 170,000 tonnes outside secure capacity then, 1.67m bought against 1.5m of room, against 2.3m beyond the national figure now.
The position is also provisioning, and the price risk it insures runs one way. The strategic reserve target is 2.5m tonnes, the Agriculture Minister’s January figure. The stock stands ahead of an El Niño season NOAA’s Climate Prediction Center carried at better than 90 per cent odds in August, as “After the Count” recorded. If the drought lands, maize prices move up, not down. A failed harvest would meet a reserve drawn into domestic need and exports already contracted, and the mealie-meal price the CPI reads could run far past today’s floor. In that market the holding is the brake, and the below-cost arithmetic above inverts: scarcity reprices the stock toward what it cost. The purchase also has a beneficiary already banked: farmers harvested into a guaranteed buyer at a gazetted floor above what the grain resells for, the political win “Seven Stars” recorded in May.
Which reading carries is measurable: the pace of releases and export tranches against last season’s, where 1.4m of 1.67m was still held a year later. The ZMW30.3bn is a two-season procurement flow, not an outstanding debt; the bank exposure, unquantified while old-loan repayment stays undisclosed, builds in the new season’s unfunded share. Positions like this surface in the fiscal tables eventually: as arrears, as a recapitalisation, or as a supplementary. It is the fuel stabilisation pattern applied to grain, a discretionary quasi-fiscal operation visible in the accounts only as the settlement line.
3. The Financing Triumph
Positions that size end at the same constraint the Treasury itself faces: the financing requirement. In July we circulated a private note, “The Year as a Single Equation”, which reduced the year to one requirement and ended with four doors. This section restates its equation on the year-end debt bulletin’s 2026 schedule. Maturities at cost of ZMW85.86bn, from Table 27 of the year-end Debt Statistical Bulletin, plus the ZMW21.62bn issuance plan give a requirement of ZMW107.48bn original and ZMW114.98bn revised. First-half delivery was ZMW58.44bn. The note’s own working figures, and the ZMW106.07bn carried earlier from the Annual Borrowing Plan, predate the year-end bulletin; the figures here supersede both. Crediting the ZMW4bn opening balance in the proceeds account, the second half had to place 83.7 per cent of every kwacha offered on the original framework, 97.7 per cent on the revised. That is the placement test; the delivery shares below are a different ratio. The balance is not a published figure; it reached us through the private reconciliation the note was circulated for, and it is material: without the credit the tests read 91.1 and 105.1 per cent. The offer base is ZMW53.8bn: Q3’s announced ZMW25.8bn plus the ZMW28bn assumed below for Q4. When the note circulated in July, trailing four-month delivery stood at 79 per cent of offers; the same window ending September stands at 110.
The four doors, with no fifth. Issuance delivers more, through bigger offers, fuller take-up or allotment beyond offer; maturities are bridged from revenue; the net domestic financing (NDF) target is missed; or the debt stock shrinks.
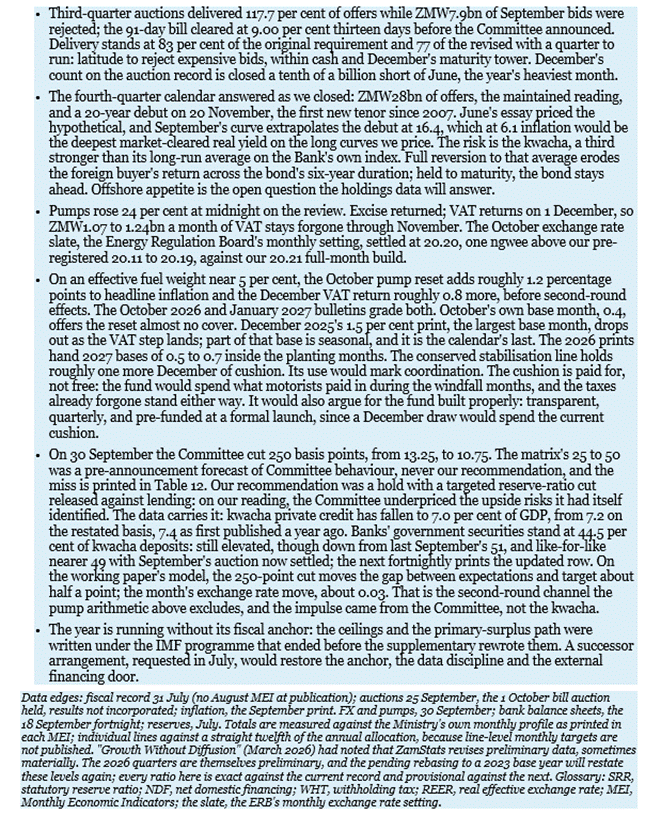
The third quarter answered through the first door, by allotment beyond offer rather than bigger offers: the calendar stayed scarce and the window took 117.7 per cent of what it showed (Tables 9 and 10).
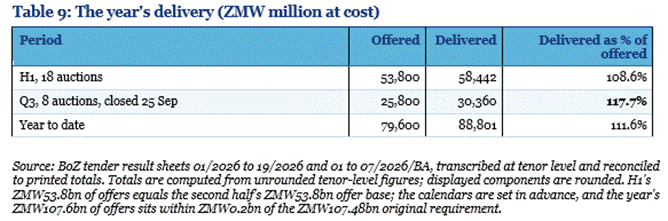
What remains, net of the proceeds-account credit, is ZMW14.68bn of the original requirement and ZMW22.18bn of the revised. Against an assumed ZMW28bn of fourth-quarter offers, that is 52.4 and 79.2 per cent; without the credit, 66.7 and 93.5.
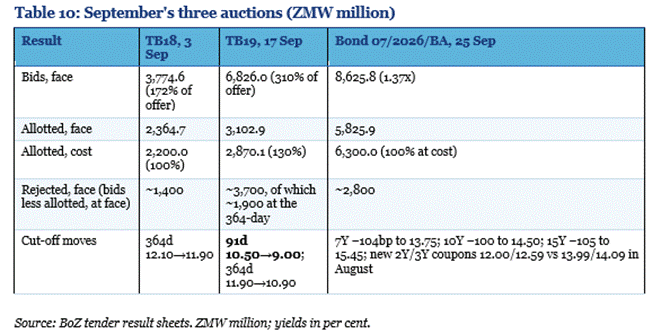
Across the three auctions roughly ZMW19.2bn of face value chased ZMW10.7bn of offers; ZMW11.4bn was allotted at cost, over offer, and ZMW7.9bn of face was turned away. Since January the 91-day is down 300 basis points, the one-year 360, the bond curve 269 to 334. The mechanism matters more than the levels: the requirement collapsed first, the rejections became cheap, and the cut-offs followed. In March and April the Treasury rejected bids with the requirement still unmet, compression taken on credit, and April’s bond auction cleared at 20 per cent of offer to show what that costs. By September the requirement was largely closed and the same rejection tool was operating on cash. Rejecting price while banking quantity is market power, and it is why these lows are sustainable into the fourth quarter in a way March’s never were.
The latitude is arithmetic. Delivery stands at ZMW88.8bn, 83 and 77 per cent of the original and revised requirements, with a quarter to run. The Treasury has latitude to refuse expensive bids and wait, within its cash position and the maturity calendar. The NDF ceiling pushes the same way: at 95 per cent consumed, net issuance has almost no legal room, and rejection costs nothing against the financing provision. Both forces run yields down while the fiscal record argues the other way.
The cash came partly from the budget’s own front-loading and partly from an administrative act. On 31 July, between MPC meetings and thirteen days before the poll, the Bank cut the statutory reserve ratio (SRR) on kwacha deposits from 26 to 21 per cent by circular. Foreign currency stayed at 26, and compliance moved from a daily test to a weekly average. The Bank’s liquidity fortnightly dates the release: statutory reserves fell ZMW6.5bn in four trading days, parked first in term deposits, then surfaced at the auctions. The bill sale three days after the release drew 2.18 times its offer; the one a fortnight later, competing with a bond the next day, drew 0.78.
The instrument has a published design, and the August version was half of it. “Zambia Monetary Policy, Part 3” (Canary Compass, December 2025) proposed that when this cut came, it should come with the relief earned rather than granted. That condition was the point, if the target was truly to expand credit access and boost private sector growth. The design had two arms. Relief against lending: 200 basis points at a 50 per cent private loan-to-deposit ratio, 400 at 60. And an asymmetric ratio that raised the foreign currency requirement while settling it in kwacha, so the release de-dollarises as it eases. Either arm is built to stop freed liquidity simply rotating back into government paper. August delivered the relief with both arms deleted: five points of kwacha relief, no lending condition, no foreign currency leg. Unconditioned, the release can still buy growth, but public-led growth, because in this system freed liquidity has a default destination, and the fortnight’s data showed it arriving there.
The dashboard the design was built on says why targeted beats blanket. Kwacha private credit has slipped to 7.0 per cent of GDP at July, from 7.4 published a year earlier, 7.2 restated on the final GDP; total private credit is down from 13.6 to 12.0. Credit to the private sector, the thing a cut is meant to buy, was shrinking relative to the economy. The other side of bank balance sheets says where the capacity sits. Government securities stood at 44.5 per cent of ZMW132.1bn of kwacha deposits on the 18 September fortnight, lower than last September’s 51 print, with deposits up 26 per cent in the year doing the work. The ratio is still elevated, and the comparison flatters the fall: last September’s 51 was read after that month’s bond auction had settled, while the 18 September fortnight sits before this one’s. The roughly ZMW6.3bn the late September auction raised at cost settled as the month closed, taking the ratio back toward 49. Kwacha private credit sits at 47.1 per cent of deposits, below the 50 per cent floor Part 3 set for earned relief. That is the case for the targeted instrument: a reserve release conditioned on lending attacks the 47.1; an unconditioned rate cut feeds the 44.5, the 49 on the settled reading. The October monetary statistics grade the split: private kwacha credit against bank holdings of government securities.
The tenor split points to who is buying the curve at these levels. At the 25 September bond auction the two-to-seven-year bucket took ZMW6.35bn of bids at cost against ZMW3.08bn at ten and fifteen years. Cost runs above the face bids in Table 10 because the outstanding coupons price above par at these cut-offs; the reopened seven-year allotted at 117.5 per 100 of face. Against August, the front grew 36 per cent and the long end shrank 38. The local bid replaced the offshore one at the margin, with the primary room spent and the withholding arithmetic already favouring the local book. A non-resident faces 20 per cent WHT, so the one-year at 10.90 gross is 8.72 net. Against the full-tax counterfactual for August, the index with the suspended fuel taxes restored, near 7.6 (section 4 derives the series), that is a real return of about a point. A local bank reclaiming the tax clears about three points on the same index before corporate income tax, and more than four on the printed one. At these cut-offs the arithmetic favours the local, and the Bank’s Q3 presentation says both halves of this in its own words.
Foreign institutions’ foreign exchange supply fell from USD542.3m to USD132.1m in the second quarter because, in the Bank’s phrase, their allocation in the primary market was exhausted. Their holdings tell the other half, at the June vintage the Bank has published: ZMW78.2bn, 28.9 per cent of the ZMW270.7bn outstanding, down just ZMW0.1bn in the month. The money that came in stayed; what stopped, on the data to June, was adding at the window. Whether they have added since through the uncapped secondary, or through local banks buying and on-selling, the grey area the cap does not police, is not observable until the next holdings print. Bond auctions were consolidated to two per quarter from monthly at an unchanged quarterly volume, so each window now meets more of the quarter’s demand at once. Three forces produced the decline: rejections, a reserve release, and a front-run rate cut. Each was administered or one-shot.
Two constraints sit under the triumph. Netted for the buyback pass-through, deficit-financing domestic borrowing stood at ZMW27.4bn by end-July: 128 per cent of the original ZMW21.4bn provision and 95 per cent of the revised ZMW28.9bn. The distinction needs stating precisely: gross issuance against maturities is not capped, and the auction record shows no funding constraint. What is nearly exhausted is the net deficit-financing provision in the budget law, the borrowing Parliament has authorised to be booked against the deficit rather than against rollover. That constraint binds in the National Assembly, not at the auction window. What remains of the provision is ZMW1.5bn against ZMW7.99bn of deficit room. Any deficit beyond it needs financing from outside the line: deposits, external inflows or revenue overperformance, channels open but not the year’s method. The year’s method has been to borrow through the original provision and reject the expensive bids; widening the provision again takes a second supplementary.
And December is a wall on both sides. The external side is the restructured bonds’ December payment: they pay each June and December. June’s regular instalment was ZMW5.3bn on the July MEI, the ZMW25.3bn of external amortisation less the buyback’s ZMW20.04bn pass-through, and December carries the mirror. Its kwacha cost at the end-September interbank, 19.55, runs about 10 per cent above June’s 17.83 average. The domestic side is the December maturity tower. June and December stood as the opening profile’s two towers, as the January absorption essay mapped; June’s came in at ZMW9.1bn of face value, the year’s heaviest month. December’s count is closed on the auction record: ZMW9.0bn is dated into the month, last December’s 364-day bills, the December-dated bond lines and ZMW3.4bn of the year’s own issuance. Nothing on the remaining calendar adds to it. The 1 October auction’s own 91-day, settled the day after the auction, matures on 1 January, and the quarter’s bond auctions issue at two years and longer. December lands a tenth of a billion short, and June keeps the year’s heaviest month. What December carries instead is composition: ZMW1.0bn of June’s print was bill recycling, and December holds more than three times that. Nearly three in ten kwacha of the stock sit with non-residents whose primary allocation is spent. The cap is a flow limit, 23 per cent of the ZMW50.4bn gross primary bond issuance: ZMW11.6bn for 2026 against ZMW10.5bn of non-resident maturities, sized to roll the principal, as “The Most Expensive Recovery” mapped. The other ZMW14.1bn owed them, coupons and discount, is serviced from revenue, not rolled.
What the cap did not anticipate was the appetite: holdings rose ZMW12.5bn in the first quarter alone, across primary and secondary, and the room sized to roll the maturities was spent on adding by mid-year. The principal still comes due. Rolling it now runs through the secondary market, on a domestic balance sheet willing to intermediate, at a price the cap does not set. From 2027 the plan lowers the primary room to 15 per cent.
The fourth-quarter calendar, published as this note closed, answers: two bond auctions of ZMW6.3bn each, on 20 November and 18 December, with seven bill auctions at ZMW2.2bn, ZMW28.0bn of offers in all. That is the maintained reading, and it is the ZMW28bn this section assumed. It also adds a tenor. The November auction debuts a 20-year bond, the first new point on the kwacha curve since the 15-year arrived in 2007. “The Most Expensive Recovery” extrapolated a hypothetical 20-year in June on the curve’s 20-basis-point slope. Its decision boundary, on a gross basis against the 2053 at its June price of 84 cents, the bond the buyback then retired: roughly 9.4 per cent annual depreciation. A lower debut yield lowers that boundary with it. September’s curve runs the same arithmetic: 14.50 at ten years, 15.45 at fifteen, 19 basis points a year of slope, a debut at 16.4 if the slope holds and above the 15-year by construction. At these yields the tenor adds term, not duration: a 20-year par bond near 16 carries a modified duration close to six years, barely above the 15-year’s, because the coupon returns the money early. September’s buyers sat short: 44.9 per cent of bond sales were three years or less, and the average sale 7.2 years. Short sales mature in 2028 and 2029; a 20-year gives that wall somewhere to go, and consolidation can do the rest: a ZMW6.3bn debut, reopened on the December date, would reach index-eligible size.
The offshore buyer, if it returns, comes through that secondary market, which now carries an index bid: the kwacha’s place in JP Morgan’s new frontier local-currency index was reported in late September.
The continent’s long ends say why the bid may come. In September, Kenya’s 20-year line, twelve and a half years left on it, cleared at 13.61, its new 30-year at 14.24, against 6.8 inflation. Uganda’s 20-year, new this year, was held at 15.00, with over a trillion shillings of bids rejected, against 4.6. South Africa’s 20-year marked near 9.4 at end-September, against July’s 4.3. Nigeria’s long end paid 16.8 in September against August’s 15.4 inflation, its one-year money 16 to 17: nominal yield without real yield.
Zambia’s 15-year at 15.45 against 6.1 is a real yield above nine on printed inflation, and a 20-year at 16.4 would be the deepest market-cleared real yield on the long curves priced here. On the note’s own 7.5 counterfactual it still runs 8.9, and the seat holds. The one deeper print, Uganda’s, was administered by rejection, allotment rationed to defend a price, where September’s Zambian auctions allotted beyond offer at theirs. What prices the risk is the kwacha itself. The Bank’s real effective exchange rate index rises on depreciation, so lower readings are stronger. May and June sit about a third below the long-run mean on the fortnightly’s own series, the strongest prints it holds; section 4 carries the reading. An average is not an equilibrium, and the index can revert through a weaker kwacha or through inflation running above partners’. The breakevens here price the first path; the second erodes the return instead. The full-reversion case is run because it is the hardest test, not the expected path.
The arithmetic of erosion runs at the extrapolated debut, and Table 10A carries it. The live dollar comparator is the 2033, the restructuring bond still outstanding, quoted near 7.5 mid on 1 October, four tenths above its level on announcement day. The tenors do not match, six and three quarters of remaining life against twenty; the horizons nearly do, the kwacha coupon compressing the 20-year’s duration to about six years. A dollar yield moves every bar: each point available elsewhere lowers the annual breakeven by about a point.
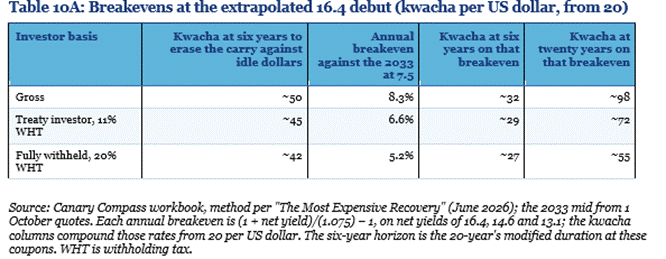
The house corridor, 22 to 24 in the medium term, annualises near 3 per cent: inside every bar. Full reversion of the Bank’s real effective exchange rate index, June’s 75.3 to the 117.7 long-run mean, is a 56 per cent move, before inflation differentials. Taken by the duration horizon it runs 7.7 per cent a year, a kwacha near 31: through the withheld 5.2 and the treaty 6.6, six tenths inside the gross 8.3. Spread to maturity it is 2.3 per cent a year: full mean reversion never catches the bond held to term. The index prices the drawdown, not the destination, and the instrument reads as built for the holder who can wait: the pension balance sheet, the tax-reclaiming local book. The window cannot prove the appetite, and the on-selling grey area blurs who shows up. The 20 November debut prices five days before the Committee meets; the December note grades the clearing yield, the offshore share and the tenor mix, and re-runs these boundaries at the debut’s prints.
4. The Price the Public Sees
The Committee sat on 28 and 29 September against inflation at the floor of the Bank’s 6 to 8 per cent band: 6.2 in August, 6.1 in September. The number is real. Its construction is fiscal, in three layers.
The first layer is the tax suspension: excise at zero and VAT zero-rated on petrol and diesel since April, Treasury instruments under the tax statutes, expiring 30 September. The second is the discretionary stabilisation line inside the Energy Regulation Board’s (ERB) wholesale build-up, an amount set each month at the Board’s discretion with no published rule. In September it posted its largest payout on record and pinned all three products’ wholesale prices at August’s level to the ngwee; pumps printed 25.29 for petrol and 26.86 for diesel through August and September. The third is the exchange rate slate, set by Statutory Instrument 77 of 2024. The applied rate is twice the current month’s average less the prior month’s, a momentum-doubling formula. The regulation names no series; the reconstruction identified the Bank’s retail average selling rate, which reproduces every applied rate to within four ngwee. “Behind the Petrol and Diesel Pump Price” (July 2026) set out the mechanism. Its October build was 20.21 on the complete September dailies; the ERB applied 20.20. The Board’s October statement separately cites the kwacha slipping from 19.28 to 19.76 over the review period: the market’s move in the window, not the slate it applied.
What the suspension cost, and what the 30 September decision did with it, is a first-order fiscal quantity (Table 11).
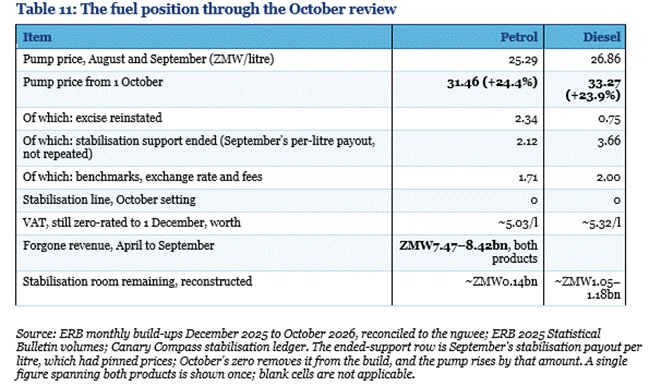
The reconstruction in Table 11 puts the cost at ZMW7.47 to 8.42bn, about USD400m at the year’s rates. The Economics Association of Zambia carries the same figure. At the pre-restoration run rate the suspension forgave roughly 7 per cent of the year’s domestic revenue target, annualised. The IMF counts it among the drivers that cut the projected primary surplus from 3.8 to 1.1 per cent of GDP. The second layer changed sides across the year. The line charged in February and March, ZMW3,330 to 3,640 per cubic metre at February’s peak, ZMW3.33 to 3.64 a litre, and again in June and July. It paid out in April and May, and again from August. Diesel litres funded 86 per cent of the scheme’s standing balance at its August peak. By end September its reconstructed room was below one month of a full pin.
The 30 September review resolved all three layers together, and Table 12 grades the detail. Excise came back, with VAT to follow on 1 December. The stabilisation line printed zero on every product for the first month since it began. The pin broke, and pumps reset a quarter higher at midnight. Table 11A sets out what the staging recovered and what it left.
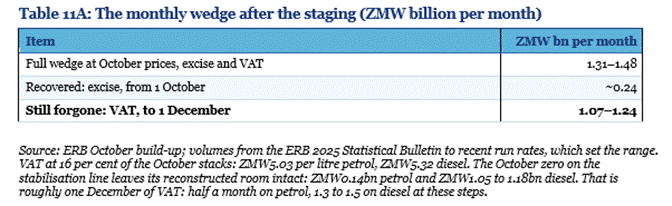
Two consequences carry forward. The headline says taxes are back, but excise is 16 to 18 per cent of the monthly wedge, and the VAT remainder in Table 11A stays forgone through October and November. Its return on 1 December is a pre-announced pump rise of roughly 16 per cent, about ZMW5 a litre, unless something absorbs it; the conserved stabilisation line could, and Table 11A’s note prices the room. And the November Committee meets on 25 and 26 November, before that reinstatement, so the next rate decision will also be taken on a partially suspended index.
A third consequence sits in the fund. It did not spend in October. If it spends in December instead, pump prices need not rise as much when the VAT returns, or at all, depending on where crude and the crack spreads have moved by then. The November build-up and the 1 December prices will say.
Two things stay true either way. A cushioned rise is postponed, not cancelled, and the money spent cushioning is the money a Gulf or El Niño shock would need. The tax cost does not disappear either: Table 11’s ZMW7.47 to 8.42bn already sunk through September, plus October and November’s VAT line, stands whatever December does. A December draw moves the cost from forgone revenue to the fund’s ledger, financed by the windfall-month payments motorists already made.
It would be the restore-and-pin of “Behind the Petrol and Diesel Pump Price”, staged. Today the instrument is a single line in the wholesale build-up, as that essay showed, not a standing fund. Built properly it needs transparent rules, quarterly holding, and pre-funding at a formal launch, because a December draw spends the conserved balance and the fund would start empty. The case is monetary as much as fiscal: a rule-based fund smooths the pump path the CPI reads, instead of handing the index a quarter-sized step. The precedent is regional and live: South Africa runs the formal version, formula errors amortised through a self-adjusting levy under a published rule, the balance printed monthly.
If that is the plan, section 5’s reading follows: the cut was priced off a December the authorities intend to engineer, coordination in fact and balance-sheet management in mandate. The upside risks stand; the recommendation is unchanged.
The staging has an index arithmetic, and it defines this note’s full-tax counterfactual: the inflation rate as it would print with the fuel taxes restored. It is the index section 3 stress-tests the 20-year against. The chain runs forward from published numbers. On the ERB build-ups the suspended taxes are about a fifth of the full-tax pump price, so restoring them raises the paid price by about a quarter. The published Transport weight is 5.8 per cent; fuel at an effective 5 inside it turns the one-quarter price gap into a 1.3 per cent index gap, 1.075 against 1.061. On September’s printed 6.1 that is a counterfactual near 7.5. The wedge converges: about 1.4 points in September, 0.8 from October with only the VAT missing, none from 1 December, when print and counterfactual merge. On that weight, held fixed, the October reset adds roughly 1.2 percentage points in the month it enters and the December reinstatement roughly 0.8 more, before second-round effects. Both figures are graded when the October 2026 and January 2027 bulletins print.
Base effects run the other side of the ledger. October 2025’s 0.4 drops out of the October comparison, and December 2025’s 1.5, the largest base month left in the twelve-month rate, drops out exactly when the VAT step lands. The base is not all cover: Decembers run seasonally warm, 0.8, 1.0 and 1.2 in the three years before 2025, so December 2026 brings its own print. The trend shrinks it: 2026 prints average under half their 2025 counterparts, so the step can enter the price level and leave the year-on-year rate near the band’s floor.
That arithmetic is what the Bank’s 6.7 average for 2026 and 6.0 for 2027 lean on, and the annual averages still need the rest of the index to behave; the price level rises either way. The staging matches the calendar: the smaller step, the excise, lands first; the larger, the VAT, lands in the month with the most base cover. As sequencing, the December choice is well judged.
The cover then expires. Both steps stay in the twelve-month rate deep into 2027, the 2025 bases are gone by January, and the 6.0 for 2027 must carry them. The first half of 2026 ran on the opposite effect: the drought-era prints of early 2025, 2.1 in January and 2.4 in February, fell out of the rate. The record harvest then pulled food inflation from near thirteen to six. From January 2027 the bases flip. The 2026 prints hand over 0.5 to 0.7, the planting months are seasonally the year’s warmest, and the VAT step, El Niño and Gulf crude all land inside them. December’s cover is the calendar’s last; the months after it carry none.
The import bill is already moving on Middle East crude, per the ERB’s own October citation. The outlook’s other pillar is maize: the Committee’s statement rests its favourable path on stable grain prices, and section 2.6’s four million tonnes is that pillar’s balance sheet, the grain twin of the fuel fund.
Bank of Zambia Working Paper WP/2026/2, the source of this note’s epigraph, finds expectations broadly unanchored and adaptive, with the exchange rate and the policy rate their key drivers. An adaptive public does not read the slate; it reads the pump prices the slate sets, and the slate moved: September’s average was 19.67 and the October setting applies 20.20.
There is a fiscal ledger on the exchange rate, and it cuts both ways. The budget carries roughly ZMW21.7bn of external interest and principal, ZMW11.58bn of it remaining after July; every 1 per cent the kwacha loses adds about ZMW116m to that remainder. Import VAT at ZMW42.5bn is charged on the kwacha value of imports, and royalty at ZMW18.2bn and mining company tax at ZMW13.2bn convert dollar receipts. From the build’s 20.21 to 22 at constant imports, the import-VAT line alone gains roughly ZMW1.5bn over the five remaining months. That is a gross revenue sensitivity, not the net fiscal effect, and the cost lands in the price level the Bank targets.
The house corridor stands: 18 to 20 suited stabilisation through the vote; 20 to 22 is the current drift; 22 to 24 is the medium term. Two rates move inside it, and they are different objects. The retail series the slate runs on averaged 19.67 in September; the slate, doubling momentum by construction, already applies a 20 handle for October. Any further market weakness reaches the pumps amplified, and the working paper names the exchange rate among the two key drivers of expectations. That is the bind the fuel decision tightened. With the taxes back and adding their 1.2 points, the kwacha is the lever that still defends the index. It defends it from the strongest real effective level since 2003 on the Bank’s readings, a third below the long-run average. Holding the level defends the CPI and forgoes the revenue; drifting collects the revenue and hands the index the slate’s doubled version of the move.
5. Wednesday, Priced in Advance
The matrix was fixed before the 30 September announcements and the outturn column completed after them; nothing in the expectation column has been revised.
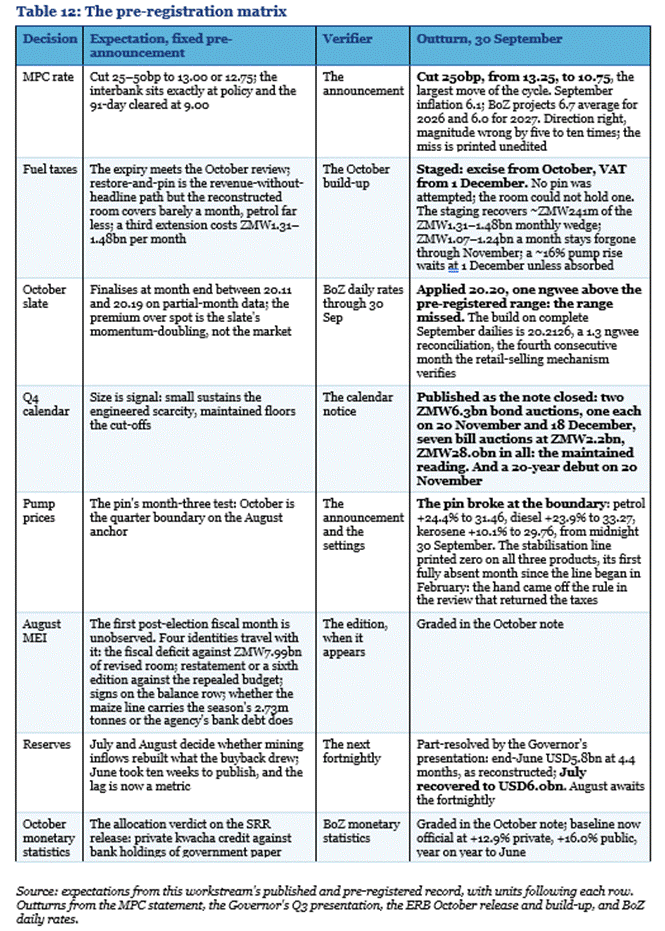
The case for the cut and the critique of it share the same three facts. At 10.75 the real rate is positive on either index: 4.65 on the printed 6.1, near 3 on the 7.5 counterfactual. Kwacha private credit, at 7.0 per cent of GDP, gives the cut little credit inflation to generate; its most direct effect is the sovereign’s rollover cost into December’s wall. And on the Bank’s own working paper, the exchange rate stands beside the policy rate as a key driver of expectations. Read one way, that is room to ease. Read the other way, a cut whose liquidity reaches government paper before private credit is fiscal accommodation by function, whatever its label. It arrived at five to ten times the matrix’s forecast, in the quarter the financing provision runs out.
The paper’s coefficients price the week: the 250 points add roughly half a point to the gap between expectations and target; the month’s exchange rate move, about 0.03. The working is the paper’s own gloss, 0.01 on the deviation per 1 per cent exchange rate move and 0.190 per policy point, fit on quarterly professional forecasts through 2024. These are model sensitivities, not measured announcement effects, and they are the second-round channel section 4’s 1.2 and 0.8 exclude. Even a full move to the drift corridor’s 22, about 13 per cent from the end-September interbank, prices near 0.13 on the same coefficient: a quarter of the cut’s half point. On the paper’s own arithmetic, the week’s larger de-anchoring impulse was the cut, not the kwacha.
The Committee cut “taking into account the lower inflation outcome, the projection that inflation will remain within the target band over the forecast horizon, and the identified upside risks to the inflation outlook”. The same document calls the decision “supportive of the national growth agenda”, under the Act’s price stability mandate. On this note’s reading, those identified risks are underpriced. The counterfactual already runs near 7.5, section 4’s calendar hands both tax steps to 2027 with no cover left, and the cut landed ahead of the inflation risk, not behind it. Twelve hours later, the fiscal authorities reset the index the Committee had eased against. No surprise reached the easer: the expiry and the review date sat on the calendar it met against, and October’s 1.2 points were computable at the table. A committee that cuts the night before a reset it can compute has priced the reset. Its projections say the same: a 6.7 average of the monthly rates needs the fourth quarter at 5.9, since January to September’s prints sum to 62.7. The October reset alone puts that quarter near 7 on this note’s weight. Either the August round, reaffirmed the evening the fuel decision landed, was stale at the cut, or the December pin is what the Bank’s own average needs: section 4’s coordination made quantitative. The October bulletin grades the branch. The decision reads better as balance-sheet management than as inflation targeting, and the October print, the November meeting and the December reinstatement will say which reading carries more of the truth.
The forecast missed and the matrix prints it; the recommendation was another thing. A hold, with the reserve relief re-issued in its published conditional form, earned against private lending. The auctions had already taken the curve down without the Committee’s help; a hold cost little and kept credibility for a November meeting that will carry October’s reset in its data. The structural objection fits in one line: credit access does not widen while freed liquidity channels to government paper.
One development could re-anchor all of it. The government is negotiating a successor arrangement with the IMF: the request Situmbeko Musokotwane, reappointed Finance Minister on 14 September, put on the record in July. A new round of talks was announced on 30 September, as this note closed. The sequence matters. The original 2.1 per cent fiscal deficit, the borrowing ceilings and the primary-surplus path all date from the ECF, and the supplementary that rewrote them arrived after that programme ended. Most of what this note documents is a fiscal year with the anchor removed. A concluded programme restores the anchor as a performance criterion rather than a repealable number, restores the data discipline on exactly the publications this note found defective, and reopens the external financing door. Nothing guarantees the negotiation concludes; the fourth-quarter notes track it alongside the arithmetic.
In five weeks of midwinter, the Republic paid USD1.12bn abroad at 82 to 84 cents on the dollar to insure against its own recovery. At home, over the same months, it rationed pensions and school feeding, spent its deposit buffer in the month before the vote, and ran its revised fiscal deficit ceiling to three quarters gone. The external act was financed, publicised and graded a success. The domestic ledger was published with its signs dropped, scored against a superseded budget, and its reserves cost surfaced 66 days later in a statistical annex. The same state sets the auction cut-offs, the publication calendar and, this week, the policy rate, against an index whose floor its own Treasury had set. The slower verifiers in Table 12, the August MEI, the August reserves and the October credit data, are graded in the October note, exactly as Table 2 grades June’s.
Sources
Bank of Uganda, Treasury bond auction results (Kampala, 9 September 2026) Bank of Zambia, Circular No. 10 of 2026 and Gazette Notice No. 1243 (Lusaka, 31 July 2026) Bank of Zambia, Commercial Banks’ Liquidity fortnightly (Lusaka, August 2026) Bank of Zambia, Daily Exchange Rates to 30 September 2026 (Lusaka, 2026) Bank of Zambia, Fortnightly Statistics (Lusaka, 4 September 2026) Bank of Zambia, Fortnightly Time Series ending 18 September 2026 (Lusaka, 2026) Bank of Zambia, Governor’s Media Presentation, Q3 2026 (Lusaka, 30 September 2026) Bank of Zambia, Monetary Policy Committee Statement for Q3 2026 (Lusaka, 30 September 2026) Bank of Zambia, Public Notice: Issuance of Quarter Four Calendar and the Introduction of the 20-Year Government Bond (Lusaka, 2026) Bank of Zambia, Tender invitations and result sheets, Treasury bills 01/2026 to 19/2026 and bonds 01/2026/BA to 07/2026/BA (Lusaka, 2026) Bank of Zambia, Working Paper WP/2026/2, Are Inflation Expectations in Zambia Anchored? What are the Drivers? (Lusaka, June 2026) Bloomberg composite pricing (CBBT), the Republic of Zambia’s 2033 restructuring bond (1 October 2026) Canary Compass, After the Count (Lusaka, August 2026) Canary Compass, Behind the Petrol and Diesel Pump Price (Lusaka, July 2026) Canary Compass, Copper Output and the 2026 Royalty Arithmetic (Lusaka, January 2026) Canary Compass, Growth Without Diffusion (Lusaka, March 2026) Canary Compass, Seven Stars That Refuse to Align (Lusaka, May 2026) Canary Compass, The Most Expensive Recovery (Lusaka, June 2026) Canary Compass, The Year as a Single Equation, private note (Lusaka, July 2026) Canary Compass, Zambia 2026 Domestic Market Absorption: The Arithmetic Through End-January (Lusaka, 2026) Canary Compass, Zambia Monetary Policy, Part 3: Foundations for Transmission (Lusaka, December 2025) Central Bank of Kenya, Treasury bond auction results (Nairobi, 21 September 2026) Central Bank of Nigeria, open market operations auction results (Abuja, 29 September 2026) CSPR, Press Statement on Mid-Year Budget Performance and Summary Analysis of the 2026 Supplementary Budget (Lusaka, 2026) Debt Management Office Nigeria, FGN bond auction results (Abuja, September 2026) Ecofin Agency, coverage of the Food Reserve Agency board statement (September 2026) Economics Association of Zambia, Policy Reaction Statement on the Monetary Policy Committee Decision (Lusaka, 30 September 2026) Energy Regulation Board, Monthly Wholesale and Pump Price Build-Ups, December 2025 to October 2026, and 2025 Statistical Bulletin (Lusaka, 2026) Energy Regulation Board, Press Release: Revision of Petroleum Pump Prices for October 2026 (Lusaka, 30 September 2026) Food Reserve Agency, 2025 crop marketing season final purchases, per the parliamentary record and official reporting (Lusaka, 2026) Food Reserve Agency, Board Statement on the 2026 Crop Marketing Exercise (Lusaka, 29 September 2026) Government of the Republic of Zambia, Statutory Instrument No. 77 of 2024, The Energy Regulation (Petroleum Products Price Setting) Regulations (Lusaka, December 2024) IMF, Staff Statement on Zambia (Washington DC, May 2026) Kenya National Bureau of Statistics, Consumer Price Index, September 2026 (Nairobi, 2026) Ministry of Finance and National Planning, 2026 Annual Borrowing Plan (Lusaka, 2025) Ministry of Finance and National Planning, 2026 Budget Address (Lusaka, 26 September 2025) Ministry of Finance and National Planning, Debt Statistical Bulletin Q4 2025, Table 27 (Lusaka, 2026) Ministry of Finance and National Planning, Monthly Economic Indicators, January to July 2026 (Lusaka, 2026) Ministry of Finance and National Planning, Supplementary Estimates of Expenditure No. 1 of 2026, as transcribed in ZIPAR and UNICEF (Lusaka, 2026) National Assembly of Zambia, The Supplementary Appropriation (2026) Act, No. 78 of 2026 (Lusaka, assented 4 June 2026) NOAA Climate Prediction Center, ENSO outlook (Washington DC, August 2026) Press reporting of the 14 September 2026 cabinet appointments (Lusaka, September 2026) Press reporting of the Agriculture Minister’s January 2026 statement of the 2.5m-tonne strategic reserve target (Lusaka, 2026) Press reporting of the Agriculture Minister’s May 2026 statement to Parliament on national maize storage capacity (Lusaka, 2026) Press reporting of the Food Reserve Agency’s 540,000-tonne maize export agreement with Kenya’s Baita Trading, signed 9 September 2026 (Lusaka, September 2026) Press reporting of the Bank of Zambia Governor’s 7 July 2026 remarks on reserves (Lusaka, July 2026) Press reporting of the FRA executive director’s 18 September 2026 statement on maize holdings and storage (Lusaka, September 2026) Press reporting of the government’s 30 September 2026 announcement of successor-programme discussions with an IMF mission (Lusaka, October 2026) Press reporting of the kwacha’s inclusion in JP Morgan’s new frontier local-currency bond index (September 2026) Press reporting of the Minister of Finance’s supplementary budget presentation to the National Assembly, including its financing sources (Lusaka, May 2026) rbond.co.za, South African government bond mark-to-market yields (30 September 2026) Republic of Zambia, Tender Offer announcements for the 2053 notes: Amendment and Extension, Early Results and Final Results, RNS (London, 4, 10 and 12 June 2026) Reuters, record of Finance Minister Situmbeko Musokotwane’s programme request (July 2026) Secretary to the Treasury, April 2026 presentation on agricultural arrears, as reported (Lusaka, 2026) Statistics South Africa, Consumer Price Index, July 2026 (Pretoria, 2026) Times of Zambia, “FRA maize purchases hit record K20bn” (Lusaka, 30 September 2026) Uganda Bureau of Statistics, Consumer Price Index, September 2026 (Kampala, 2026) ZAMACE (Zambian Commodity Exchange), market reports on maize offer and regional prices (Lusaka, September 2026) ZamStats, The Monthly, Volume 249 (Lusaka, December 2023), and Monthly Inflation, December 2025 release (Lusaka, December 2025) ZamStats, The Monthly, Volume 276, preliminary 2025 GDP estimates (Lusaka, March 2026) ZamStats, The Monthly, Volume 282 (Lusaka, 25 September 2026) ZIPAR and UNICEF, Mid-Year Budget Performance Analysis Zambia 2026 (Lusaka, August 2026)
All calculations are available for inspection with full workings.
Canary Compass. Structure Before Sentiment.
Disclaimer
This article does not constitute legal, financial, or investment advice. The author shares views for perspective and discussion only. Do not rely on them as a substitute for professional advice tailored to your specific circumstances. Always consult a qualified legal, financial, investment, or other professional adviser before making decisions based on this content. The analysis reflects proprietary research undertaken by Canary Compass and the author.
Canary Compass and the author accept no liability for actions taken or not taken based on the information in this article.
The views expressed in this article represent the author’s independent professional analysis and do not constitute an endorsement of any individual, institution, or position. Canary Compass and the author accept no responsibility for how this content is interpreted, excerpted, or recontextualised by third parties not involved in its production and publication. Reproducing any portion of this work in isolation, or in combination with other material, in a manner that misrepresents the author’s original meaning constitutes a distortion of the published record.
The author may hold positions in financial instruments, currencies, or assets discussed or referenced in this publication. Such positions do not constitute a recommendation to buy or sell.
All views, projections, and forecasts reflect the author’s assessment at the time of writing. Data sourced from third parties is believed to be reliable but has not been independently verified. Past performance does not indicate future results.
All content published by Canary Compass is the intellectual property of the author. Reproduction, adaptation, or redistribution, in whole or in part, requires written permission.
About the Author
Dean N. Onyambu is the Founder and Chief Strategist of Canary Compass, a financial research publication focused on African monetary architecture and financial sovereignty. He brings 18 years of experience across trading, fund leadership, and economic policy, with senior roles at Standard Bank, First Capital Bank, and Opportunik Global Fund.
Read and subscribe at www.canarycompass.com.
The Canary Compass Channel is available on @CanaryCompassWhatsApp for economic and financial market updates on the go.
For more insights from Dean, you can follow him on LinkedIn @DeanNOnyambu or X @InfinitelyDean.