
Zambia Monetary Policy: Structure Before Sentiment. Part 2.75 Interlude: Recap, Corrections, and the Journey of K100
Why the engine cannot transmit what it does not have

0. Executive Summary
This interlude confirms that Zambia’s monetary policy signal is blocked by structure, not intent. Broad money remains shallow at about 29.1% of GDP, almost half of deposits and nearly half of private credit are in foreign currency, and commercial banks hold government securities equal to about 51.0% of local currency deposits. After corrections from the Bank of Zambia, true kwacha-originated private credit is only about 7.4% of GDP, and total private credit is about 13.6%, reaching roughly 10% of firms, with around 63.9% of the loan book concentrated in the top 20 borrowers.
The Journey of K100 shows why the transmission engine barely touches the real economy. Of every new kwacha deposit, about 26.0% is immobilised as reserves, more than 50.0% supports government securities directly or through collateral loops, and the remainder is filtered through a concentrated corporate and salary-backed book. Banks still deliver returns on equity near 30.0% with an aggregated loan-to-deposit ratio of about 46.0%, so they have little incentive to expand broad private lending.
The article then pivots from diagnosis to reform. It maps a live legislative package on banking regulation, deposit insurance, payment systems, agriculture markets, warehouse receipts, food reserves and state-owned enterprises. Part 3 will test whether this package is large enough to shift the ratios in the structural dashboard and to allow future monetary policy decisions to reach households and firms rather than remain in a closed circuit between banks, the state and a select few.
1. Why this interlude exists
This series operates as a working paper. The research is live. The chapters remain open to correction.
Two things refused to sit comfortably as the analysis progressed. When I tried to reconcile loans and advances data with the quarterly macroeconomic indicators, the banking sector performance releases, the fortnightly returns, the latest IMF review, and individual bank numbers, the totals did not align cleanly.
Instead of forcing the numbers to fit the story, I engaged the Bank of Zambia directly and asked them to show me what I was missing.
The central bank team did exactly that. They clarified two definitions that affect how we read the balance sheet. The thesis does not collapse. The charts do not fall apart. The structural picture becomes more precise.
This interlude does three things.
First, it corrects the record on private credit and commercial bank claims on the government using the clarifications from the Bank of Zambia.
Second, it recaps Parts 1, 2, and 2.5 through that corrected lens and separates what changed from what stands as published.
Third, it introduces the Journey of K100 and sets up Part 3, which will focus on corrective mechanisms already in motion rather than a wish list of reforms.
2. Two clarifications from the Bank of Zambia
2.1 Loans and advances in kwacha
In earlier parts of the series, I treated the line labelled ‘loans and advances in kwacha’ as if it represented pure kwacha lending.
The central bank confirmed that this line includes foreign currency loans converted into kwacha for reporting purposes. Banks may book and service the loans in dollars, but the template expresses them in local currency.
This changes how we read the credit charts. Part of the apparent growth in kwacha loans presented in the ‘Loans and Advances (K)’ tab, in the fortnightly, reflects depreciation, inflating the reported value of the existing dollar book. The true base of credit originated in kwacha is smaller than the headline suggests.
2.2 Commercial bank claims on government
The second clarification concerns net commercial bank claims on the central government.
I asked whether the claims reported in kwacha included any foreign currency facilities. The answer is yes. The pool includes both kwacha and foreign currency exposures converted into kwacha at the prevailing exchange rate.
Some of these foreign currency lines can be sizable at particular points in time, but in the reported stock, they remain modest relative to the domestic securities book. Over the last decade, the composition of bank claims on government has shifted decisively away from overdrafts and direct credit toward treasury bills and bonds. The overdraft share has collapsed from about 12.6% of total claims a decade ago to about 2.4% now. Treasury bills and bonds dominate, and these are domestic kwacha instruments.
The clarification matters for completeness. It confirms that even sovereign claims carry some embedded foreign currency sensitivity. But the quantitative effect is limited. The correction on private credit is the one that materially reshapes interpretation.
3. Recap of Parts 1, 2, and 2.5 with corrections applied
The corrections affect how we read the credit charts and the sovereign claims charts. They do not change the money supply charts, the deposit composition charts, or the efficiency metrics. Those stand as published.
3.1 Money supply and the illusion of deepening
These charts survive unchanged.

Chart 1: M1, M2, and M3 as a share of GDP over the last decade

Chart 2: Broad money M3 and the kwacha dollar exchange rate

Chart 3: Monthly growth rate of M3
Broad money sits at about 29.1% of GDP against a decade average of 25.5%. The monthly growth rate of M3 over the decade has averaged 0.1%. The apparent deepening in the ratio comes mainly from valuation effects as the exchange rate moves, not from organic expansion of local currency balances.
When the currency weakens, the kwacha value of foreign currency deposits rises. M3-to-GDP looks deeper even though the real engine under the hood remains roughly the same size.
Part 1 framed the macro and external position. Part 2 showed that the money base is shallow and volatile. The corrections do not touch this part of the story.
3.2 The deposit base: dollarised and impatient
These charts also stand unchanged. The reading becomes more direct.

Chart 4: Composition of broad money M3 showing local and foreign currency components

Chart 5: Foreign currency share of commercial bank deposits through time

Chart 6: Detailed composition showing demand versus time and savings deposits
Almost half of total deposits sit in foreign currency. The foreign currency share has hovered near 50.0% for most of the last decade, spiking briefly to about 60.0% in mid-2021 before returning to baseline. Within the kwacha portion, demand deposits now stand at 24.5% of M3, slightly above time and savings deposits at 22.5% of M3, even though over the last decade, kwacha demand deposits averaged 23.9% of M3 while time and savings deposits averaged 22.5% of M3.
On the foreign currency side, demand deposits currently account for 34.2% of M3, compared with a decade-average of 31.8%. Taken together with the broader structure of the system, these shares show that households and firms hold a larger share of their kwacha and foreign currency balances in short-term demand accounts rather than in term deposits.
This is a dollarised system by default and a short-term system by necessity. Monetary policy operates directly only on the kwacha slice. The dollar slice responds to the Federal Reserve and global commodity prices.
3.3 The 13.6% correction in total private credit
This is the first set of charts that changes meaningfully after the clarification.

Chart 7: Total private sector credit to GDP, current and decade average

Chart 8: Local currency private credit to GDP

Chart 9: Foreign currency private credit to GDP

Chart 10: Foreign currency share of private credit with exchange rate overlay
On the corrected numbers, total private sector credit is about 13.6% of GDP, against a decade-average near 11.5%. Local currency credit stands at about 7.4% of GDP, with a decade average around 6.8%. Foreign currency credit has risen to about 6.2% of GDP, up from a decade-average of 4.7%.
The foreign currency share of private credit now sits around 45.7%, up from a decade average of 40.6%. The chart showing this share overlaid with the exchange rate reveals a clear pattern: as the kwacha weakens, the foreign currency share rises mechanically. Part of this is valuation. Part is genuine demand for dollar credit as firms hedge against further depreciation.
The Enterprise Survey data anchors what this means at firm level. According to the 2019 World Bank Enterprise Survey, only 10.1% of Zambian firms have a bank loan or line of credit, and among small firms, the figure is just 6.3%. For comparison, the Sub-Saharan Africa and lower-middle-income averages for all firms stand at 20.4% and 26.2%, respectively. The IMF’s 2025 Zambia Selected Issues paper cites the same Enterprise Survey results and emphasises the implication: only about 10% of formal firms have access to a loan or line of credit, making limited credit access a central constraint on firm expansion.
A system with private credit of 13.6% of GDP, half of it in foreign currency, reaching one in ten firms, cannot deliver the transmission that models assume. The credit channel is not impaired. It barely exists for most of the economy.
3.4 Sovereign nexus
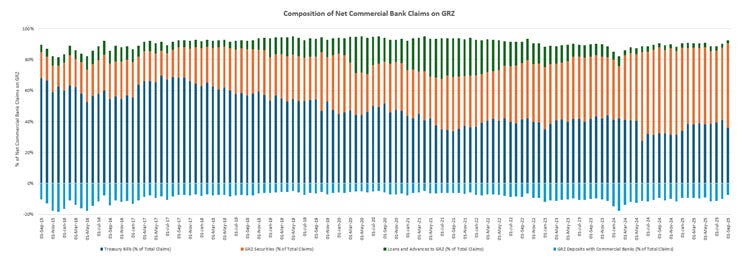
Chart 11: Composition of net commercial bank claims on government by instrument (T-bills, bonds, direct credit)

Chart 12: Net commercial bank claims on government as share of GDP

Chart 13: Composition of net commercial bank credit to government and private sector (stacked area)

Chart 14: Net commercial bank claims on government as share of total credit (single line)
The composition of government claims has transformed. Treasury bills account for about 42.2% of the total (decade average 59.3%), bonds about 64.3% (decade average 39.5%), and direct loans and advances have collapsed to a thin sliver around 2.4% (decade average 12.6%). This is a securities relationship, not a lending relationship.
Net claims on government as a share of GDP stand at about 6.8%, down from a decade-average of around 6.7% and from a peak of roughly 10.8% in April 2021. The government’s share of total credit to the government and private sector peaked at about 51.7% in April 2022 and has since fallen to around 33.0%, now below its decade-average of 36.5%.
The headline crowding out by volume has eased. Nevertheless, the structural preference remains. Local currency government securities carry a 0.0% risk weight under the capital rules, often serve as collateral in large institutional funding relationships, and offer yields that compete with private lending while carrying lower credit risk. In June 2024, the Bank of Zambia introduced a statutory bond facility via a non-competitive auction that allowed banks to meet up to 40.0% of their kwacha statutory reserve requirement with government bonds, turning part of what would otherwise be a non-interest-bearing reserve into an interest-earning asset.
These bonds remain tradable, but if a bank sells them, it must replace them with other eligible reserve assets to remain compliant. The facility keeps a large share of deposits immobilised from private credit while improving returns on that locked share and supporting demand for government paper, which helps explain why sector return on equity remains in the high twenties even as credit to the broader economy stays compressed.
4. Efficiency and exclusion
Before tracing the Journey of K100, three additional dimensions matter. How efficiently does the system deploy deposits? How concentrated is the lending it does produce? And what returns does this structure deliver to shareholders?

Chart 15: Aggregated commercial bank loan-to-deposit ratio through time

Chart 16: Top 20 largest loans as share of total loans

Chart 17: Aggregated commercial bank return on equity (cumulative)

Chart 18: Liquid assets to total deposits and short-term liabilities

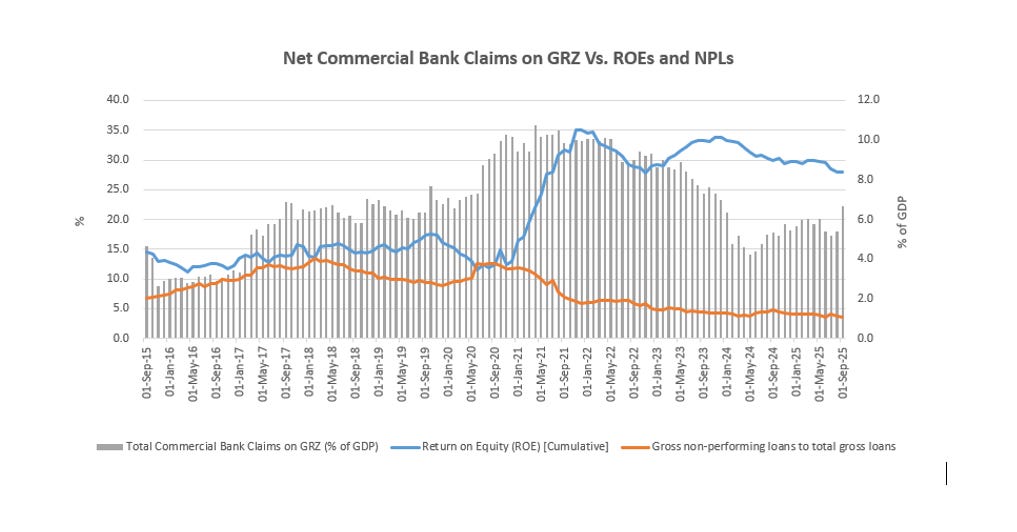
Chart 19: Net commercial bank claims on government versus ROE and NPLs
The loan-to-deposit ratio currently sits around 45.8%, compared to a decade-average of roughly 44.5%. It collapsed from about 60.0% in 2015 to lows below 35.0% in 2023 before a modest recovery. Less than half of what the system collects as deposits becomes loans.
The top 20 borrowers account for about 60.0%–65.0% of the total loan book, up from around 45.0% a decade ago and consistently above the decade average of 56.3%. Concentration has been rising. Lending to the broad economy has been narrowing.
Return on equity remains elevated at around 25.0%–30.0%, well above the decade-average of 21.6%. Banks are profitable. They earn from securities, from fees, and from the spread on a concentrated loan book. They do not need broad credit to generate strong returns.
The combined chart showing government claims alongside ROE and NPLs reveals the relationship directly. As net government claims rose from about 2.5%–5.0% of GDP in 2015–2016 to a peak around 10.8% of GDP by April 2021, ROE climbed in tandem, demonstrating that profitability became increasingly tied to sovereign exposure, particularly after November 2020 when the government lost access to external financing. NPLs spiked to about 13.4% in February 2018 and again to about 12.6% in September 2020 during the debt crisis and drought, but have since moderated to around 3.0%–5.0%. Yet despite cleaner books, the sovereign-bank nexus persists — profitability intact, credit still narrow.
Liquid assets to deposits and short-term liabilities has dropped sharply. The ratio fell from 50.0%–60.0% during 2017–2022 down to 35.0%–40.0% by late 2024 and into 2025. The turning point coincides with the aggressive monetary tightening that began in early 2023. The statutory reserve ratio rose from 9.0% in February 2023 to 26.0% by February 2024. Combined with the January 2024 instruction to sweep government deposits back to the central bank, banks faced a liquidity squeeze that forced them to run leaner buffers.
This is not a sign of weakness. It is a policy outcome. The Bank of Zambia deliberately tightened liquidity to defend the kwacha and fight inflation. It has succeeded on those terms. Inflation fell from a recent peak of 16.8% in March 2025 to 10.9% in November 2025. The policy rate fell from 14.5% to 14.25% in November 2025, the first cut since August 2020. But the private credit channel remains structurally compressed.
5. The Journey of K100

Chart 20: Government securities as a share of local currency deposits

Chart 21: Local currency private credit as a share of local currency deposits

Chart 22: Split of local currency deposits between private credit and government securities

Chart 23: Government deposits with commercial banks as share of GDP (showing January 2024 sweep)
Start with a fresh deposit of K100 in kwacha.
A mix of deposits and shareholder equity funds bank balance sheets, so total assets will usually exceed total deposits. The Journey of K100 does not model the capital structure. Its purpose is simpler. It shows how far a typical kwacha deposit can travel before reserves, regulations, and sovereign demand trap it.
First, statutory reserves claim K26. The reserve requirement currently stands at 26.0%. For banks that did not participate in the June 2024 statutory bond facility, the full K26 sits as cash at the central bank, earning nothing.
For banks that did participate, part of that K26 can be held in government bonds acquired through the facility. The K8.5 billion placement covered nearly 40% of system-wide reserves in June 2024. But local currency deposits have since grown from K83.2 billion to K104.0 billion at the end of September 2025. The same K8.5 billion now covers roughly 31% of reserves at the system level, close to K8 in bonds and K18 in cash for every K100 deposited on average, and shrinking with each new deposit unless another facility is offered.
Second, government securities absorb more than half of kwacha deposits. Chart 20 shows government securities as a share of local currency deposits at about 51.0% currently, compared with a decade-average of 53.5%. The ratio hovered near 70.0% from 2018 through early 2023, then dropped sharply to about 35.0% in early 2024 after the Treasury Single Account sweep pulled government deposits back to the central bank.
This 51.0% includes the reserve-eligible portion. It also reflects a collateral loop. Large institutional depositors, especially pension funds, frequently require banks to pledge government bonds as security for their deposits, particularly when dealing with smaller or less capitalised institutions. To attract this liquidity, those banks are effectively forced to hold government securities, turning bond ownership from an investment choice into a funding necessity. For the portion of pension contributions that originates from wages paid by the state, this creates a closed circuit. The K100 leaves the Treasury as a civil servant salary, a share flows to the pension fund as a contribution, the fund deposits it at a bank, and the bank pledges government bonds to secure that deposit. That slice of the K100 cycles between the state and the financial system without reaching the broader economy.
Third, about K53 becomes private kwacha credit. Chart 21 shows local currency private credit as a share of local currency deposits at around 52.9%, compared with a decade-average of 56.5%. This is the share of kwacha deposits that reaches the private sector as kwacha loans.
How can banks lend 52.9% to the private sector and hold 51.0% in government securities from the same deposit base at the same time? Three factors bridge the gap. Equity and other funding sources add to the asset side. Foreign currency deposits fund some kwacha lending after conversion. And there is overlap between the reserve-eligible bonds counted in the 51.0% and other categories.
The net effect is roughly a 50-50 split of kwacha deposits between private credit and government securities. Chart 22, which shows this split directly, makes the point visually. In 2015 and 2016, about 70.0% went to private credit and 30.0% to government. By 2017 and 2018, the split had equalised. It has stayed near parity since.
Fourth, concentration filters what remains. The top 20 borrowers take 60.0%–65.0% of the loan book. A significant additional slice is salary-backed retail lending to civil servants, which is effectively a secured claim on the government payroll. The true residual available for diverse small and medium enterprise risk is the sliver that remains after large corporates and payroll lending are served.
Chart 23 on government deposits with commercial banks shows the January 2024 sweep in sharp relief. Government and public sector deposits dropped from roughly 1.3% of GDP to around 0.7% in a matter of weeks. These deposits are modest relative to total system deposits, but the episode illustrates how a single instruction from the centre can reshape the banking system’s liquidity profile overnight.
What does this mean for transmission?
When the Monetary Policy Committee changes the policy rate, the signal enters a system where reserves lock more than a quarter of every kwacha deposit, government securities absorb more than half, and a handful of names concentrate the lending that does occur. The rate change affects the marginal cost of funds. It does not unlock the structural blockages.
Three blockages impede the transmission channel.
One. The funding channel. Reserve rules immobilise more than a quarter of every marginal kwacha deposit before it can move.
Two. The substitution channel. Government securities are a superior alternative to private credit because of their yield, zero risk weight, and regulatory utility through reserve eligibility and collateral rules.
Three. The risk channel. Concentrated and dollarised lending leaves banks with limited appetite and capacity for diverse risk, even when the policy rate moves.
This is the real context for any discussion of monetary policy transmission.
6. Structural dashboard and peer comparisons
With the recap, corrections, and Journey of K100 in place, we can now put the core ratios on one page.
The numbers for Zambia are drawn from Bank of Zambia publications from the end of September 2025 and earlier research notes. The peer values are drawn from the World Bank Global Findex, the IMF Financial Soundness Indicators, the World Bank Enterprise Surveys, and central bank publications. Country examples appear under the relevant category.
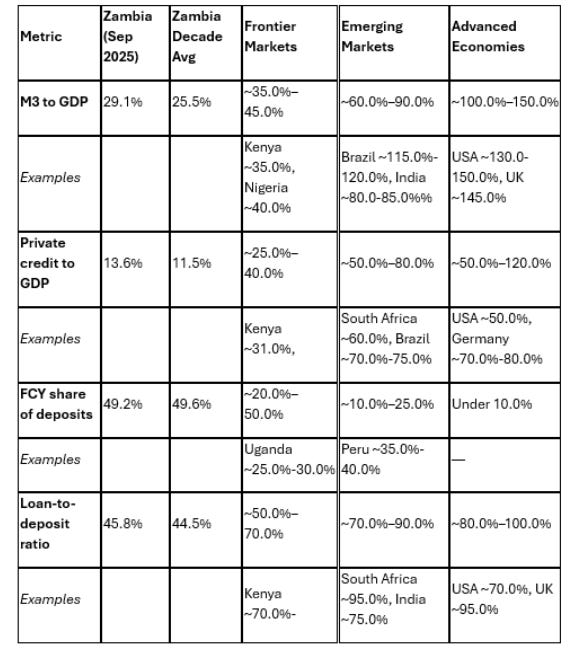
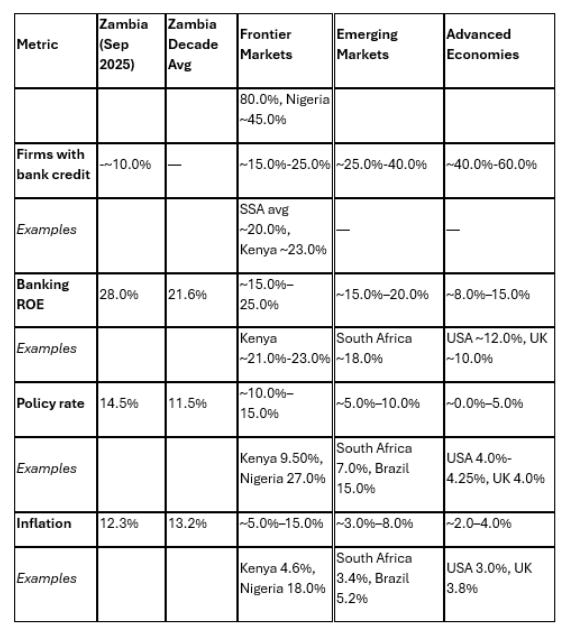
Sources: Bank of Zambia fortnightly, performance indicators, and quarterly data to end September 2025, World Bank Global Findex 2021, IMF Financial Soundness Indicators, World Bank Enterprise Surveys 2019, Trading Economics, and central bank publications for individual country figures.
Zambia sits at the shallow end of frontier markets on money supply and private credit. It sits at the high end on dollarisation and sovereign absorption of deposits. It sits at the low end on firm access to credit and loan-to-deposit efficiency. It sits at the high end on bank profitability and loan concentration.
The structure delivers strong returns to bank shareholders. It funds the sovereign reliably. It does not fund the broad private economy. Comparisons with emerging markets show gaps of two to three times on most transmission-relevant ratios. Comparisons with advanced economies show gaps of five to ten times.
The point is not that Zambia should look like the United States or Germany. The point is that a system with this depth, this currency mix, this level of sovereign anchoring, and this pattern of concentration cannot deliver broad and reliable transmission from a single policy rate. It can defend the currency for a time. It can fund the state. It can support banks that hold government paper. It cannot carry a whole private economy without structural change.
7. From correction to corrective mechanisms
This interlude is the pause before Part 3. It is where we correct our footing and recognise work already underway inside the system.
Three messages should now be clear.
First, the earlier parts of the series captured the direction of travel correctly. The banking engine is shallow, heavily dollarised, and tightly coupled to the sovereign. The clarifications from the central bank sharpen that picture and remove areas of false comfort.
Second, the Journey of K100 shows how statutory reserves, bond eligibility, liquidity buffers, collateral rules, and securities preferences combine to absorb a large share of every deposit before any credit officer sees it. The loan-to-deposit ratio and concentration figures explain why even that remaining share reaches only a small part of the economy.
Third, the crowding out is about volume, currency, and concentration at the same time. Government borrowing and private borrowing both carry foreign currency sensitivities that rise mechanically when the exchange rate moves. Valuation effects inflate balance sheets while real room for risk-taking stays narrow.
Part 3 will focus on the corrective mechanisms already in motion or on the policy table. What distinguishes late 2025 from even six months ago is the scale of legislative action now before parliament. A comprehensive package of bills addresses the financial sector, agricultural markets, and collateral infrastructure simultaneously. This is no longer piecemeal. It is structural.
7.1 The financial sector bills
Three bills now before parliament would reshape the regulatory architecture of the banking system.
The Banking and Financial Services Bill, 2025 (Bill No. 36 of 2025), replaces the Banking and Financial Services Act 2017. This is not an amendment. It is a new principal act. The bill will modernise the licensing, supervision, and resolution framework for banks and financial institutions. It provides the statutory backbone for the prudential toolkit that the Bank of Zambia has been deploying through directives and circulars.
The Zambia Deposit Insurance Corporation Bill, 2025 (Bill No. 38 of 2025) establishes a formal deposit insurance corporation. This moves beyond the draft directives and operationalisation efforts discussed in earlier IMF reviews. Once enacted, the corporation will manage a pooled fund to protect depositors up to a defined threshold in the event of bank failure. This matters for transmission because deposit insurance can gradually reduce the need for extreme liquidity buffers on individual bank balance sheets. Banks currently hold large buffers partly because depositors lack formal protection. A credible insurance scheme shifts some of that burden to the pooled fund, potentially freeing balance sheet capacity for lending.
The National Payment System Bill, 2025 (Bill No. 32 of 2025) provides a legal framework for payment systems, including mobile money and interbank settlement. Payment infrastructure is the plumbing through which monetary policy signals travel. A robust legal basis for payment systems supports both transmission efficiency and financial inclusion.
Together, these three bills represent the most significant overhaul of financial sector legislation since the 2017 Act. The Building Societies (Amendment) Bill, 2025 (Bill No. 3 of 2025) addresses non-bank financial institutions in the same legislative session.
7.2 The agriculture and collateral bills
The agriculture package approved by Cabinet on 29 October 2025 is now before parliament. Three bills form the core.
The Agricultural Marketing Bill, 2025 (Bill No. 35 of 2025) establishes a framework for market-based pricing of agricultural commodities. For years, the Food Reserve Agency operated as a de facto price-setter and buyer of last resort, absorbing fiscal resources and distorting market signals. The bill aims to shift price discovery to markets, positioning the Zambia Agriculture Commodities Exchange (ZAMACE) to play its intended role—one that policymakers never fully enabled it to perform.
The Agriculture Credit and Warehouse Receipts Bill, 2025 (Bill No. 34 of 2025) addresses the collateral constraint directly. It continues the existence of ZAMACE in law, provides for the licensing and regulation of warehouses and warehouse operators, and creates a legal framework for warehouse receipts to function as pledgeable collateral and documents of title. A farmer or aggregator storing grain in a certified warehouse can use the receipt as security for a loan. Banks can lend against inventory rather than land or fixed assets. This matters for the Journey of K100 because it expands the pool of bankable collateral beyond the narrow base that currently exists. If banks accept warehouse receipts and courts enforce them, credit can flow to segments of the economy that statutory reserves and government securities preferences currently bypass.
The Food Reserve Bill, 2025 (Bill No. 33 of 2025) redefines the mandate of the Food Reserve Agency. The intent is to confine FRA to its core function of maintaining strategic food reserves rather than acting as a dominant market participant. This reduces the state footprint in agriculture that the IMF has repeatedly flagged as a structural bottleneck.
The Cotton Bill, 2025 (Bill No. 12 of 2025) addresses a specific commodity chain, establishing transparent pricing mechanisms and recognising the Cotton Association of Zambia as farmer-representative.
The Lands and Deeds Registry (Amendment) Bill, 2025 (Bill No. 13 of 2025) was introduced to improve land administration and to confer powers on the Chief Registrar to cancel certificates of title. Following strong opposition from a wide range of stakeholders, including farmer and land rights organisations, the Parliamentary Committee on Agriculture, Lands and Natural Resources recommended that the Bill be sent back to the Ministry of Justice for further review and consultation. Parliament has deferred the Bill, and it remains on hold pending wider legal and policy scrutiny.
7.3 Dedollarisation
The Bank of Zambia announced draft Currency Regulations, 2024 in June 2024 aimed at restricting the use of foreign currency in domestic transactions. The regulations proposed that quoting, demanding, paying, or receiving payments in foreign currency for domestic transactions would be prohibited, with penalties including fines of up to one million penalty units or imprisonment for up to ten years, or both.
The regulations remain in draft form. Consultations continue. The Bank of Zambia has not issued the statutory instrument that would give the regulations legal force, and Parliament has not enacted any new primary law on dedollarisation. The IMF has expressed caution, stating that forced dedollarisation measures are likely to prove ineffective and could even be counterproductive unless accompanied by a strong macroeconomic stabilisation plan. As at December 2025 the Bank of Zambia continues consultations but the draft regulations remain unenacted.
This stands in contrast to the legislative momentum on financial sector and agriculture bills. Dedollarisation remains a policy intention without statutory force, while the banking, deposit insurance, and agriculture credit bills are proceeding through Parliament.
7.4 The State-Owned Enterprises Bill
The State-Owned Enterprises Bill, 2025 (Bill No. 37 of 2025, N.A.B 37 of 2025) establishes a statutory framework for the governance, classification, and oversight of SOEs. The IMF has flagged SOE performance as a fiscal risk, with a significant share of entities reporting losses and relying on budget transfers and capital injections. The bill incorporates principles from the State Enterprises Policy approved in late 2024, including the creation of a Government Investment Department, clearer classification of state enterprises, and stronger reporting and performance standards, and aims to improve oversight and financial sustainability. This matters for monetary transmission because SOE borrowing and fiscal support compete with private credit for the same pool of domestic financing.
7.5 What does this mean for Part 3?
The legislative picture in late 2025 is more coherent than at any point in recent memory. Parliament is considering bills that address:
The banking regulatory framework (Bill No. 36)
Deposit protection (Bill No. 38)
Payment systems (Bill No. 32)
Agricultural marketing and price discovery (Bill No. 35)
Warehouse receipts and agricultural credit (Bill No. 34)
Food reserve agency reform (Bill No. 33)
SOE governance (Bill No. 37)
This is not piecemeal. It is a structural reform package.
Part 3 will assess whether this package matches the scale of the structural gaps identified in this series. The test for any reform is whether it shifts the ratios in Section 6 or the flows in Section 5.
Does deposit insurance reduce the need for extreme liquidity buffers? Does warehouse receipt legislation expand bankable collateral? Does FRA reform reduce sovereign absorption of fiscal and financial resources? Does the new banking act recalibrate prudential tools to address structural blockages rather than only manage short-term liquidity?
Structure Before Sentiment applies to the reforms themselves. When we understand what exists and what is now before parliament, we can map what is coming and measure whether it matches the scale of the problem.
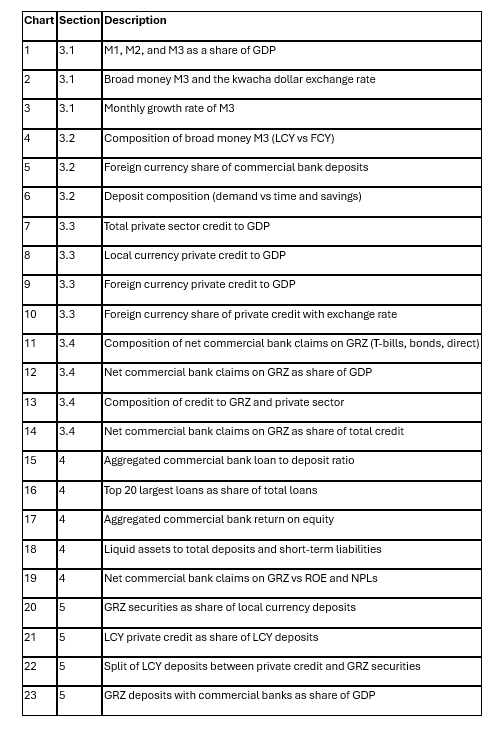
8. Chart Index
For reference, the 23 charts used in this article are:
Disclaimer
This article does not constitute legal, financial, or investment advice. The author shares views for perspective and discussion only. Do not rely on them as a substitute for professional advice tailored to your specific circumstances. Always consult a qualified legal, financial, investment, or other professional adviser before making decisions based on this content.
Canary Compass and the author accept no liability for actions taken or not taken based on the information in this article.
About the author
Dean N. Onyambu is the Founder and Chief Editor of Canary Compass. His insights draw on experience across trading, fund leadership, governance, and economic policy.
The Canary Compass Channel is available on @CanaryCompassWhatsApp for economic and financial market updates on the go.
Canary Compass is also available on Facebook: @CanaryCompassFacebook.
For more insights from Dean, you can follow him on LinkedIn @DeanNOnyambu, X @InfinitelyDean, or Facebook @DeanNathanielOnyambu.