
Zambia’s Financial Account: Corrected Composition, Unchanged Conclusions
Updated classifications from the Bank of Zambia refine the distribution of direct, portfolio, and other investment flows while leaving the external balance and policy interpretation intact

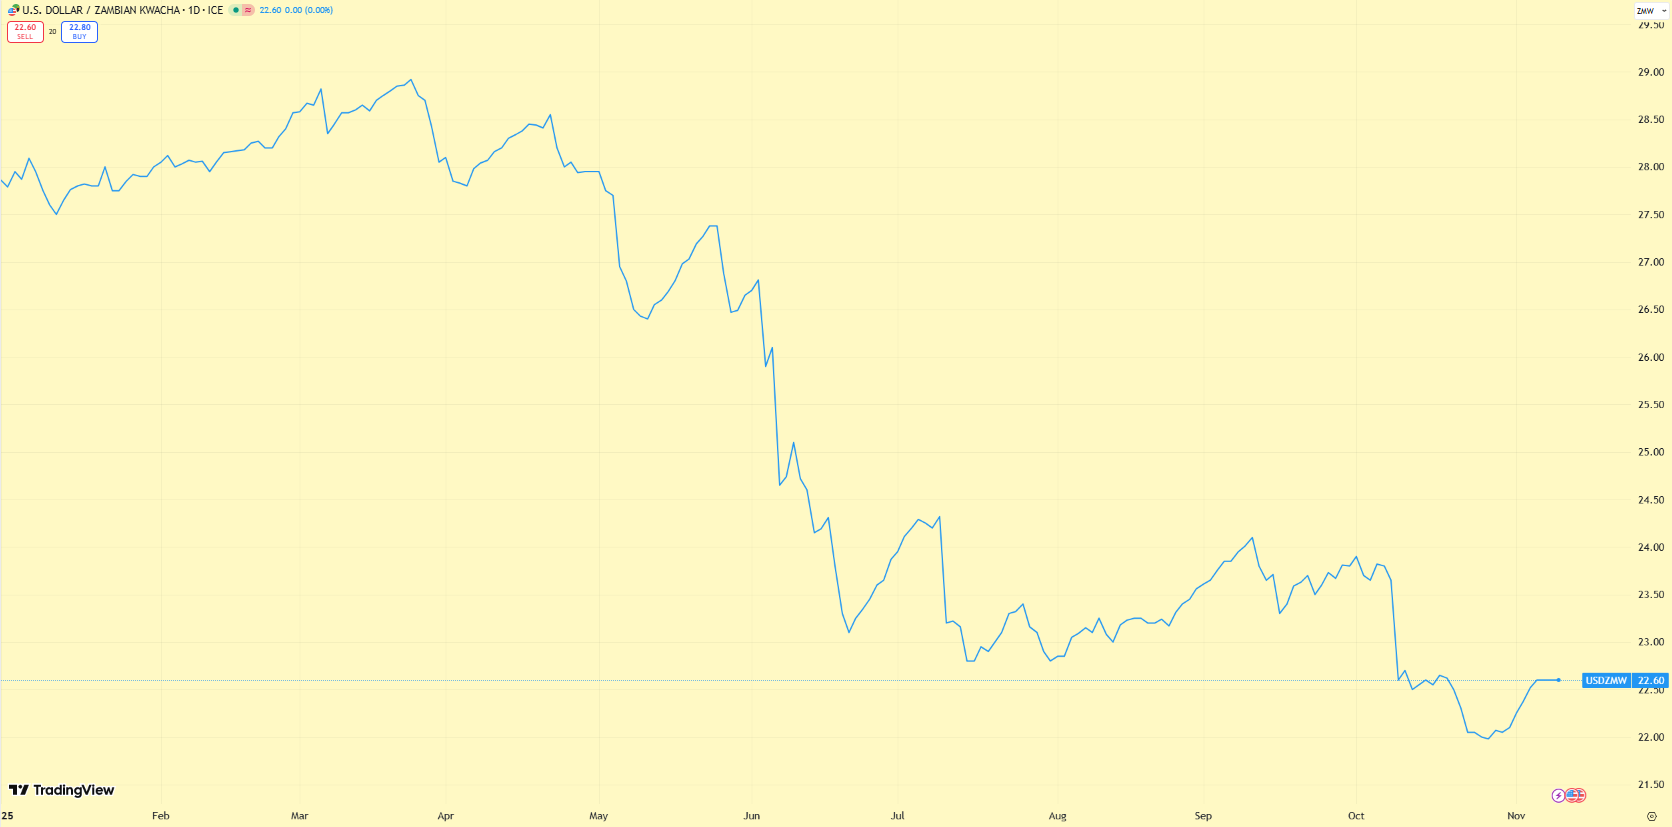
Source: TradingView
0. Executive Intent
This note provides a precise correction to the internal composition of Zambia’s financial account after a detailed technical discussion with the Bank of Zambia. The correction affects only the classification of flows within the financial account. It does not change the headline balances, the overall balance of payments outcome, the current account, the capital account, or the interpretation presented in earlier articles on the exchange rate and monetary policy.
All aggregate numbers remain exactly as initially stated. From Q3 2021 to Q2 2025, the financial account registered a cumulative deficit of $3.38 billion. This headline position is unchanged.
What changes is the distribution of that deficit across four components: direct investment, portfolio investment, other investment, and financial derivatives.
The corrected data show that:
· FDI inflows were significantly stronger than initially interpreted.
· Portfolio flows were net negative, not net positive.
· Other investment outflows remain the dominant structural drain.
· Derivatives remain marginal.
These revisions sharpen the underlying macro conclusion rather than weaken it. They provide a more straightforward explanation for why the kwacha appreciated sharply between April and June 2025 despite a deteriorating financial account and persistent current account pressure. The appreciation did not reflect a broad improvement in FX supply. It reflected positioning, sentiment, and shallow-market dynamics.
This article presents the corrected figures, explains their implications, and demonstrates why the core interpretation remains intact: Zambia’s currency strengthened without a corresponding improvement in earned foreign exchange, and the external position remained under pressure even as investment commitments improved.
1. What Has Not Changed
1.1 Current Account Balance
The current account path is unchanged. Trade, services, income flows, and profit repatriation remain as previously analysed. No component of the current account is affected by the reclassification.
1.2 Capital Account
Capital account entries remain identical to earlier estimates. No revisions affect grants, capital transfers, or project inflows.
1.3 Overall Balance of Payments (BOP)
The overall BOP outcome is unchanged. The balance continues to reflect persistent external pressure, with the cumulative financial account deficit offsetting intermittent relief in the current account.
1.4 Gross International Reserves and FX Market Conditions
Reserve levels and the assessment of the FX market structure remain unchanged from the initial presentation. Reserve improvements continue to reflect mechanical and episodic channels rather than sustained net market purchases.
1.5 Total Financial Account Balance
The aggregate financial account deficit remains at $3.38 billion over sixteen quarters (Q3 2021 to Q2 2025).
Quarterly totals are unchanged:
· Q1 2025: +$60.1 million
· Q2 2025: –$188.1 million
· H1 2025 total: –$128.0 million
Only the internal composition of these totals has changed.
1.6 Inflation Analysis and Monetary Policy Interpretation
The correction does not affect the inflation assessments or the monetary policy conclusions in previous articles. These rely on domestic price dynamics, pass-through behaviour, and the CPI level gap, none of which depend on the reclassification of financial account subcomponents.
1.7 Interpretation of the Q2 2025 Kwacha Appreciation
The conclusion remains intact: the appreciation did not reflect broad-based FX inflows. The corrected distribution sharpens this assessment by showing that FDI was strong but non-liquid, portfolio flows were negative, and other investment remained a persistent drain.
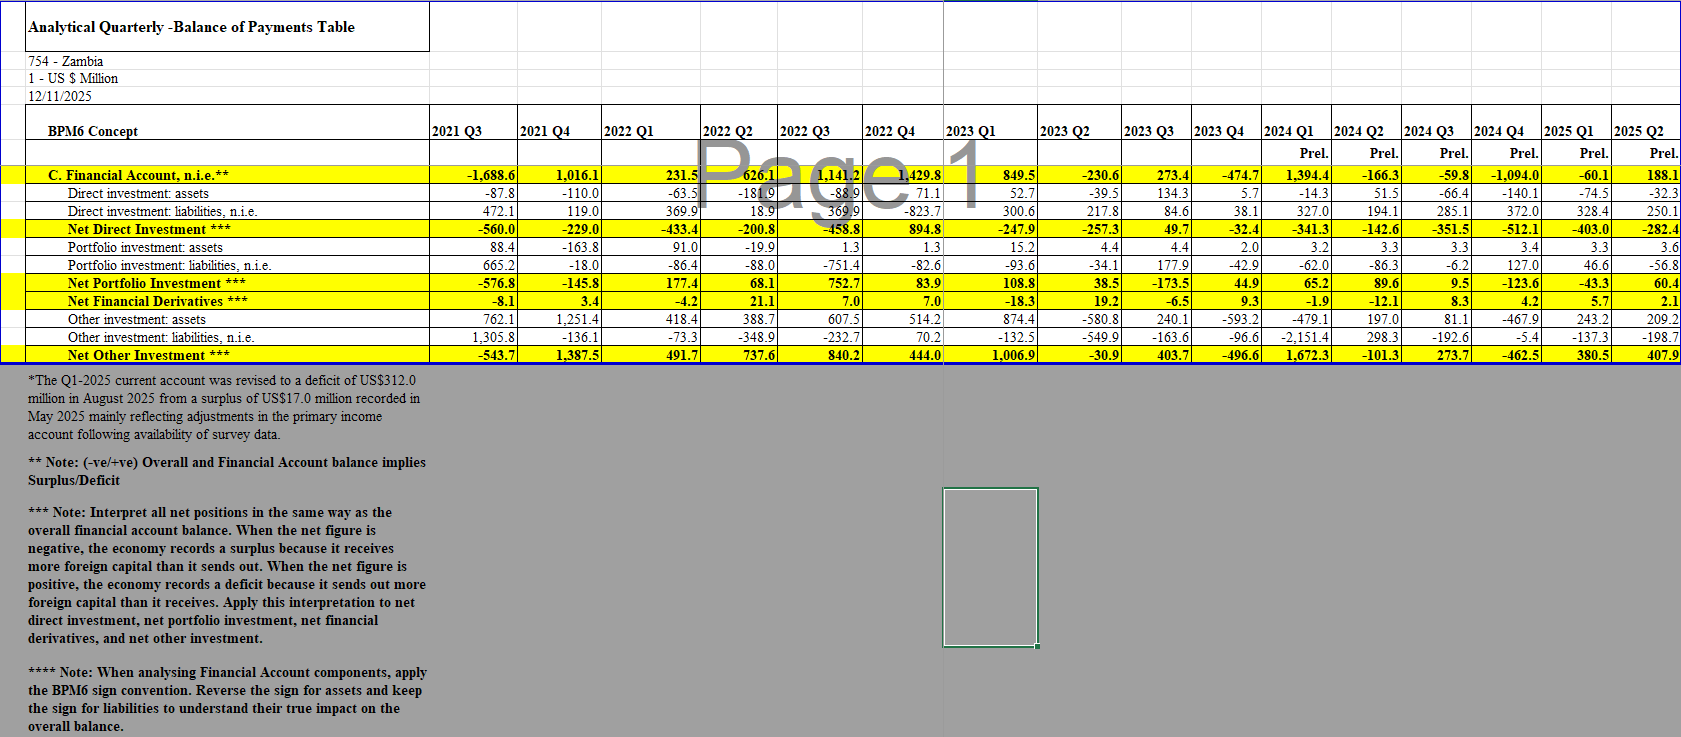
2. What Has Changed
The only revisions relate to the composition of the financial account flows. The totals remain unchanged, but the internal distribution across FDI, portfolio flows, other investments, and financial derivatives has been corrected in accordance with the Bank of Zambia’s clarification.
Source: Bank of Zambia
These changes affect the interpretation within the financial account but do not alter the overall external position, the balance of payments outcome, or any conclusions regarding the exchange rate, inflation and monetary policy made earlier.
The corrected classifications are as follows:
1. Net Direct Investment is significantly higher than previously presented. Zambia attracted strong and consistent inflows in both Q1 and Q2, as well as across the whole sixteen-quarter window.
2. Net Portfolio Investment is lower than previously interpreted and is negative in aggregate. Zambia registered net portfolio divestment in H1 2025 and has registered cumulative divestment over the past sixteen quarters.
3. Net Other Investment is the dominant source of outflows. The corrected dataset reveals substantial offshore asset accumulation by non-financial corporations, households, and non-profit institutions, alongside external debt service from public and private sectors.
4. Financial Derivatives remain a small and stable outflow category.
These changes adjust the internal mechanics of the financial account but do not alter the underlying conclusion. The kwacha appreciated despite the lack of support from broad-based, market-supplied foreign exchange inflows.
3. Corrected Composition of the Financial Account
3.1 Direct Investment (Corrected)
The updated classification shows that Zambia attracted substantially stronger net direct investment than previously interpreted.
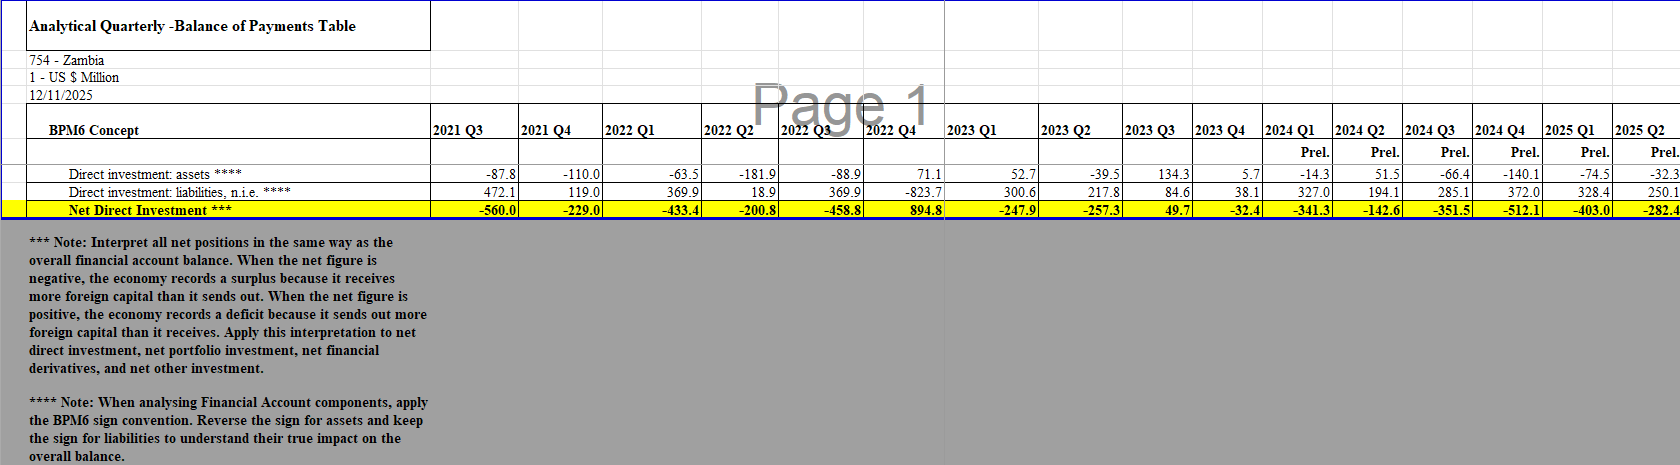
Source: Bank of Zambia
Quarterly detail for 2025
· Q1 2025: +$403.0 million
· Q2 2025: +$282.4 million
· H1 2025 total: +685.3 million
These figures confirm that some headline investment announcements did translate into real inflows. These flows include new equity, expansions of existing projects, retained earnings, and intracompany loans.
Sixteen quarter window (Q3 2021 to Q2 2025)
· Cumulative net direct investment: +$3.51 billion
· Only two quarters show net outflows: Q4 2022 and Q3 2023
This places Zambia’s direct investment climate firmly in positive territory across the entire sample.
Why This Strengthens the Original Interpretation
The correction does not weaken the original argument regarding FX supply because:
· FDI inflows do not always translate into net foreign exchange supply. They largely enter the economy through capital goods imports, contractor payments, and reinvested earnings. These do not always create liquidity in the interbank market.
· The coexistence of strong FDI (+$685.3 million) with a financial account deficit (-$128.0 million) indicates that Zambia’s external pressures persisted over the first half of the year despite investment commitments.
3.2 Portfolio Investment (Corrected)
The corrected data reverses the earlier interpretation of portfolio flows. Instead of net inflows, the updated figures show that Zambia experienced net portfolio outflows across the first half of 2025.
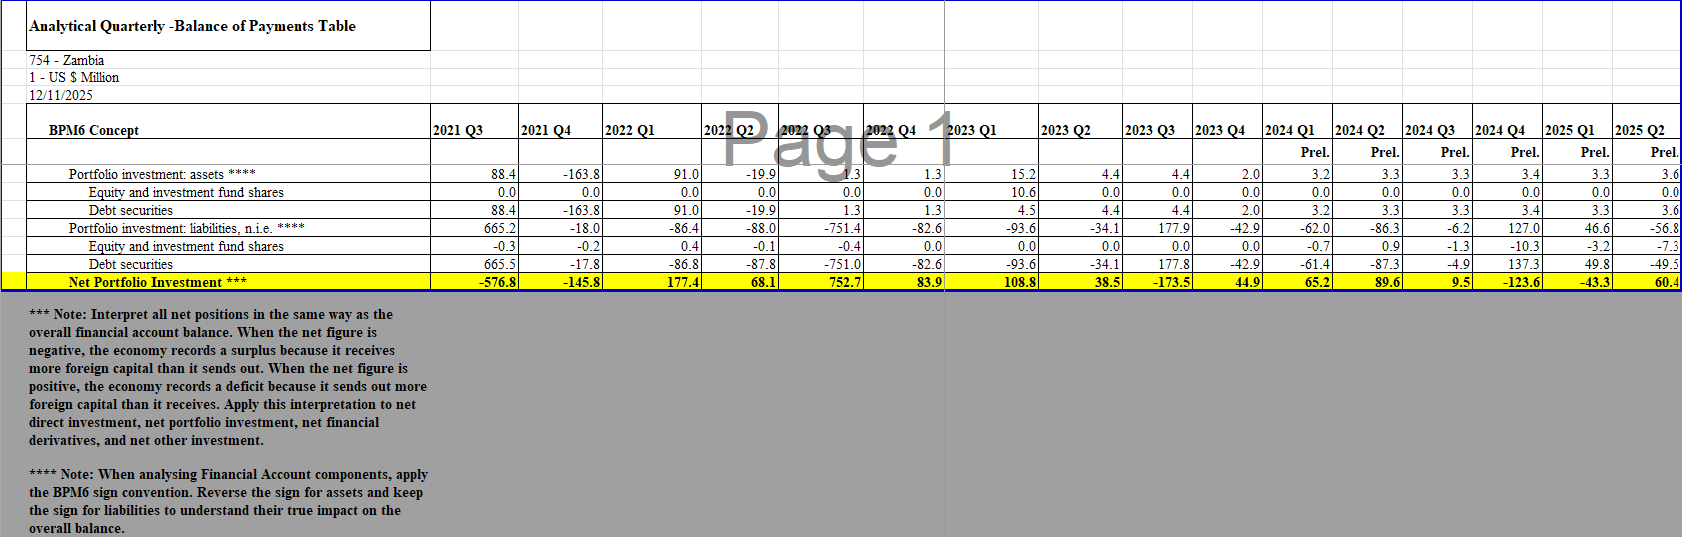
Source: Bank of Zambia
Quarterly detail for 2025
· Q1 2025: +$43.3 million
· Q2 2025: −$60.4 million
· H1 2025 total: −$17.1 million
This correction confirms that foreign portfolio investors did not provide any support to the foreign exchange market during the period of appreciation in the first half of 2025.
Sixteen quarter window (Q3 2021 to Q2 2025)
Cumulative net portfolio flows across the period amount to: −$436.0 million. This reflects two structural features of Zambia’s capital markets:
· The regulatory ceiling limiting non-resident holdings of government securities to 5%, which naturally restricts the scale of offshore participation.
· The shallow size of the domestic capital market reduces the capacity for sustained foreign investor positioning.
Why This Strengthens the Original Interpretation
The corrected portfolio figures reinforce the original argument for two reasons:
· Net portfolio investment outflows totalled $17.1 million in the first half of 2025.
· During the appreciation period, net portfolio investment flows were negative.
The revised data make the initial conclusion more robust. If the currency strengthened despite net negative portfolio flows, then the appreciation could not have been driven by foreign portfolio investor demand.
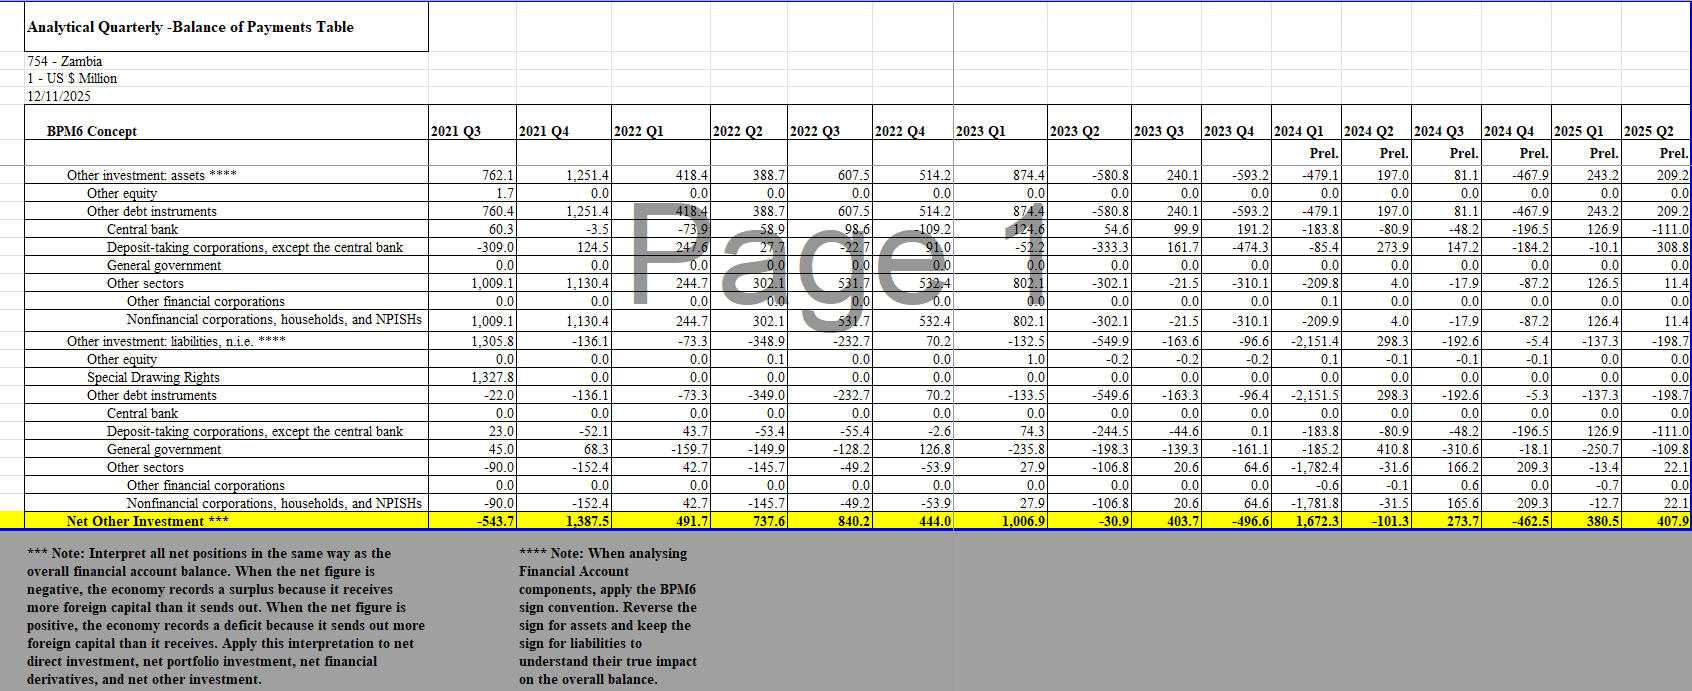
3.3 Other Investment (Corrected)
The corrected data show that other investment outflows remain the dominant source of pressure in the financial account. This component accounts for the most considerable and most persistent drain on Zambia’s external position.
Source: Bank of Zambia
Quarterly detail for 2025
· Q1 2025: −$380.5 million
· Q2 2025: −$407.9 million
· H1 2025 total: −$788.4 million
These magnitudes far exceed the movements in direct investment and portfolio flows across the same period. They show that the financial account deficit was driven overwhelmingly by other investment transactions.
Sixteen quarter window (Q3 2021 to Q2 2025)
Cumulative net other investment flow: −$6.41 billion
Of this total, −$3.75 billion arises from other investment assets accumulated abroad by nonfinancial corporations, households, and non-profit institutions serving households. These entries reflect the offshoring of retained earnings, profit-shifting, and the accumulation of overseas assets by private entities.
A further portion of the deficit, −$1.87 billion, reflects private-sector external debt servicing recorded under other investment liabilities. These outflows represent principal and interest repayments by corporates and reduce foreign exchange availability in the domestic system without generating offsetting inflows.
Composition of other investment outflows
The main categories include:
· Public and private external debt service
Principal repayments and interest payments to external creditors. These are cash outflows that reduce foreign exchange balances.· Deposits abroad by local commercial banks
Zambian banks holding assets in offshore correspondent accounts, often for liquidity, trade finance, or risk management purposes.· Locally held deposits by non-residents
Non-residents depositing, withdrawing or shifting foreign currency balances from Zambian banks.· Other investment assets by non-financial corporations and households
The most significant single contributor. This captures profit retention abroad, offshore savings, and working capital balances held internationally.
3.4 Financial Derivatives (Corrected)
Financial derivatives remain a small and economically insignificant component of the financial account. The corrected data shows minor net outflows across the first half of 2025, consistent with the long-term pattern observed over the sixteen quarters.
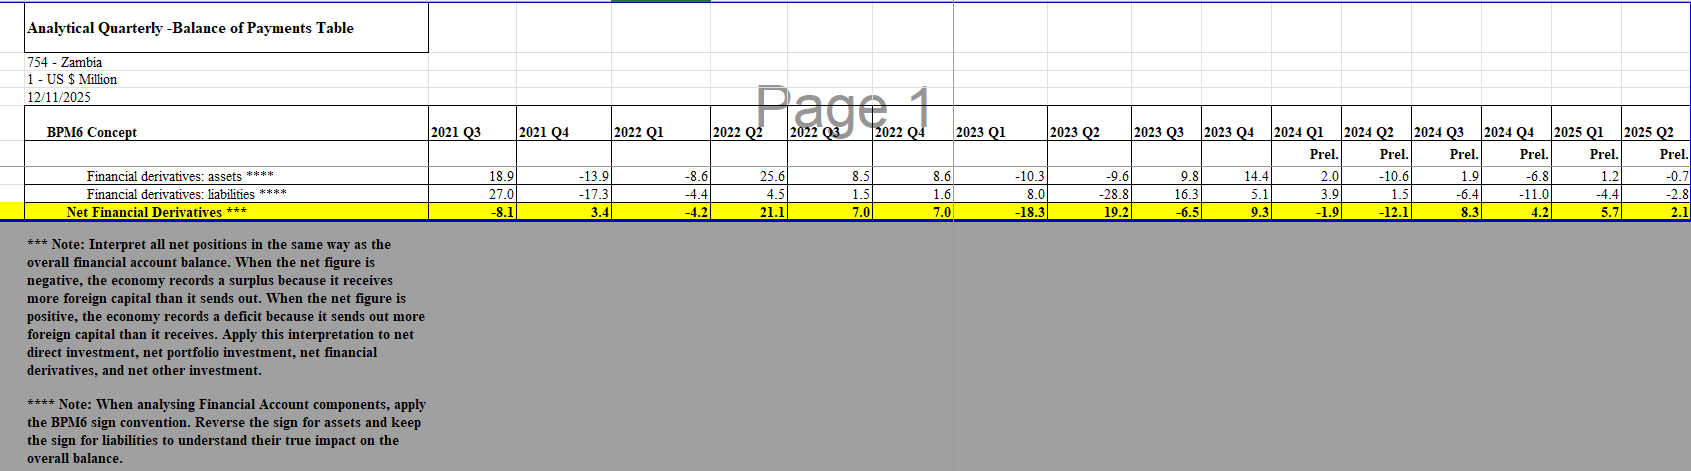
Source: Bank of Zambia
Quarterly detail for 2025
· Q1 2025: −$5.7 million
· Q2 2025: −$2.1 million
· H1 2025 total: −$7.8 million
These figures are negligible compared to the movements in direct investment, portfolio flows, and other investment transactions, in particular.
Sixteen quarter window (Q3 2021 to Q2 2025)
Cumulative net derivatives balance: −$36.1 million
This confirms that financial derivatives have played no meaningful role in shaping Zambia’s external sector dynamics.
4. Implications for the Original Articles
The corrected data enhances the credibility of the original analyses. The articles correctly identified that price moved ahead of fundamentals and that the appreciation lacked durable flow support. The updated classification reinforces this conclusion by showing that even the components previously assumed to be supportive did not materially improve interbank liquidity. The argument that Zambia must prioritise structural foreign exchange earning capacity and maintain discipline in monetary policy remains unchanged.
Disclaimer
This article does not constitute legal, financial, or investment advice. The author shares views for perspective and discussion only. Do not rely on them as a substitute for professional advice tailored to your specific circumstances. Always consult a qualified legal, financial, investment, or other professional adviser before making decisions based on this content.
Canary Compass and the author accept no liability for actions taken or not taken based on the information in this article.
About the author
Dean N. Onyambu is the Founder and Chief Editor of Canary Compass. His insights draw on experience across trading, fund leadership, governance, and economic policy.
The Canary Compass Channel is available on @CanaryCompassWhatsApp for economic and financial market updates on the go.
Canary Compass is also available on Facebook: @CanaryCompassFacebook.
For more insights from Dean, you can follow him on LinkedIn @DeanNOnyambu, X @InfinitelyDean, or Facebook @DeanNathanielOnyambu.