
Zambia’s Kwacha: Strength Without Flow
A forensic assessment of sentiment, balance sheet composition, and sustainability

Source: Bank of Zambia
Editor’s Note: November 12, 2025
This correction follows a detailed technical engagement with the Bank of Zambia regarding the classification of financial account flows. The purpose of this note is to ensure that all published work reflects the most accurate interpretation of the data and maintains the highest standards of analytical integrity. The underlying aggregates of the balance of payments remain unchanged. The revisions relate solely to the internal composition of the financial account.
Scope of the Correction
The headline balances for the current account, capital account, overall financial account, net errors and omissions, overall balance, and reserve movements remain unchanged from their previously published values. The corrected figures affect only the internal distribution within the financial account between direct investment, portfolio investment, other investments, and financial derivatives.
Corrected Figures Referenced
Direct Investment (FDI):
+$685.3 million in the first half of 2025 and a cumulative +$3.51 billion across sixteen quarters (Q3 2021 to Q2 2025).
These flows include new equity, expansions of existing projects, retained earnings, and intracompany loans. The data confirm that some headline investment announcements translated into real inflows, placing Zambia’s direct investment climate in positive territory across the sample period. However, much of this capital entered through capital goods imports, contractor payments, and reinvested earnings, which do not create immediate foreign exchange liquidity in the interbank market.
Portfolio Investment:
−$17.1 million in the first half of 2025 and a cumulative −$436.0 million over the sixteen quarters.
Portfolio flows have therefore remained net negative throughout the review period, reflecting weak foreign participation in domestic securities and the ongoing impact of the 5 per cent cap on non-resident holdings of government securities.
Other Investment:
−$788.4 million in the first half of 2025 and a cumulative −$6.41 billion over the sixteen quarters.
Of this, −$3.75 billion reflects offshore asset accumulation by non-financial corporations, households, and non-profit institutions serving households—essentially, profit retention, offshore savings, and working capital balances held abroad.
A further −$1.87 billion reflects private-sector external debt servicing under other investment liabilities, consisting of principal and interest repayments by corporates. These transactions constitute cash outflows that directly reduce foreign exchange availability within the domestic system.
Financial Derivatives:
−$7.8 million in the first half of 2025 and −$36.1 million cumulatively. These remain negligible and carry no material effect on the overall interpretation.
Impact of the Correction
The correction does not alter the substantive conclusions from earlier analyses. The kwacha’s appreciation remains unsupported by broad-based, market-supplied foreign exchange inflows. The balance of payments continues to reflect structural external pressure. The inflation interpretation and the monetary policy recommendation remain unchanged. If anything, the corrected data strengthen these interpretations by providing a clearer understanding of the sources of foreign exchange leakage and the scale of persistent outflows.
Commitment to Transparency
Revisions of this nature are standard in macroeconomic analysis, particularly when working with complex balance of payments data. Publishing this correction reflects a deliberate commitment to transparency, professionalism, and accuracy. The note builds upon the engagement with the Bank of Zambia and confirms that analytical conclusions remain valid while improving the precision of flow classifications.
While the original article remains unchanged below, readers can access the corrected article through the link below. The corrected note supersedes the earlier interpretation of the financial account composition while preserving all substantive conclusions.
Link to Correction Article:
Zambia’s Financial Account: Corrected Composition, Unchanged Conclusions
1. Curiosity from Kenya
An IMF assessment of the Kenyan shilling recently raised a helpful observation. The institution suggested that central bank foreign exchange operations had constrained appreciation, producing an unusually stable exchange rate despite supportive inflows. From a reserve management perspective, this logic holds. Capital and financial account inflows can reverse easily and often move in tandem with global risk sentiment, while current account improvements tend to materialise slowly (which is the case for Kenya). Allowing rapid appreciation off transient flows risks overshooting the reversal and weakens export competitiveness in the process.
The prudent approach is to use benign global conditions to accumulate reserves and create space for when funding markets tighten. Most of these buffers arise from liabilities, so treating them as permanent capacity misreads the underlying flows. If the trade-weighted dollar (a measure of the USD’s strength against major partners) continues to weaken structurally and current account support becomes more durable, a stronger currency becomes a more credible discussion point. Until then, smoothing the cycle and avoiding boom-and-bust dynamics is good macroeconomic housekeeping.
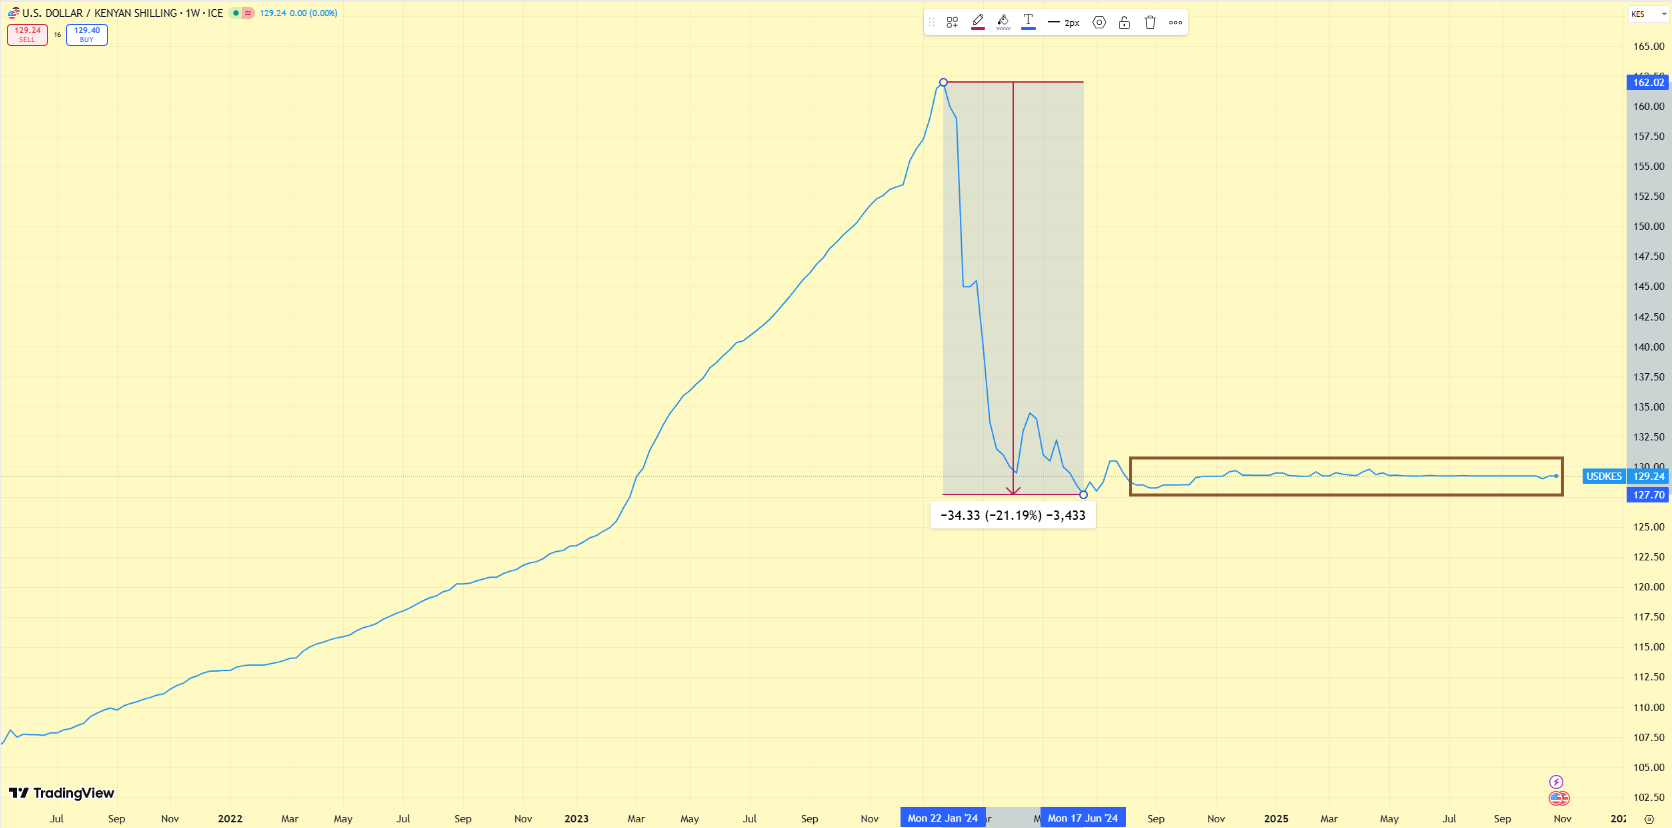
Source: TradingView
That observation raised a broader question. If Kenya is leaning against appreciation to build buffers, what explains Zambia’s rapid currency strength in the first half of the year, and does it reflect the same underlying durability?
2. Bridging to Zambia
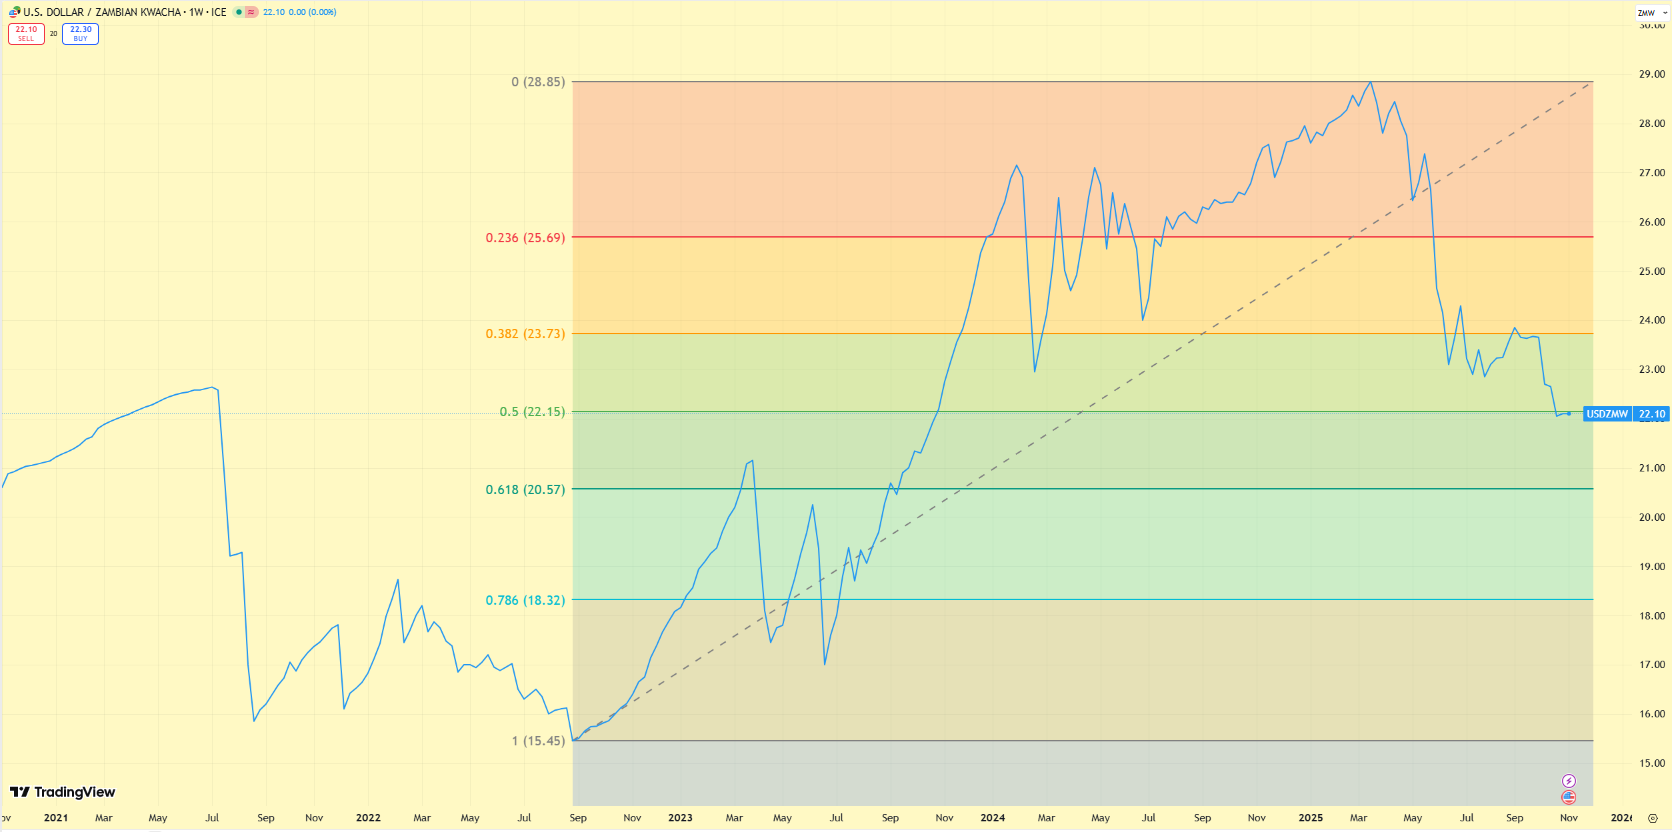
Zambia experienced a sharp appreciation in the first half of the year, with the Kwacha strengthening from an all-time high of 28.850 in mid-March to around 24.380 at the end of June, before continuing to decline to a year-low of approximately 22.000 towards the end of October. The market interpreted the appreciation in the first half as evidence of improving fundamentals and renewed external confidence. The prevailing narrative centred on returning offshore flows, stronger export receipts, and healthier liquidity across the foreign exchange market.
However, exchange rate movements only become meaningful when they align with the underlying flow structure. When currency strength reflects a genuine improvement in the external position, we typically observe a narrowing of balance of payments deficits, reserve accumulation through net market purchases, and a declining reliance on central bank supply. While headline reserves increased in the first half, the balance of payments remained in deficit, and the central bank continued to sell dollars into the market rather than accumulate them through net buying. Mining tax conversions flow directly to the central bank’s balance sheet, so their contribution to reserves does not signal market-driven strength.
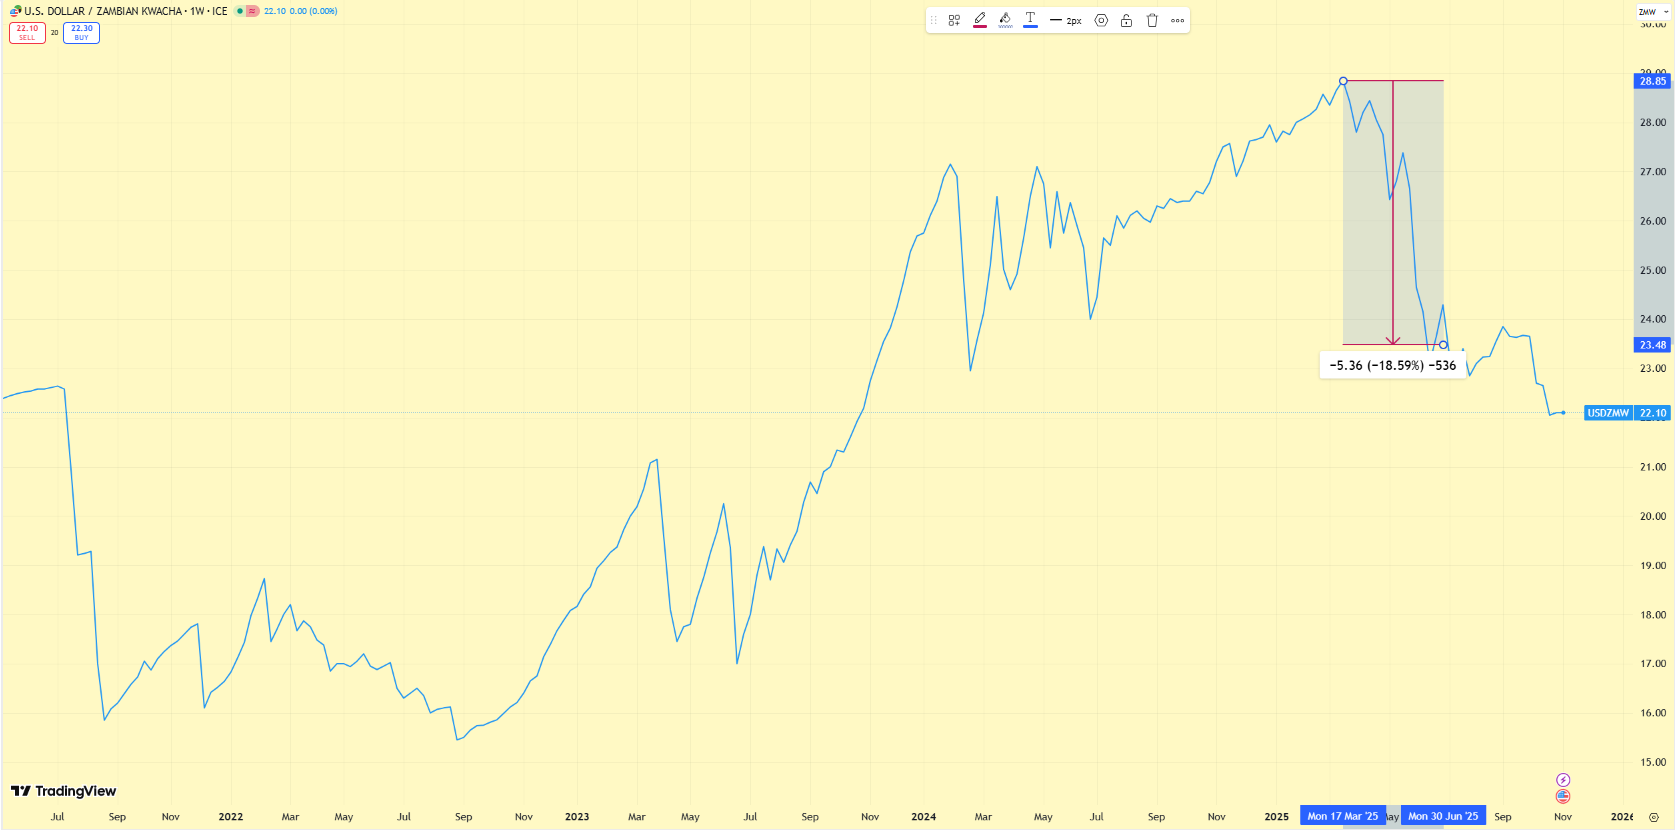
Source: TradingView
If the appreciation reflects sentiment, positioning, and the mechanics of market microstructure where thin liquidity can amplify directional moves, then the narrative of fundamental improvement requires closer scrutiny.
3. Flashback to May and Context
In May, I published an analysis on the Kwacha that was debated across trading desks and policy circles. The core argument was clear: the currency was appreciating faster than fundamentals were improving. At that point, the Kwacha traded near 26.50, a sharp interruption in a long-run depreciation path marked by multi-quarter declines occasionally broken by violent reversals. Domestic debt rollover pressure remained unresolved, and coordination risk between fiscal and monetary policy was rising ahead of the election cycle. The rally offered short-term foreign exchange relief, but deeper structural vulnerabilities persisted.
That context sets the baseline for assessing the currency’s latest move. The forces that mattered in May have not fundamentally changed. They now frame the question of whether the recent strength reflects genuine external resilience or simply another interruption in a persistent structural cycle.
4. Balance of Payments Reality (Q1 to Q2)
The preliminary balance of payments data for the first half of the year challenges the popular view that the Kwacha’s appreciation reflected strengthening external fundamentals. Zambia recorded an overall balance deficit of approximately $197.3 million in the first quarter and a deficit of approximately $159.5 million in the second quarter, resulting in a cumulative deficit of approximately $356.8 million for the first half. These outcomes indicate net absorption of foreign exchange rather than provision.
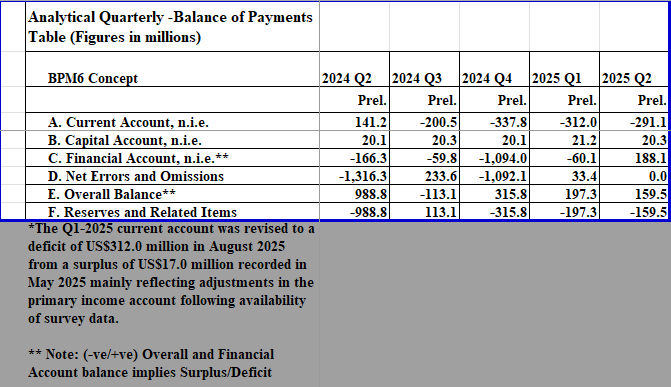
Source: Bank of Zambia
The current account remained in deficit in both quarters, recording $312.0 million in the first quarter and $291.1 million in the second quarter. Persistent external leakage through imports, freight, services, offshoring, and profit repatriation continued to outweigh export earnings. The capital account contributed small surpluses of $21.2 million in the first quarter and $20.3 million in the second quarter. These flows were grant-based and do not indicate market-driven investment interest.
The financial account provided modest support in the first quarter, with a surplus of $60.1 million. It then reversed into a deficit of approximately $188.1 million in the second quarter, reflecting a net capital outflow rather than an inflow. The swing in the financial account removes an important pillar of the fundamental appreciation argument.
Second-quarter data show a large entry under net errors and omissions of approximately $ 299.4 million. This line typically captures timing differences, survey completion, and reconciliation adjustments between the current account and the financial account. Final revisions may compress this figure as more complete reporting arrives. If we zero it out, the second-quarter balance shifts from a deficit of $159.5 million to a deficit of $458.9 million. That adjustment would increase the cumulative external deficit in the first half of the year to approximately $656.2 million. The external sector would therefore reflect increased net foreign exchange absorption across both quarters, rather than an improvement in the net foreign exchange position.
Taken together, none of these flow movements align with a currency that strengthened aggressively. If the external position were improving in a fundamental sense, these balances would move toward surplus or show narrowing deficits. The data points in the opposite direction.
5. The Portfolio Investment Myth
A common explanation for the Kwacha’s appreciation has been a surge in offshore portfolio investment. The data does not support this claim. In the first quarter, Zambia recorded a net portfolio divestment of approximately $46.6 million. In the second quarter, portfolio inflows were modest, at approximately $56.8 million. On a net basis, the first half generated approximately $10.2 million in portfolio investment inflows.
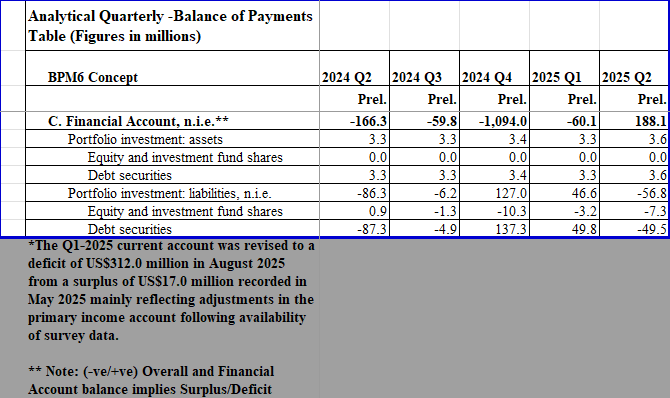
Source: Bank of Zambia
These magnitudes cannot move a currency by several Kwacha. Foreign exchange turnover in Zambia routinely exceeds billions of dollars each quarter once mining taxes, corporate sales, and commercial bank balance sheet activity enter the market. Net portfolio flows of about ten million dollars across six months represent a rounding error in that landscape.
The reserve position reinforces this point. Gross reserves increased by about $387.7 million between December 2024 and June 2025. Portfolio flows accounted for approximately 2.6 per cent of that adjustment. That contribution is not material, and it cannot credibly explain a multi-Kwacha move in the exchange rate.
When we decompose the portfolio line item, the argument weakens further. In the first quarter, offshore investors added approximately $3.2 million to equities while divesting about $49.8 million from bonds. In the second quarter, offshore investors added approximately $7.3 million to equities and approximately $49.5 million to bonds. These changes reflect rotational positioning within a thin market rather than aggressive entry by new foreign investors. The underlying participation base did not expand materially, and the flows lack the scale associated with durable currency strength.
Portfolio flows can support appreciation when they arrive in size, persist across multiple quarters, and signal broad investor conviction. This cycle did not deliver any of those conditions. Their scale was small, and their explanatory power was weak.
6. Market Microstructure Evidence
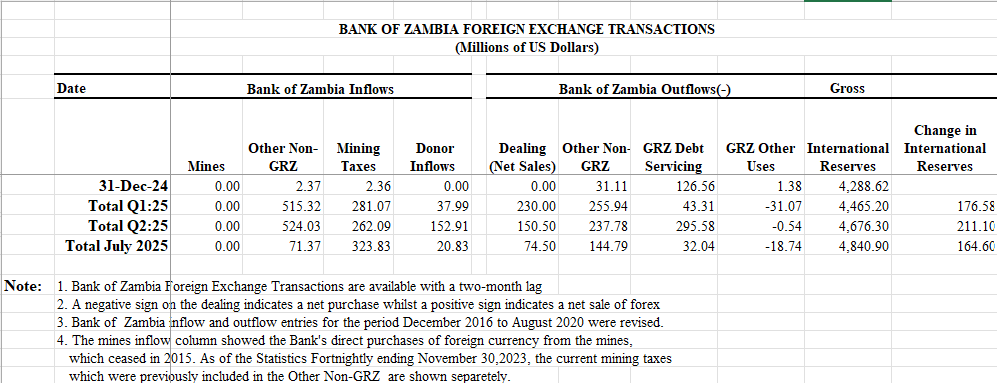
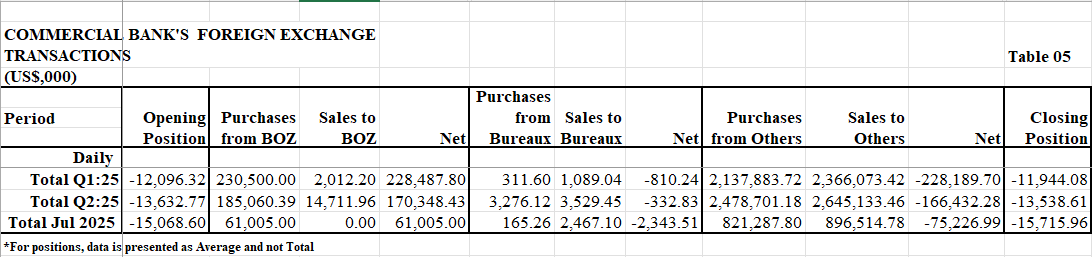
Granular foreign exchange transaction data between the central bank, commercial banks, corporates, and bureaus adds another layer to the picture. In the first quarter, the Bank of Zambia collected approximately $281.1 million from mining tax conversions and net-sold around $228.5 million into the interbank market. Commercial banks then net-sold approximately $229.0 million to corporates and bureaus. The symmetry is striking. Every dollar the central bank supplied entered the market, and real sector demand immediately absorbed it.
Source: Bank of Zambia
Source: Bank of Zambia
The second quarter shows a similar pattern. The central bank collected approximately $262.1 million in mining taxes and net-sold about $170.9 million into the market. Banks net-sold approximately $166.8 million to corporates and bureaus. The slight mismatch likely reflects tactical short-dollar positioning ahead of the half-year mark, rather than a structural improvement in supply. If flows were genuinely overwhelming demand, we would observe an accumulation of foreign currency balances at commercial banks. We did not.
Short positioning reinforces this point. On average, in the first quarter, market participants held approximately $11.9 million of short-dollar exposure per day. In the second quarter, this increased to approximately $13.5 million per day. In July, this rose further to approximately $15.7 million per day. This pattern suggests growing confidence in holding larger short positions, despite a lack of corresponding evidence of stronger flows. It reflects sentiment rather than fundamentals.
Gross purchase and sale activity confirms the recycling dynamic. In the first quarter, commercial banks purchased approximately $2.138 billion from corporates and bureaus. In the second quarter, they purchased approximately $2.482 billion. Banks sold approximately $2.367 billion to corporates and bureaus in the first quarter and about $2.649 billion in the second quarter. The increase in both supply and demand left no net build in foreign currency liquidity. The banking system did not accumulate dollars at any point, despite higher turnover.
The conclusion is simple. If inflows were genuinely overwhelming demand, commercial banks would have emerged as net buyers in the interbank market and would have carried higher foreign currency inventories. Instead, they consistently recycled central bank supply into real sector demand. That behaviour signals a narrow flow channel driven by sentiment rather than a broad-based improvement in the external position.
7. The Reserve Accounting Puzzle
Based on the balance of payments, Zambia’s external position in the first half should have produced a decline in reserve assets. Instead, fortnightly data from the Bank of Zambia reports an increase of approximately $176.6 million in the first quarter and about $211.1 million in the second quarter. That divergence requires explanation.
Part of the adjustment reflects the dynamics of foreign currency deposits. Dollar-equivalent foreign currency deposits in the banking system increased from approximately $3.484 billion at the end of December 2024 to approximately $4.041 billion at the end of June 2025. Applying the 26 per cent statutory reserve ratio to foreign currency deposits implies a reserve boost of approximately $144.7 million. This component is mechanical. It improves headline reserve adequacy but does not reflect market-driven strength.
The remainder reflects external disbursements that do not move through the balance of payments account or are awaiting reconciliation in subsequent releases. These include donor inflows, project financing, exceptional financing, and multilateral support. Statistical revisions will compress timing differences and survey updates under net errors and omissions as the data finalises. These items are recorded on the balance sheet as liabilities and can raise reserves without increasing export earning capacity. They help smooth volatility, but they do not represent a structural improvement in the external position. When the underlying flows turn, the obligations behind these buffers require refinancing, rollover, or repayment.
Headline reserve accumulation, therefore, overstates the degree of durable improvement in external resilience. The composition matters. Liability-driven buffers improve optics in the short term, but they do not transform the country’s ability to earn foreign exchange. Treating them as permanent strength misreads the nature of the balance sheet.
8. Why This Strength Is Not Flow Driven
Taken together, the evidence shows a straightforward conclusion. The Kwacha’s appreciation in the first half of the year did not stem from a structural improvement in Zambia’s external position. The current account remained in deficit, portfolio flows were minimal, and commercial banks did not accumulate excess foreign currency balances.
When appreciation is genuinely flow-driven, foreign currency accumulates somewhere in the system. Banks hold surplus balances, balance of payments deficits narrow, and demand in the real sector eases relative to supply. None of these conditions emerged in the first half of the year. Every dollar supplied into the market was absorbed immediately, and no residual liquidity built up in the banking system.
The appreciation, therefore, reflects sentiment, positioning, and FX market microstructure dynamics rather than a fundamental improvement in Zambia’s external earning capacity. That distinction matters. When flows do not improve, the price eventually realigns with fundamentals. Sentiment can reverse far faster than structural conditions can change, and when that happens, price reversion tends to be abrupt rather than gradual.
9. Forward Risks and Policy Dependencies
The outlook hinges on whether Zambia can maintain policy discipline as it enters a politically charged period. Election proximity typically brings campaign-related public expenditure, rising domestic liquidity, and widening fiscal deficits. Without credible coordination between fiscal and monetary authorities, these pressures can migrate into the foreign exchange market, undermining currency stability.
A key stabiliser in the near term will be the extension of the IMF Extended Credit Facility beyond its current expiry. Authorities have signalled their intention to pursue programme continuity, and approval by the IMF Board would anchor expectations around spending, debt issuance, and reserve management through the election cycle. Another important variable is the timing of the de-dollarisation reforms. Successful implementation requires careful sequencing, credible enforcement, and equitable treatment across sectors. Poorly timed execution or exemptions could amplify volatility rather than contain it.
External conditions will also influence the currency. A structurally weaker United States dollar would support the Kwacha’s current level, while a sustained dollar rally would raise the hurdle for further appreciation in the absence of supportive domestic flows.
Forward risks are therefore less about the current exchange rate level and more about the policy architecture that supports it. If authorities secure programme continuity, contain fiscal expansion, execute de-dollarisation with discipline, and the United States dollar does not strengthen sharply, currency volatility should remain manageable. If any of these pillars weaken, the appreciation observed in the first half of the year could unwind quickly.
Stability rests on four pillars:
• IMF programme continuity
• Fiscal containment
• De-dollarisation discipline
• Absence of broad dollar strength
If these pillars hold, volatility remains contained. If they weaken, the exchange rate will adjust.
10. Personal Market View: Structural Geometry of Price
Price action adds a complementary lens to the flow narrative. Drawing Fibonacci retracement geometry from the August 2022 swing low at 15.450 to the March 2025 peak at 28.850 highlights a textbook emerging market retracement sequence. Initial support near 25.690 failed, and the currency subsequently tested and broke through the shelf near 23.730 before moving lower. The Kwacha currently trades near the 50% retracement at 22.150. Emerging market currencies often consolidate around this midpoint in the absence of decisive flow catalysts. Nevertheless, a decisive break below this region exposes deeper structural support near 20.570, where tactical long-horizon buyers typically emerge. These levels, however, do not resolve the disconnect between flows and price.
Source: TradingView
Valuation signals align with the same conclusion. In July, when the Kwacha averaged 23.410, it was 16 to 17 per cent above its estimated fair value, which ranged between 27.200 and 27.500. In frontier markets, real effective exchange rate valuations typically fluctuate within approximately plus or minus 5 per cent of the estimated fair value when external conditions are stable. Deviations exceeding 10 per cent generally require either durable net foreign currency inflows, significant terms of trade gains, or observable expansion in export earning capacity. Zambia’s deviation of approximately 16 to 17 per cent exceeds both thresholds, and none of the structural drivers that justify persistent misalignment are present in the current balance of payments.
When price moves ahead of fundamentals, convergence eventually occurs. Timing remains uncertain, but direction becomes clearer when key anchors weaken. The current account remains negative. Gross reserves are not increasing through sustained net market purchases. Export earning capacity has not materially expanded. Without structural inflows, maintaining appreciation becomes challenging as positioning adjusts and sentiment cools.
The external backdrop has also tilted. The United States dollar index recently registered intermediate bullish confirmation (50-day simple moving average [SMA] has crossed above 100-day SMA) on daily charts, a technical formation that can signal momentum when reinforced by macro conditions. Meanwhile, the United States repo market liquidity has tightened, which tends to support the dollar at the margin. A firmer dollar environment raises the hurdle for frontier currencies to appreciate unilaterally without supportive domestic flows.
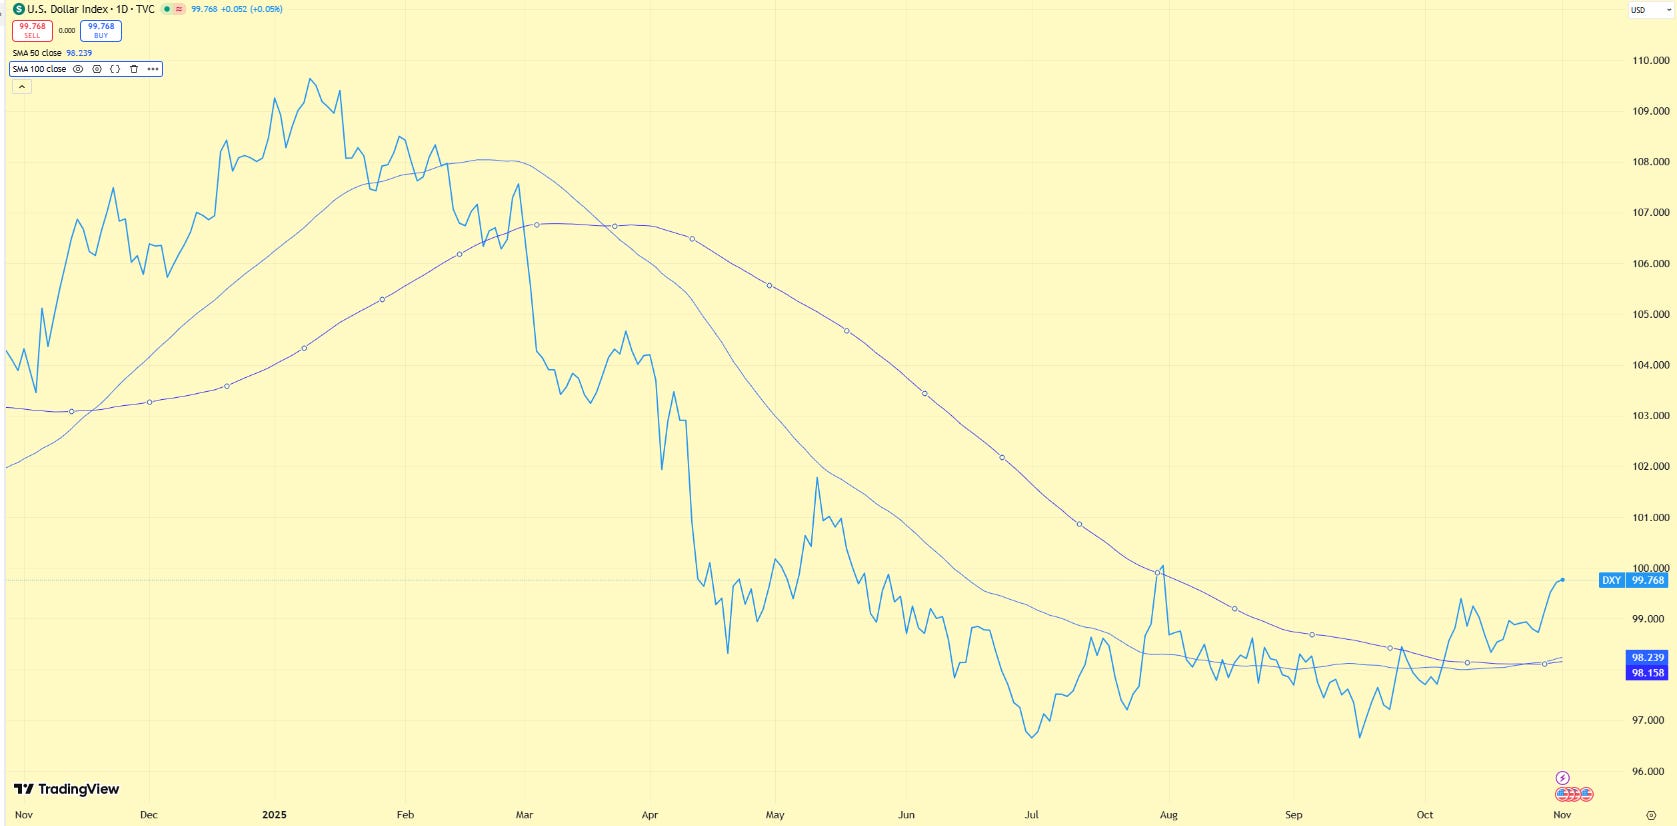
Source: TradingView
In May, I struggled to make a bullish case for the Kwacha. I grounded that view in experience trading the currency across many cycles rather than in a formal fair value estimate. Today, valuation metrics, flow dynamics, and external signals point in the same direction. From this vantage point, accumulating dollars on dips represents rational positioning rather than pessimism. Bias leans toward long United States dollar against the Kwacha on sustained breaks below 22.000.
De-dollarisation initiatives remain a caveat. Regulatory incentives could encourage conversion of foreign currency deposits through a balance sheet reclassification rather than through new foreign currency inflows. However, even if conversions materialise, the currency still sits several Kwacha stronger than fair value estimates suggested in July. The impact of conversions depends on balance sheet mechanics rather than announcement effects.
The bottom line is straightforward. The economy needs more sustainable net inflows to justify the strength observed in the first half of the year. The third quarter balance of payments release will be important for determining whether anything has fundamentally changed. As of the first half of the year, the balance of payments deficit stands at $356.8 million. Price has outpaced fundamentals. Convergence is patient but inevitable. Technical geometry highlights where sentiment meets structure.
Without new durable inflows, convergence toward fair valuation bands is a function of timing rather than possibility.
11. Closing Reflection
The contrast between Kenya and Zambia reinforces a principle often missed in currency discussions. Currency strength is not the same as currency health. Strength reflects the price level. Health reflects the flow structure, the buffers accumulated, and the durability of those buffers over time.
Kenya converted periods of currency strength into reserve accumulation by purchasing foreign currency and easing speculative pressure. Zambia experienced appreciation without building equivalent buffers. Real sector demand absorbed every dollar supplied into the market, and commercial banks did not accumulate surplus foreign currency balances. The central bank did not become a net buyer. Instead, it tolerated appreciation more readily than depreciation, which allowed the currency to strengthen without flow support.
Market structure amplified this outcome. Position limits and regulatory constraints reduced speculative capacity on the upside, while improving sentiment encouraged larger short dollar positioning. Thin liquidity transmitted price changes more rapidly than fundamentals justified. As positioning built, price moved ahead of flows.
In benign global conditions, the priority is not to celebrate price action but to strengthen balance sheets before the cycle turns. When fundamentals drive appreciation, reserves rise through net market purchases, and commercial banks hold excess foreign currency. When sentiment and positioning drive appreciation, liability-driven inflows, deposit mechanics, and external disbursements lift reserves. The composition of reserves matters more than the headline number.
Evidence from the first half of the year points toward sentiment-led appreciation rather than flow-driven strength. The current account remained negative. The balance of payments reflected a deficit of $356.8 million. Commercial banks did not accumulate foreign currency balances. Headline reserves increased, but not through sustained net market purchases or export-earned surpluses.
Policy execution will now determine whether this performance transitions into genuine resilience. Programme continuity under the IMF, discipline around pre-election fiscal expansion, and a credible sequencing of de-dollarisation will anchor stability. Without supportive flows, sentiment loses altitude and price converges toward balance sheet reality.
The exchange rate tells a story about sentiment, positioning behaviour, regulatory constraint, and central bank tolerance. The balance sheet behind the exchange rate tells a story about sustainability. In the months ahead, sustainability will matter more than price.
Disclaimer
This article does not constitute legal, financial, or investment advice. The author shares views for perspective and discussion only. Do not rely on them as a substitute for professional advice tailored to your specific circumstances. Always consult a qualified legal, financial, investment, or other professional adviser before making decisions based on this content.
Canary Compass and the author accept no liability for actions taken or not taken based on the information in this article.
About the author
Dean N. Onyambu is the Founder and Chief Editor of Canary Compass. His insights draw on experience across trading, fund leadership, governance, and economic policy.
The Canary Compass Channel is available on @CanaryCompassWhatsApp for economic and financial market updates on the go.
Canary Compass is also available on Facebook: @CanaryCompassFacebook.
For more insights from Dean, you can follow him on LinkedIn @DeanNOnyambu, X @InfinitelyDean, or Facebook @DeanNathanielOnyambu.